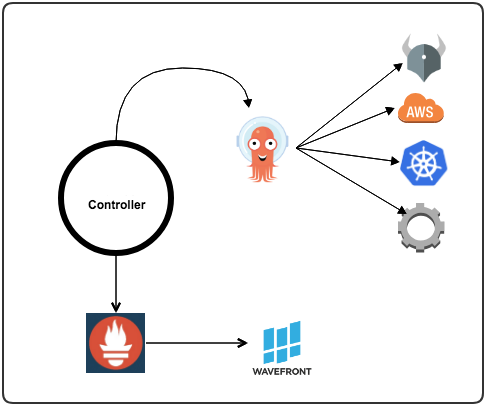
Active-Monitor is a Kubernetes custom resource controller which enables deep cluster monitoring using Argo workflows.
While it is not too difficult to know that all entities in a cluster are running indvidually, it is often quite challenging to know that they can all coordinate with each other as required for successful cluster operation (network connectivity, volume access, etc).
Active-Monitor will create a new health namespace when installed in the cluster. Users can then create and submit HealthCheck objects to the Kubernetes server. A HealthCheck is essentially an instrumented wrapper around an Argo workflow.
The workflow is run periodically, as definied by repeatAfterSec property in its spec, and watched by the Active-Monitor controller.
Active-Monitor sets the status of the HealthCheck CR to indicate whether the monitoring check succeeded or failed. External systems can query these CRs and take appropriate action if they failed.
Typical examples of such workflows include tests for basic Kubernetes object creation/deletion, tests for cluster-wide services such as policy engines checks, authentication and authorization checks, etc.
The sort of HealthChecks one could run with Active-Monitor are:
- verify namespace and deployment creation
- verify AWS resources are using < 80% of their instance limits
- verify kube-dns by running DNS lookups on the network
- verify kube-dns by running DNS lookups on localhost
- verify KIAM agent by running aws sts get-caller-identity on all available nodes
- Kubernetes command line tool (kubectl)
- Access to Kubernetes Cluster as specified in
~/.kube/config - Argo Workflows Controller
# step 0: ensure that all dependencies listed above are installed or present

# step 1: install argo workflow controller
kubectl apply -f https://raw.githubusercontent.com/keikoproj/active-monitor/master/deploy/deploy-argo.yaml

# step 2: install active-monitor CRD and start controller
kubectl apply -f https://raw.githubusercontent.com/keikoproj/active-monitor/master/config/crd/bases/activemonitor.keikoproj.io_healthchecks.yaml
kubectl apply -f https://raw.githubusercontent.com/keikoproj/active-monitor/master/deploy/deploy-active-monitor.yaml
# step 0: ensure that all dependencies listed above are installed or present

# step 1: install argo workflow-controller
kubectl apply -f deploy/deploy-argo.yaml

# step 2: install active-monitor controller
make install
kubectl apply -f deploy/deploy-active-monitor.yaml

# step 3: run the controller via Makefile target
make run
Create a new healthcheck:
kubectl create -f https://raw.githubusercontent.com/keikoproj/active-monitor/master/examples/inlineHello.yaml
OR with local source code:
kubectl create -f examples/inlineHello.yaml
Then, list all healthchecks:
kubectl get healthcheck -n health OR kubectl get hc -n health
NAME                 AGE
inline-hello-zz5vm   55s
View additional details/status of a healthcheck:
kubectl describe healthcheck inline-hello-zz5vm -n health
...
Status:
  Failed Count:              0
  Finished At:               2019-08-09T22:50:57Z
  Last Successful Workflow:  inline-hello-4mwxf
  Status:                    Succeeded
  Success Count:             13
Events:                      <none>
activemonitor.keikoproj.io/v1alpha1/HealthCheckargoproj.io/v1alpha1/Workflow
apiVersion: activemonitor.keikoproj.io/v1alpha1
kind: HealthCheck
metadata:
  generateName: dns-healthcheck-
  namespace: health
spec:
  repeatAfterSec: 60
  description: "Monitor pod dns connections"
  workflow:
    generateName: dns-workflow-
    resource:
      namespace: health
      serviceAccount: activemonitor-controller-sa
      source:
        inline: |
            apiVersion: argoproj.io/v1alpha1
            kind: Workflow
            spec:
              ttlSecondsAfterFinished: 60
              entrypoint: start
              templates:
              - name: start
                retryStrategy:
                  limit: 3
                container:
                  image: tutum/dnsutils
                  command: [sh, -c]
args: ["nslookup www.google.com"]kubectl -n health port-forward deployment/argo-ui 8001:8001
Then visit: http://127.0.0.1:8001
Active-Monitor controller also exports metrics in Prometheus format which can be further used for notifications and alerting.
Prometheus metrics are availabe on :2112/metrics
kubectl -n health port-forward deployment/active-monitor-controller 2112:2112
Then visit: http://localhost:2112/metrics
Active-Monitor, by default, exports following Promethus metrics:
healthcheck_success_count- The total number of successful monitor resourceshealthcheck_error_count- The total number of errored monitor resourceshealthcheck_runtime_seconds- Time taken for the workflow to complete
Active-Monitor also supports custom metrics. For this to work, your workflow should export a global parameter. The parameter will be programatically available in the completed workflow object under: workflow.status.outputs.parameters.
The global output parameters should look like below:
"{\"metrics\":
  [
    {\"name\": \"custom_total\", \"value\": 123, \"metrictype\": \"gauge\", \"help\": \"custom total\"},
    {\"name\": \"custom_metric\", \"value\": 12.3, \"metrictype\": \"gauge\", \"help\": \"custom metric\"}
  ]
}"
Please see CONTRIBUTING.md.
The Apache 2 license is used in this project. Details can be found in the LICENSE file.
Instance Manager - Kube Forensics - Addon Manager - Upgrade Manager - Minion Manager - Governor


