Advancement of UAV, deep Learning and cutting edged technologies and papers in Precision Agriculture. (contribution are welcome)
- Overview of PA
- Recent Advanced Plant Phenotyping
- General Auxiliary Datasets for PA
- Tools, Library
- Community
- Software programs
- Note
- Definition (WIKI, ScienceDirect)
- Overview of Precision Agriculture (Cisternas et al.2020)
- Remote sensing in PA( Mulla et al.2013)
- GeoStatistical Applications for PA(Oliver, Margaret A)
- UAV images for PA(Radoglou-Grammatikisa et al.2020)
- Machine Learning for PA(Chlingaryan et al. 2018)
- Big Data in PA(Wolfert et al.2017)
- GPS in PA(Neményi et al.2013)
- IoT for PA(Khanna et al.2018)
- Robot System in PA(P.Vasconez et al.2019)
The implementation of PA could be divided into monitoring and plant management. For plant monitoring/phenotyping, the considerable diversity of vegetation indicators can broadly be divided into three categories: compositional, structural, and functional indicators (Noss, 1990). Where two main approaches have been applied to monitoring vegetation condition: site-based assessments and remote sensing. (Methodology Reference) The management of plant is based on spatial and temporal scales.
There have been attempts to use a long list monitoring the plant. However, due to the complex environment and plant characteristics, specific topics need to be discussed separately.
In this list, the most popular 20 advancements of topic are selected. The link of topic directly connect to the discussion part.
Table XX. Topics of Implement of PA
| Area | factors/indicators | Topic | Methods | Reference (Review) |
| Plant Monitoring | compositional | richness | UAV, RS, site-based | |
| diversity | ||||
| vegetation classification | UAV, RS, site-based | |||
| threated species | ||||
| disease detection | ||||
| weed detection | UAV, RS, site-based | |||
| crop detection/counting | UAV, RS, site-based | |||
| structural | spatial-temporal variability | |||
| canopy cover | ||||
| plant density | ||||
| landscape context | ||||
| functional indicators | disturbance history | |||
| water stress | Gerhards et al.2019, Ihuoma et al.2016 | |||
| forest/tree health | UAV, RS, site-based | Lausch et al.2016 | ||
| nutrient cycling | ||||
| Plant Management | in-situ | fertilizer | VRT,GPS | |
| soil management | sampling | |||
| yield management | ||||
| water management | ||||
| environment management | ||||
| risk | insect weather | |||
| cost | crop selection,market,loans and insurance | |||
- DL for Crop Yield Prediction
- traditional ML for Crop Yield Prediction
- Datasets, contests
- Conceptional diagram of relationship between yield, historical yield, environment.
Table 1. ML methods for Crop Yield Prediction
| Year | Method | Keywords | Publication | (Re-)Implementation |
|---|---|---|---|---|
| 2006 | piecewise linear regression | NDVI, Iowa, Soybean, Corn | Crop yield estimation model for Iowa using remote sensing and surface parameters(Prasad et al.2006) | ML library |
| 2015 | InnerProductLayer | Agriculture,RS,ML,Feature extraction,Indexes,Data models | Estimating crop yields with deep learning and remotely sensed data(Kuwata et al.2015) | Caffe |
| 2016 | Random Forest | Wheat, RF | Random Forests for Global and Regional Crop Yield Predictions(Jeong et al.2016) | ML library |
| 2017 | CNN with Gaussian Process | Gaussian Process, DL | Deep gaussian process for crop yield prediction based on remote sensing data (You et al.2017) | Tensorflow 2+(Code) |
| 2018 | LSTM | LSTM,RNN,soybean,maize | A Scalable Machine Learning System for Pre-Season Agriculture Yield Forecast(Cunha et al.2018) | Keras(Code) |
| 2019 | LSTM with Gaussian Process | Gaussian Process | Deep Learning For Crop Yield Prediction in Africa(Kaneko et al.2019) | Tensorflow(Code) |
| 2019 | CNN-RNN | DL, CNN, Feature Selection, RNN | A CNN-RNN Framework for Crop Yield Prediction(Khaki et al.2019) | Python 3.0 Tensorflow 2+ (Code) |
| 2019 | CNN-LSTM | soybean, yield prediction, county-level, Google Earth Engine, CNN-LSTM | County-Level Soybean Yield Prediction Using Deep CNN-LSTM Model(Sun et al.2019) | Google Earth Engine |
| 2019 | CNN based on Regression | CNN, Regression | Winter Wheat Yield Estimation from Multitemporal Remote Sensing Images based on Convolutional Neural Networks (Mu et al.2019) | tensorflow 2.0, gdal(Code) |
| 2020 | Two-branch DNN | RS,crop,yield prediction,yield detrending | Winter Wheat Yield Prediction at County Level and Uncertainty Analysis in Main Wheat-Producing Regions of China with Deep Learning Approaches(wang et al.2020) | No-data |
| Others | Updating, Please make contributions |
Table 2. Datasets for Crop Yield Prediction
| Name | Description | Crop | Range |
|---|---|---|---|
| faostat(CSV) | Basic yield according to country in format of CSV | All range | World,1961-2016 |
| EarthStat | Harvested Area and Yield for 4 Crops of wheat, maize, rice, and soybean. | wheat, maize, rice, and soybean | World(1995,2000,2005) |
| GDHY | The Global Dataset of Historical Yield (GDHYv1.2+v1.3) offers annual time series data of 0.5-degree grid-cell yield estimates of major crops worldwide for the period 1981-2016. | maize, rice, wheat and soybean | World,1981-2016 |
| Others | Updating, Please make contributions |
Contest of Crop Yield Prediction
- 2020 Syngenta Crop Challenge (Syngenta, 2020) Using real-world crop data to develop models that can predict the performance of potential corn products.
- 2018 Syngenta Crop Challenge (Syngenta, 2018) In the 2018 Syngenta Crop Challenge, Syngenta released several large datasets that recorded the genotype and yield performances of 2,267 maize hybrids planted in 2,247 locations between 2008 and 2016 and asked participants to predict the yield performance in 2017.
- DL for crop detection
- traditional ML for crop detection
- Datasets, contests
- Overview of Different crops
- Difference of counting and detection
Table1.DL Methods for Crop Counting
| Year | Method | Keywords | Title | MAE | Re-Implement |
|---|---|---|---|---|---|
| 2017 | mTASSEL | Land-based,Maize tassels,CNN | TasselNet: counting maize tassels in the wild via local counts regression network(Lu et al.2017) | 6.6 | Pytorch(Code) |
| 2018 | Fast-RCNN | Land-based,Spike Count | # Detection and analysis of wheat spikes using Convolutional Neural Networks(Hasan et al.2019) | 5.4 | Caffe(Code) |
| 2019 | TasselNetv2 | Land-based,Maize tassels,CNN | TasselNetv2: in-field counting of wheat spikes with context-augmented local regression networks(Xiong et al.2019) | 5.4 | Pytorch(Code) |
| 2019 | Deep Counting | Land-based,superpixels,crop yield | DeepCount: In-Field Automatic Quantification of Wheat Spikes Using Simple Linear Iterative Clustering and Deep Convolutional Neural Networks(Sadeghi-Tehran et al., 2019) | XXX | Keras(Code) |
| 2020 | Comparison | Automatic wheat ear counting using machine learning based on RGB UAV imagery(https://onlinelibrary.wiley.com/doi/full/10.1111/tpj.14799)) | |||
| Others | Updating, Please make contributions |
Table2. ML Methods for Crop Counting
| Method | Author | Height | Accuracy | Limitation |
|---|---|---|---|---|
| RGB image texture histogram analysis | (Cointault et al., 2008) | 1-2meter | 73%~85% | Low accuracy |
| Laplacian frequency filter, median spatial filter and local peak segmentation | (Fernandez-Gallego et al., 2018) | 1meter | 90% | Failed at different stages of plant development. Due to changes in canopy color (yellowing) |
| Use Gabor filter, principal component analysis and k-means clustering | (Alharbi et al., 2018) | 2 meter | 80~90% | Different stages. Complex environment. |
| Use color, texture and histogram, kernel principal component analysis (KPCA) and dual support vector machine (TWSVM) model for multi-feature extraction | Chengquan Zhou 2018 | 5.0meter | 82% | The initial steps require minimal human intervention to generate patches from the original image for different developmental stages |
| Artificial Nerual Network | Hao Lu 2017 Pouria Sadeghi-Tehran 2019 | 2.5meter | 85%~95% | Vehicle-mounted visible camera |
| Others | Updating, Please make contributions |
Table3. Datasets for Crop Counting
| Source | Name | Size | Description |
|---|---|---|---|
| Land-based | Global Wheat Detection Kaggle | The data is images of wheat fields, with bounding boxes for each identified wheat head. Not all images include wheat heads / bounding boxes. The images were recorded in many locations around the world. | 3,000+1000 |
| Land-based | SPIKE | The SPIKE dataset contains images with manually annotated ground truth labels for training and testing convolutional neural networks for spike detection of wheat in the field. | 500+ |
| Land-based | Maize Tassels Counting Dataset | - 361 field images collected from 4 experimental fields across China: Zhengzhou, Henan Province, China, Taian, Shandong Province, China, Gucheng, Hebei Province, China, and Jalaid, Sinkiang Autonomous Region, China. | 361 |
Contest for Crop Counting
- Global Wheat Detection (kaggle, 2020) In this competition, players detect wheat heads from outdoor images of wheat plants, including wheat datasets from around the globe.
- Method, Indices, and example applications in PA
- Furthermore
Index: leaf defoliation,leaf chlorosis and other discolouration,dead branches,canopy damage
Methods: close range remote sensing, Lidar, RADAR, Multi-Sensor Approaches, Spectral Laboratory, Plant Phenomics Facilities and Ecotrons, UAV, THermal
Table x. Recent progress of tree health monitoring in PA
| Application | Platform | Keywords | Title |
|---|---|---|---|
| polar vegetation,vigorous | UAV&Satellite | SVM, Hyper-spectrum | Unmanned aircraft system advances health mapping of fragile polar vegetation(Malenovsky et al.2017) |
| urban tree, discoloration and defoliation | UAV&Lidar | random forest, Hyper-spectrum,HSI,VI | Urban Tree Health Classification Across Tree Species by Combining Airborne Laser Scanning and Imaging Spectroscopy(Chi et al.2020) |
| orchard, defoliation | In-situ&UAV&Thermal | Hyper-spectrum,HSI,VI | Early Detection and Quantification of Almond Red Leaf Blotch Using High-Resolution Hyperspectral and Thermal Imagery(Lopez et al.2016) |
| Updating | Mapping canopy defoliation by herbivorous insects at the individual tree level using bi-temporal airborne imaging spectroscopy and LiDAR measurements(paper) | ||
| Updating | Using UAV-based photogrammetry and hyperspectral imaging for mapping bark beetle damage at tree level.(paper) | ||
| Updating | Urban tree health assessment using airborne hyperspectral and LiDAR imagery(paper) | ||
| Updating | Street tree health from space? An evaluation using WorldView-3 data and the Washington D.C. Street Tree Spatial Database(paper) |
- Plant based measurement summary
- RS based measurement summary
- Conceptional diagram of relationship between stress, response, VIs
- ET model
- Integration of thermal and narrow-band hyperspectral imagery
- Community support like meeting, dataset, workflow...
Table XX. Plant based method(Ihuoma et al.2016)
| Method | Description | Adv | Disadv | Papers |
|---|---|---|---|---|
| Stomatal conductance | Indirect indicator of plant water stress by measuring the stomata opening | Good measure of plant water status. Used as benchmark for most research studies | Labour intensive and unsuitable for automation and commercial application. Not very accurate for anisohydric crops | |
| Leaf water potential | Direct measurement of leaf water content | Widely accepted reference technique | Slow, destructive, and unsuitable for isohydric crops | |
| Relative water content | Direct measurement of leaf water status | Good indicator plant water status, requiring less sophisticated equipment | Destructive and time consuming | |
| Sap flow measurement | Measures the rate of transpiration through heat pulse | Sensitive to stomatal closure and water deficits. Adapted for automated recording and control of irrigation systems | Needs calibration for each tree and is difficult to replicate. Requires complex instrumentation and expertise | |
| Stem and fruit diameter | Measures fluctuation in stem and fruit diameters in response to changes in water content | Sensitive measure of plant water stress | Not useful for the control of high-frequency irrigation systems |
In Remote sensing, the monitoring water stress is based on the relationships between primary plant stresses, the induced plant responses, and the multi-/hyperspectrum(Gerhards et al.2019, Jones et al.2010 ).
Figure XX. Relationship between stresses, response, RS
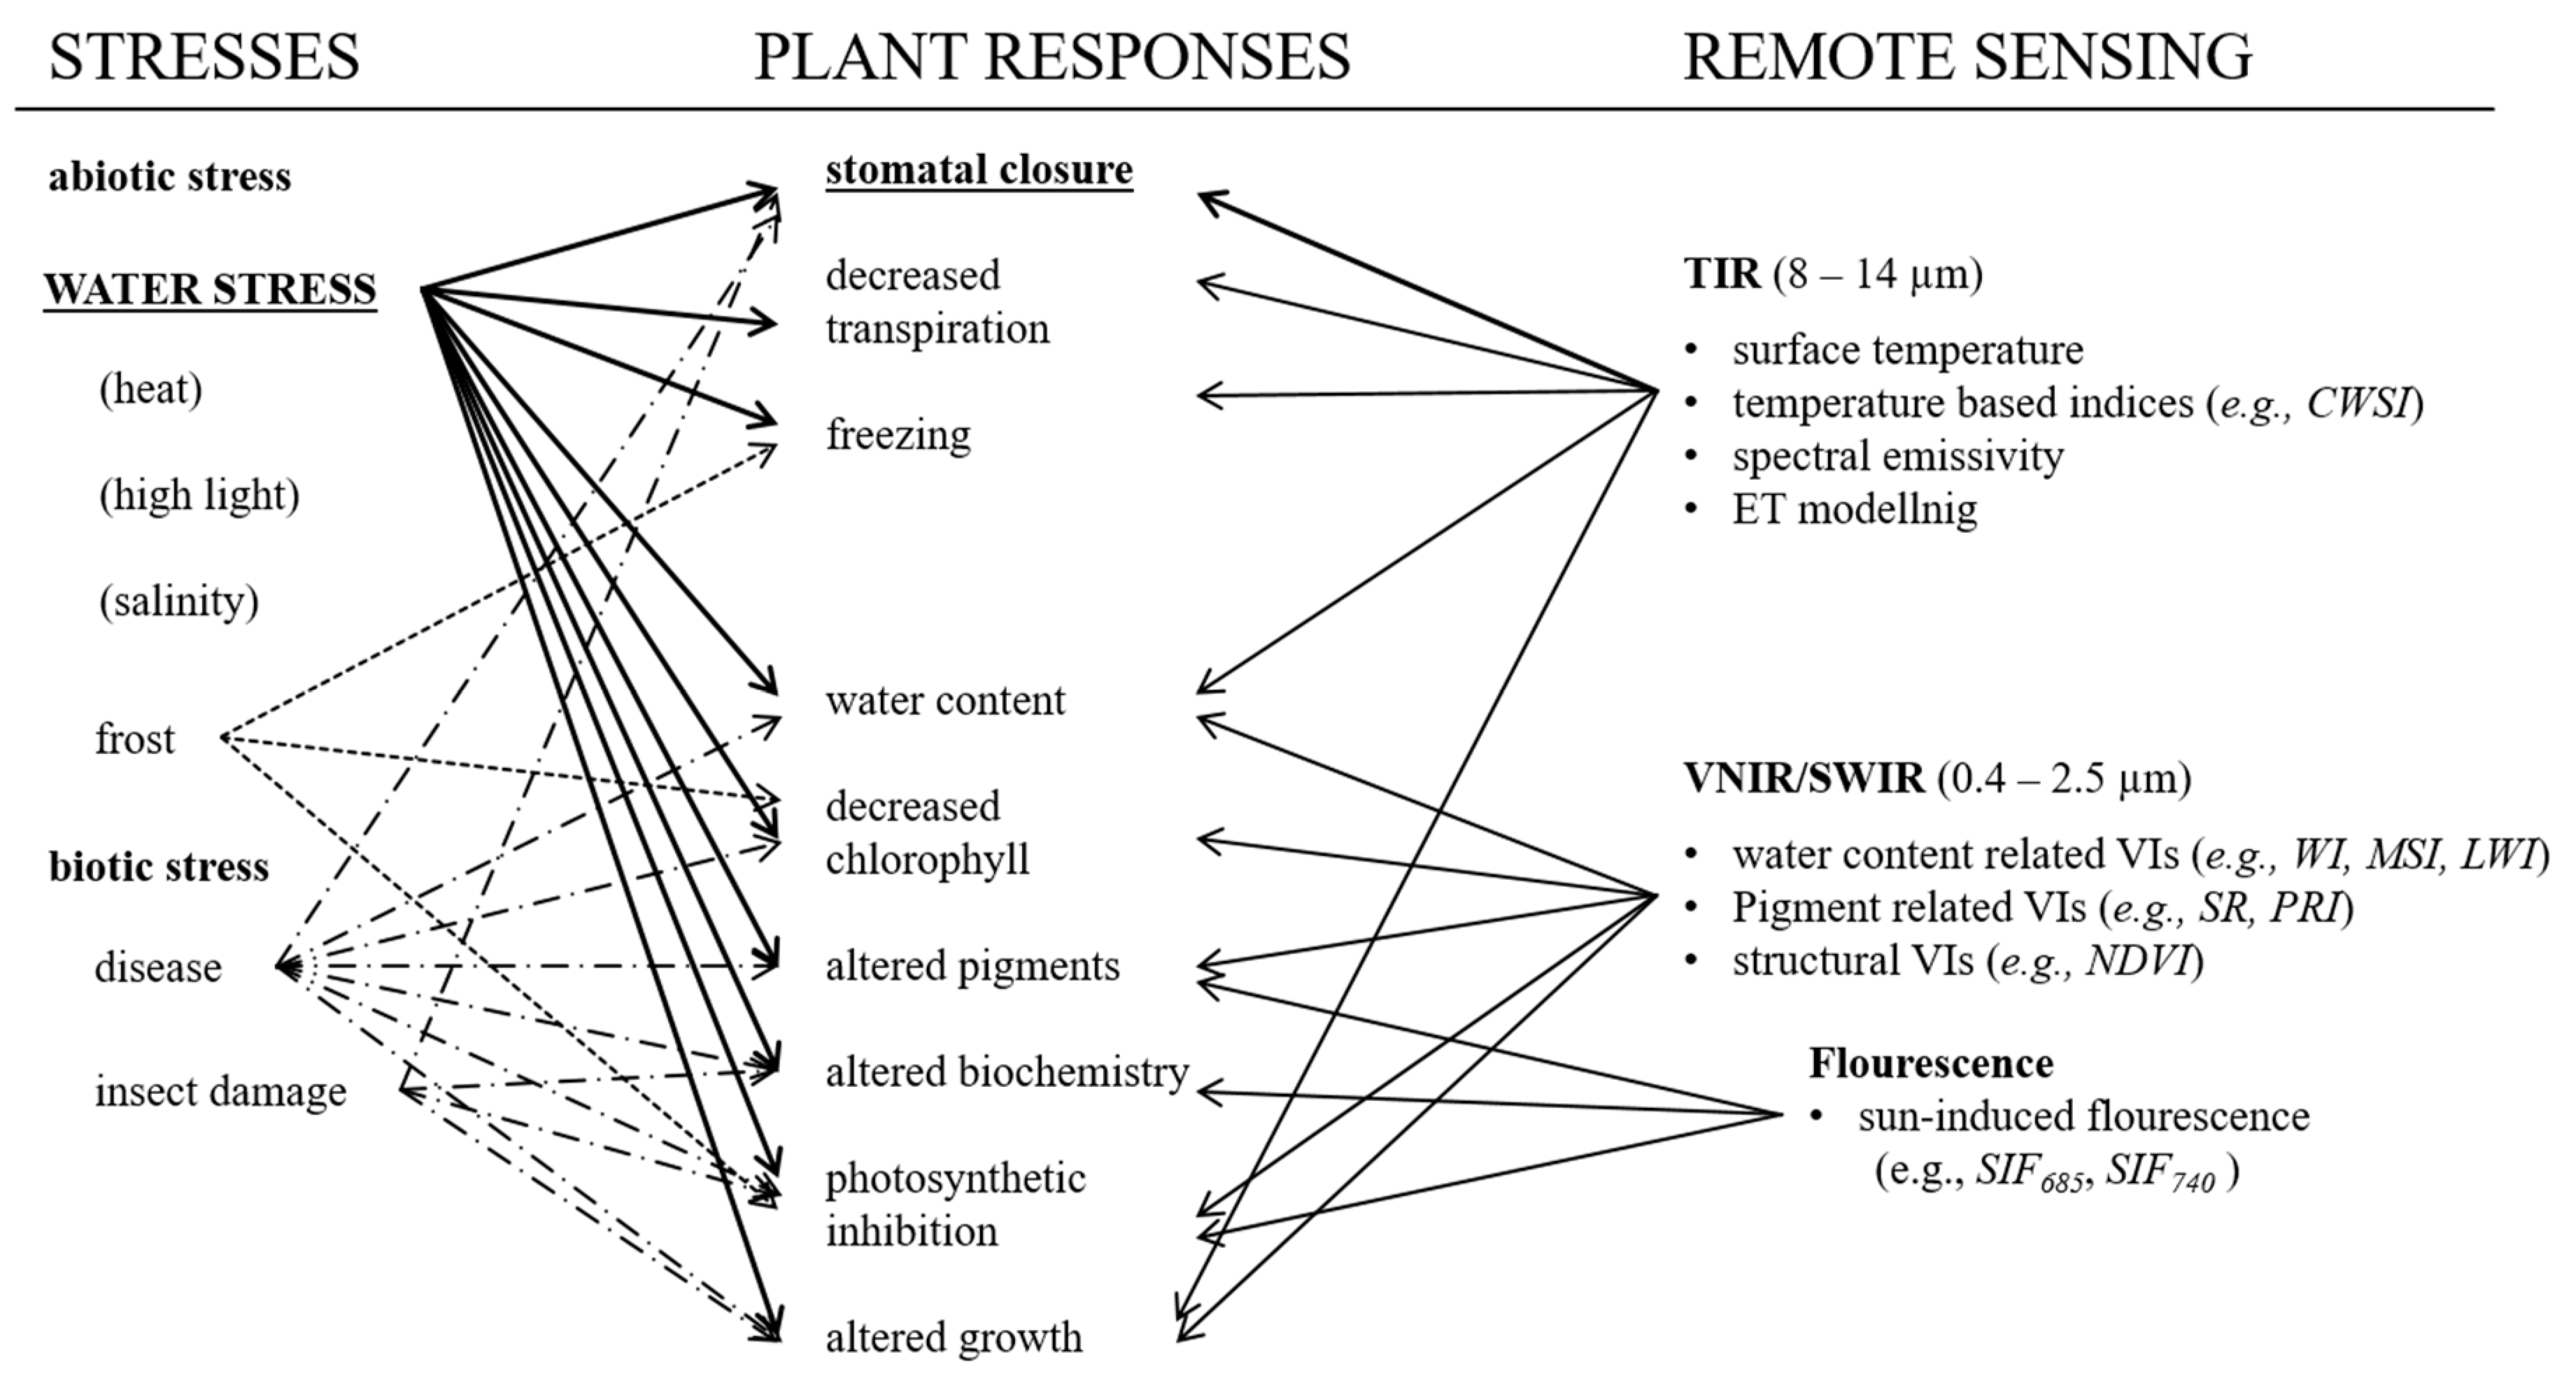
Table X. commonly applied indices and approaches for water-stress detection using the main multi-/hyperspectral remote sensing imaging techniques(Gerhards et al.2019)
| Water-Stress Index | Plant Response to Water Stress | Formula | Reference | Application |
|---|---|---|---|---|
| SDD (Stress Degree Day) | Rise in plant temperature | Tc − Tair | updating | |
| CWSI (Crop Water Stress Index) | Rise in plant temperature | CWSI = (Tc − Twet)/(Tdry − Twet) | updating | |
| WDI (Water Deficit Index) | Rise in plant temperature | Combination of NDVI (or derivate, e.g., SAVI) and Tc | updating | |
| Spectral emissivity | Alteration due to changes in the compositions of leaf constituents | Spectral emissivity (ɛ) | updating | |
| PRI (Photochemical Reflectance Index) | Changes in xanthophyll content | PRI = (R570 − R531)/(R570 + R531) | updating | |
| SR (Simple Ratio) | Decrease in chlorophyll content | SR = R800/R670 | updating | |
| NDVI (Normalized Difference Vegetation Index) | Decrease in chlorophyll content, canopy structural changes | NDVI = (R800 − R670)/(R800 + R670) | updating | |
| WI (Water Index) | Decrease in leaf water content | WI = R900/R970 | updating | |
| LWI (Leaf Water Index) | Decrease in leaf water content | LWI = R1300/R1450 | updating | |
| MSI (Moisture Stress Index) | Decrease in leaf water content | MSI = R1600/R820 | updating | |
| NDWI (Normalized Difference Water Index) | Decrease in leaf water content | NDWI = (R857 − R1241)/(R857 + R1241) | updating | |
| SIF | Changes in photosynthetic efficiency due to decreased CO2 uptake | SIF685, SIF740, or SIF685/SIF740 | updating |
A Crop/Weed Field Image Dataset - This dataset comprises field images, vegetation segmentation masks and crop/weed plant type annotations.
Table XX. Auxiliary dataset list
| Type | Name | Resolution | Description | Range |
|---|---|---|---|---|
| worldclim | WorldClim is a database of high spatial resolution global weather and climate data. | World, 1960-2018 | ||
| CRU TS v4 | CRU TS is one of the most widely used observed climate datasets and is produced by the UK’s National Centre for Atmospheric Science (NCAS) | World, 1901-2019 | ||
| SRTM | Elevation | World,1970-Present | ||
| Soil | SoilGrids | A system for digital soil mapping based on global compilation of soil profile data and environmental layers | World, Prediction | 30-90m |
| MODIS | The many data products derived from MODIS observations describe features of the land, oceans and the atmosphere that can be used for studies of processes and trends on local to global scales | World,1970-Present | ||
| Weather | Daymet | The Daymet dataset provides gridded estimates of daily weather parameters. Seven surface weather parameters are available at a daily time | North American,1980-Present | |
| Crop | CropScape and Cropland | Crop Dataset Layer | US,2008-Present | |
| Precipitation | CHIRPS | Climate Hazards Group InfraRed Precipitation with Station data (CHIRPS) is a 30+ year quasi-global rainfall dataset. | World,1980-Present | 0.05 |
| Weather | ECMWF | ECMWF produce and disseminate weather forecast data for the National Meteorological and Hydrological Services (NHMSs) of ECMWF Member and Co-operating States and their authorised users | Prediction | |
| Meteorology | National | Australia BOM |
- Remote Sensing in Precision Agriculture: An Educational Primer
- Index Database - An Index-Data-Base (IDB) could be an useful tool to find indices for a required application, adapted to a selected sensor.
- Awesome GIS - Awesome GIS is a collection of geospatial related sources, including cartographic tools, geoanalysis tools, developer tools, data, conference & communities, news, massive open online course, some amazing map sites, and more.
- Awesome Agriculture
- Open Plant Pathology - Open Plant Pathology is an supports and promotes the spread of all open, transparent and reproducible practices in the field of plant pathology.
- Farm Hack - Worldwide community of farmers that build and modify our own tools.
- ROS Agriculture Community - Open Source community focusing on using Robot Operating System to empower farmers with robotics tools.
- OpenFarm - A free and open database for farming and gardening knowledge. You can grow anything
- Harvest_helper - Provides growing, harvesting and recipe information for the 45 plants in the database as well as a json api so that people can hopefully use this data to build other apps.
There are currently a large number of software with PA tools, and we have a brief summary of them
| Name | Description | Applications |
|---|---|---|
| ERDAS | ||
| ArcGIS | ||
| ENVI |
Library
| Name | Description | Language |
|---|---|---|
| PlantCV | PlantCV is composed of modular functions in order to be applicable to a variety of plant types and imaging systems. | Python |
| pyprecag | A suite of tools for Precision Agriculture data analysis | Python |
| Crop Monitoring | Machine Set of Machine Learning Algorithms developed with the aim of determining health states of different types of crops | Python |
| Open Plant Pathology | A community that values open data and computational tools for advancing epidemiology and pathogen population biology and ecology | Mix |
Software
| Name | Description | Platform |
|---|---|---|
| GeoFIS | GeoFIS is a free and open source software platform for high spatial resolution data processing with a decision support perspective. | Win, Linux,Docker |
| Sen2Agri-System | Sentinel-2 for Agriculture (Sen2Agri) is a software system processing high resolution satellite images for agricultural purposes funded by ESA (European Space Agency). Please register on the Sen2Agri webpage for Sen2Agri system updates and information. | Service |
Precision Farming - It employs the use of IOT to monitor, store and analyse soil conditions in a green house to enhance crop production. The microcontroller used is the raspberry pi. Plant Phenotyping - A modular software architecture for Automatic Plant Phenotyping Deep Learning for Biologists with Keras - Tutorials for deep learning based analysis (mainly) on biological relavent themes.
This list will be updated in time, and volunteer contributions are welcome. For questions or sharing, please feel free to contact us or make contributions.