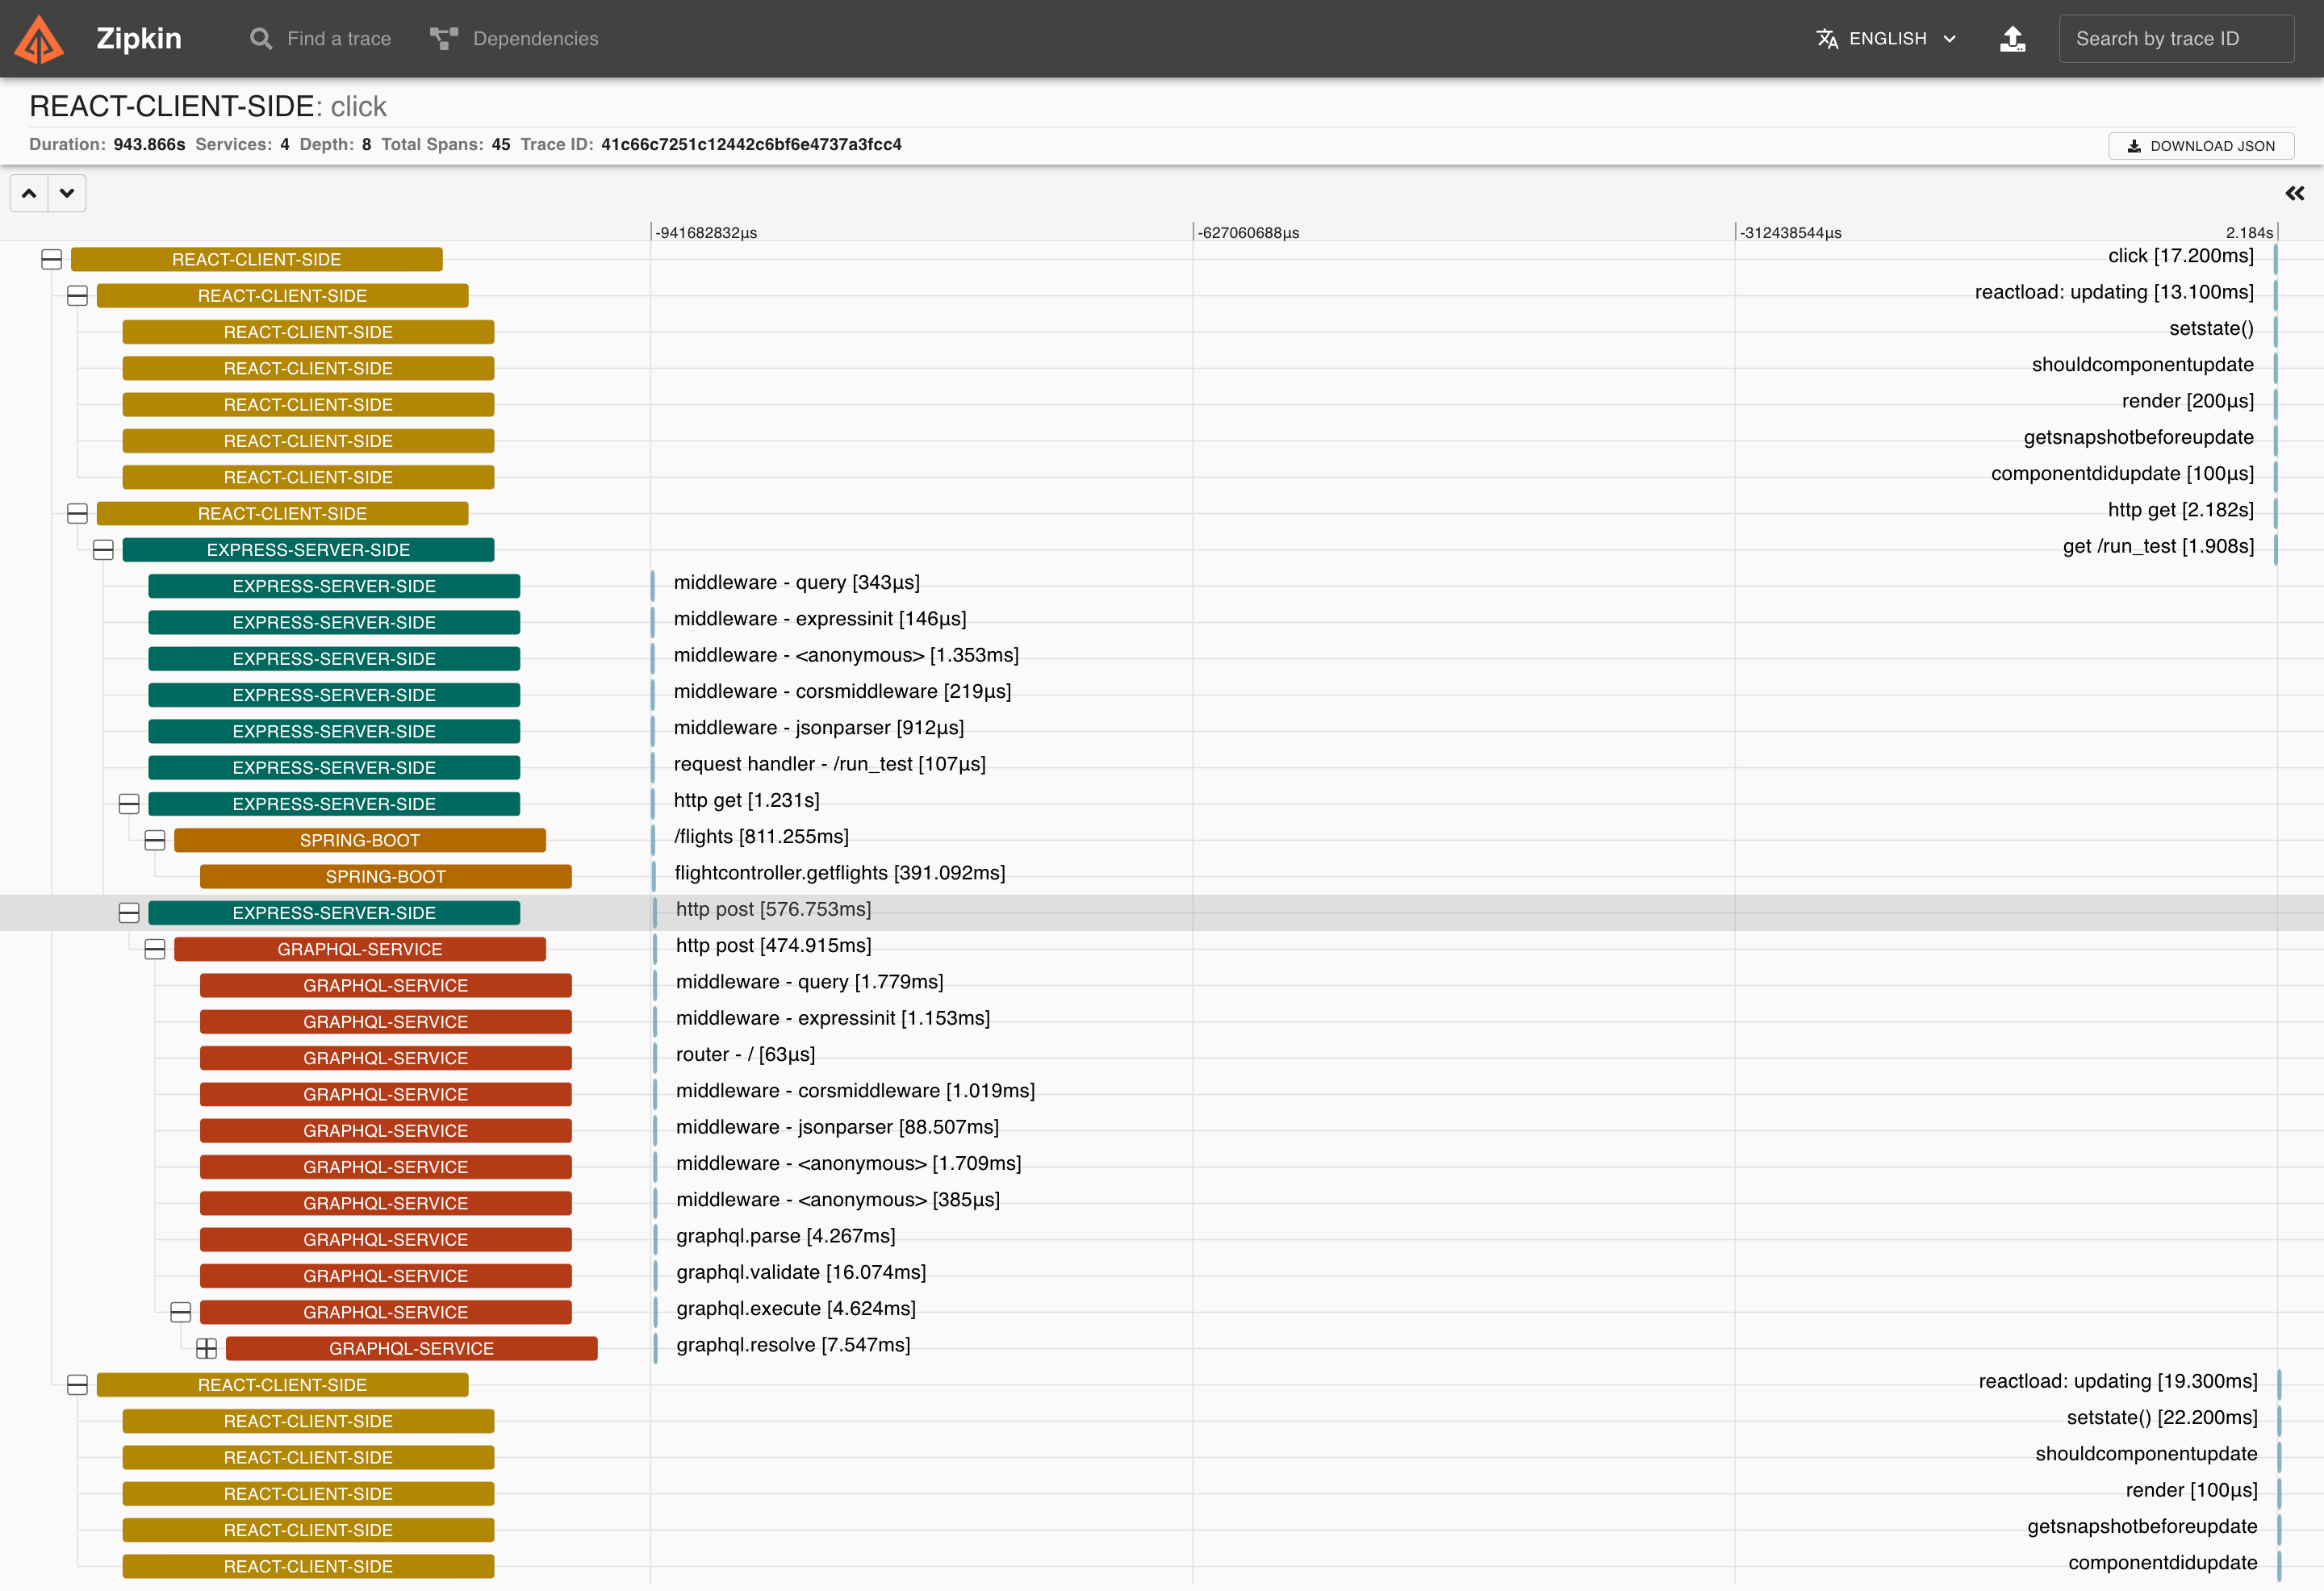
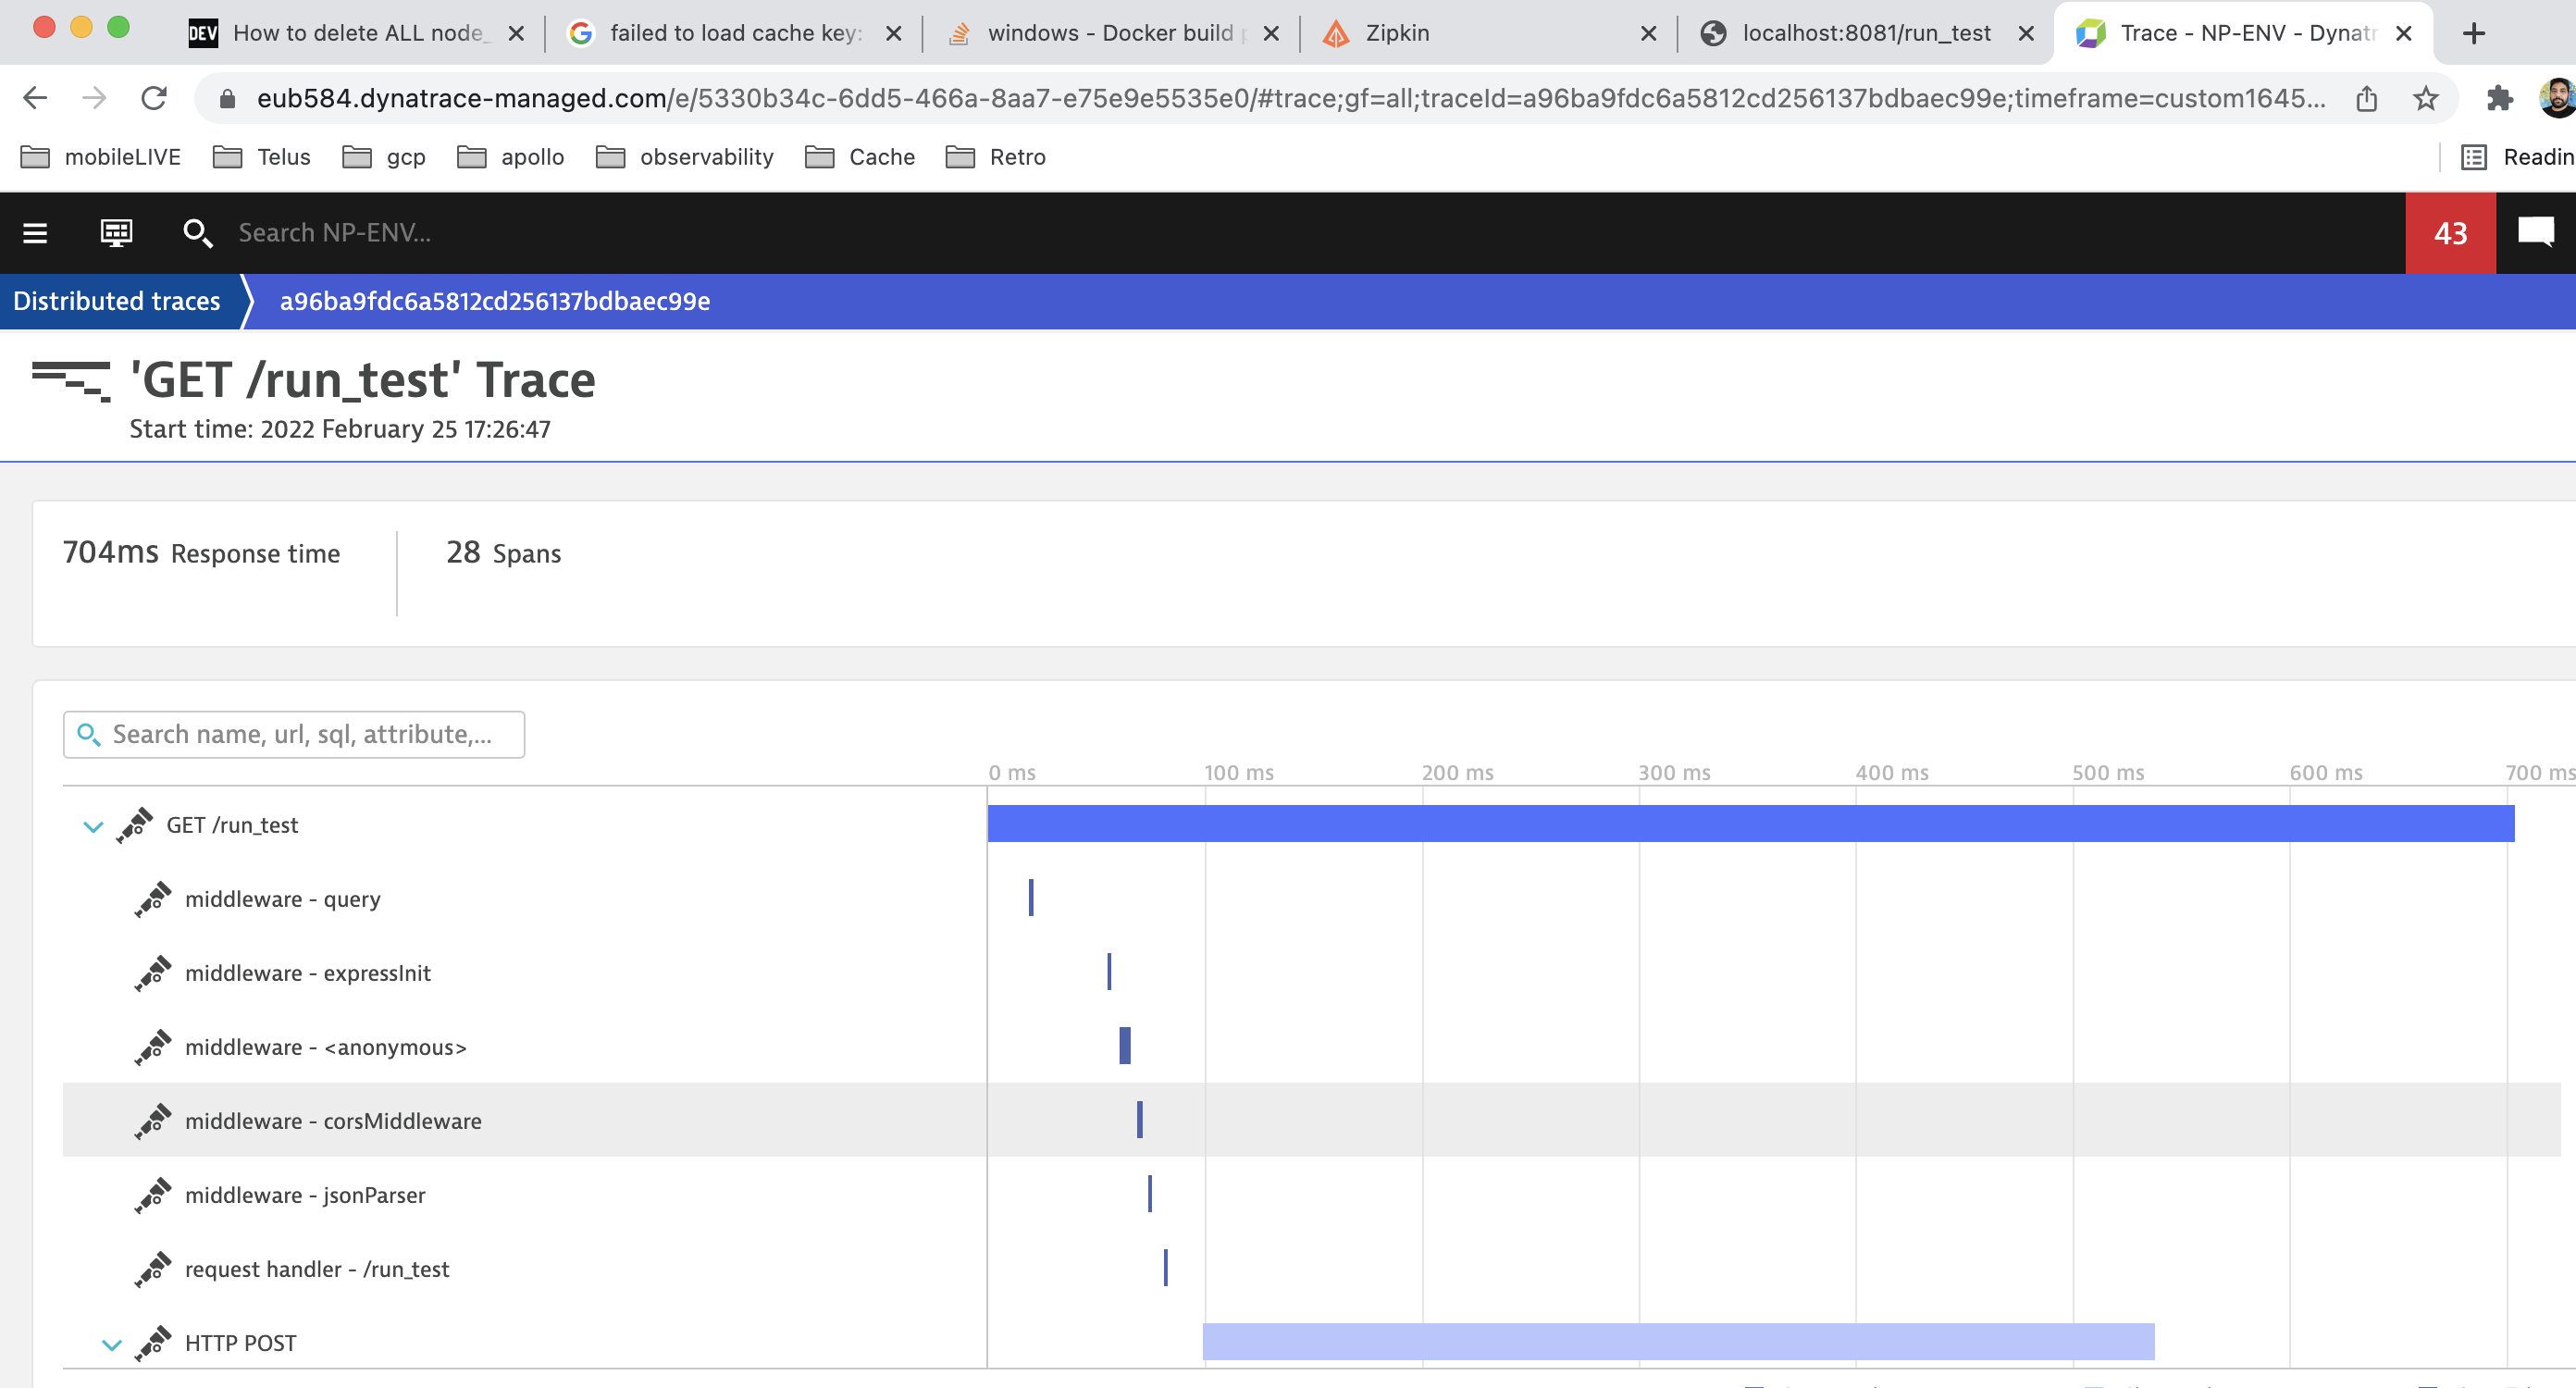
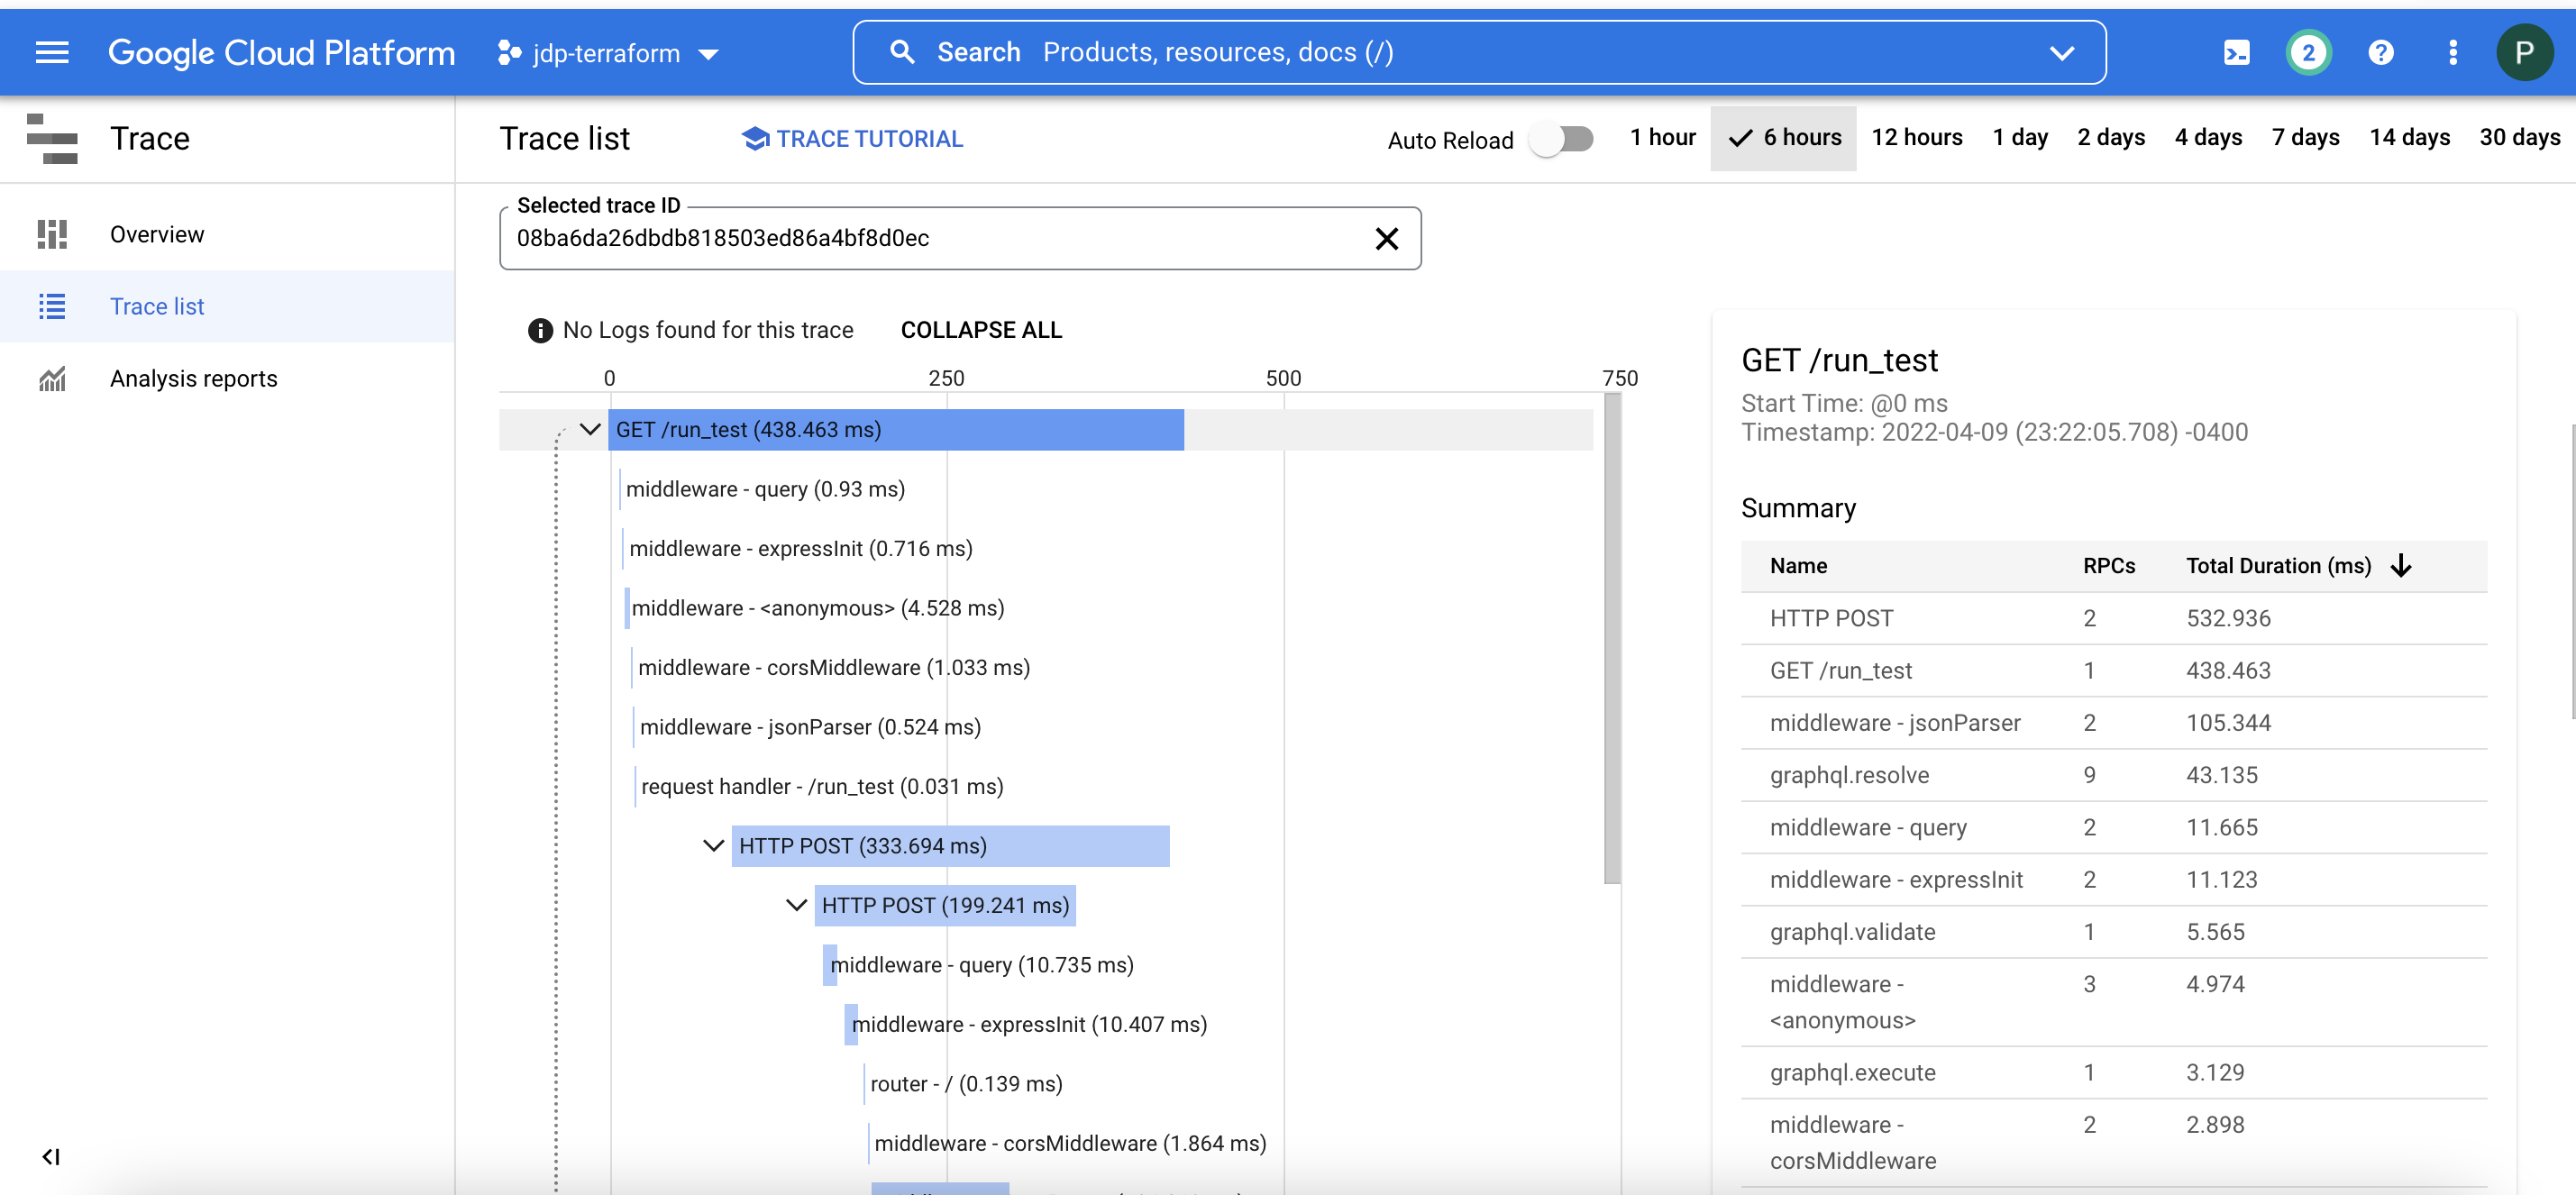
OpenTelemetry Instrumentation allows the user to automatically collect Traces/Spans data and export them to the backend of choice (Zipkin and/or Dynatrace in this example), to provide Observability on distributed systems.
This sample application demonstrates OpenTelemetry Tracing between React --> Express --> Spring Boot --> GraphQL applications, which shows key aspects of tracing such as
- Root Span (on Client)
- Child Span (on Client)
- Span Events
- Span Attributes
Each Trace/Span information will be collected & expored to Ziplin & Dynatrace APM tools via OpenTelemetry Collecter & Exporter libraries.
Even though Distributed Tracing is one of the Out-of-Box (OOB) feature from few APM tools (like Dynatrace), we need to consider Optl because
- Standard solution API : Prior to OpenTelemetry, the process of capturing and transmitting application telemetry data was fragmented with a range of disparate open and vendor-provided solutions.
- Vendor agnostic: Traditional approaches to telemetry data collection required teams to manually instrument code, which locked users into specific tools. As a result, the cost of switching was high. So, if a customer adopted a solution that worked for monolithic apps but not cloud apps, moving to a more modern offering was challenging.
- Pre-instrumented code : Application tracing is critical to help users identify application issues and areas for improvement. Manually instrumenting code to export trace data can be challenging because it can require extensive testing cycles and code validation. With SaaS software, manual instrumentation may not even be possible.
- Tracing can be enabled for Front End frameworks like React, Nextjs etc., via Optl, which provides more visibility not only distributed tracing but also to findout Largest Contentful Paint (LCP), First Contentful Paint (FCP), First Meaningful Paint (FMP) etc.,
In a nutshell, It standardizes the way telemetry data is collected and transmitted to any backend platforms of choice
This REPO helps to standarize the solution across various Telus Digial (TD) frameworks on
- Adaption Strategy How to inject these configurations into various platforms like WASK, React, NextJS, api-starter-kits, express, graphql, SpringBoot etc.,
- Provider configuraitons: Need to determine what kind of traces are these: server-side vs website. Based on this Intrumention approach would change
- Auto vs Manual: To determine to go with Auto Instrumentions or manual to avoid Performance hit. Based on the framework of choice need to register providers to instrument accordingly
- Simple vs batch spans: Need to determine the span processors.. simple vs batch mode
- Filter requests: If you want to filter some of the requests. for example health check endpoints etc.,
- Really need to instrument FE applications also, as they are origin for Traces. This REPO explains how to create/enable spans approved Telus Digital frameworks like ReactJS, NextJS etc.,
- Privacy requirements: if you want to mask any sensitive details.. create span attributes, only those will be tracked
Interested? Follow Architecture to know more...
- To export the Distributed Traces to Dynatrace, Please connect to Telus VPN and have the
API_Tokenupdated under/config/.env.dev. Floow this guide to create the token accordingly. - For GCP Trace, have the
Service Accountkeys handy & keep that under root of the project askeys.json, so that it will be mounted during the Server start. Follow this guide to enable Traces for a given GCP project.
Follow below instrcutions to spin-up the application
-
Clone the REPO
-
Build the Application
# from this directory $ docker-compose --env-file ./config/.env.dev build -
Start the Application
# from this directory docker-compose --env-file ./config/.env.dev up -
Stop the Application
# from this directory
docker-compose --env-file ./config/.env.dev down
After Application starts, load the React application using below URL and navigate through button clicks
# from browser, tigger below URL
http://localhost:3000/
Optionally, you can trigger Express & GraphQL endpoints using below URLs to trace those applications individually
# from browser, tigger express endpoint
http://localhost:8081/run_test

# from browser, trigger graphql endpoint
http://localhost:4000/
Once these endpoints are triggered, Trace information will be availabe in Zipkin & Dynatrace accordingly
Refer bleow Monitioring Tools on how a Distributed Tracing can be viewed for the given request between different distributed systems.
React application should output the traceid in the terminal (e.g traceid: 4815c3d576d930189725f1f1d1bdfcc6).
Go to Zipkin with your browser http://localhost:9411/zipkin/traces/(your-trace-id) (e.g http://localhost:9411/zipkin/traces/4815c3d576d930189725f1f1d1bdfcc6)
To access the trace details, follow below steps
Note: You should connect to VPN to upload the Trace Details to Dynatrace. Otherwise, you will not be able to find them in Dynatrace APM tool
- Login to Dynatrace with SSO
- In left navigation menu, Navigate to
Applications & MicroServcies-->Distributed Tracessection - In
Filter Requests:Search with above traceid againstW3C trace IDin filter criteria - You can see the sample tracing as below
There are couple of approaches to enable Distributed Tracing in Dynatrace APM Tool
Without OneAgent + OpenTelemetry - Currently, we export the traces using CollectorTraceExporter as this example runs Without OneAgent configurations.
With OneAgent + OpenTelemetry (Recommended) - Follow below steps to enable Distributed Traceing via OneAgent + OpenTelemetry
- For APIs, Enable OpenTelemetry in Dynatrace by navigating to this path Settings --> Server-side service monitoring --> Deep monitoring --> Expand New OneAgent features --> Find and enable OpenTelemetry (Node.js) here.
- For Front-end frameworks, enable the Real User Monitoring to capture XHR actions (optional)
- We can use Auto Instrumentation to capature the traces and spans. Manual Instrumenentation is also possible, if customized data needs to be exported
- Send data via OneAgent
Refer these docs for more details. Recommendation is to go with OpenTelemetry + OneAgent Configurations
In any case, from Dev Standpoint the implemenation pattern is same in both approaches except comment out the CollectorTraceExporter reference code.
Distributed Tracing can be done in mulitple ways. Refer more details here
- Auto Instrumentation for Node.js, Web applications
- Manual tracing
Only point to consider between Auto vs Manual instrumention is, there will be little bit of performance overhead, if we go with Auto Instrumention, which is developer friendly.
Traces can be exported in couple of ways to GCP
- via OpenTelemetry - The implementation you see in this PoC
- via Cloud Trace Library - You can find reference here
Refer these docs to get more details about the GCP Traces.
This section talks about various Adaption Strategies based on the framework used in Telus Digital. Follow Adaption to know more...
- Enterprise agreement on the PoC
- Onboard these components with the help of Platform teams into various StaterKits
- Do a PoC, how the traces/spans (headers) information is carry forward between multiple Infra components like F5, Load balancer, CDN, Ingress proxy etc.,
- Need to dig more for client side apps for various frameworks like NextJS, React etc.,
- Current limitations for React are a) GCP trace work only for Server-Side rendering b) Need to enable React framework in Dynatrace. Also, need help for Dynatrace team
- Need to drive the similar approach from OneAgent Perspective
- For more information on OpenTelemetry, visit: https://opentelemetry.io/
- For more information on OpenTelemetry for Node.js, visit: https://github.com/open-telemetry/opentelemetry-js/tree/main/packages/opentelemetry-node
- GCP Trace: https://cloud.google.com/trace/docs/setup/nodejs-ot
- Dynatrace: https://www.dynatrace.com/support/help/extend-dynatrace/opentelemetry/opentelemetry-traces/opentelemetry-ingest/opent-nodejs#tabgroup--send-data-to-dynatrace--without-oneagent
- Nextjs + Opentelemetry: https://github.com/prisma/pdp-spike-nextjs-opentelemetry/


