This is an implementation of Prometheus Exporter for Prusa printers running Buddy boards (Prusa MK4, XL, and Mini), Einsy boards (Prusa MK3(S(+)) with Prusa Link installed) or resin printers (SL1). Multi-target is supported out of the box so you can check any number of printers as long it has accessible Prusa Link API and you have enough computing power.
For MK3S with Einsy board you need to use at least version 0.7.0 of Prusa Link or higher, because there are many more metrics to scrape than in the older versions. You can find the most up to date version in the Prusa Link repository.
- Prusa Exporter - formerly Buddy Link Prometheus Exporter
Prusa exporter runs on port 10009, but you can choose different port in prusa.yml. Metrics are accessible at /metrics endpoint.
This list contains current and future features along with completion status:
- Scrape of metrics from Prusa Link
- Use of Grafana Cloud
- CI pipeline with Docker Hub publish
- Local instance of Grafana / Prometheus / Loki
- Raspberry Pi Image
- Support for connection to Einsy with username and password
- Support for MK3 - it was implemented before but I want overhaul it and make it work
- Dashboard update
- Configuration update
- Send logs to Grafana Cloud
- Enable node_exporter for Grafana Cloud
- Optimize and get more syslog metrics
- Automatically send syslog config gcode to buddy boards
- exporter toolkit implemenation
- Create endpoint for configuration update
- Unit tests
- Create systemd service for exporter and install script
- Properly provision on premise setup
- CI for binaries release
- Enable log collection to Loki
- SL1 support
- [ ]
- README.md update
First things first. You need to clone the repo and that which is very easy, right?
git clone https://github.com/pstrobl96/prusa_exporter.git
I've created docker-compose.yaml file, that can be used for deploy of exporter. You would need Docker and docker-compose plugin installed. Right now it is possible to use docker compose up only with Linux because I do not build image for Linux.
Wait. This is exporter for Prometheus right? Right? Well yes but the way how printers works with metrics is... let's say interesting? Because both metrics and logs are sent via syslog I took a chance to get logs from printer as well and forward them to Promtail or Loki push endpoint. Why I even bothered you ask? Becuase Promtail was unable to accept log data from printer, it worked only for metrics (somehow?). So I just modified my code to catch data a forward them to Loki.
Metrics that you can find in this exporter are "scraped" from two sources. First is Prusa Link, it is pretty usual REST API that returns all data in JSON. There is a lot of useful metrics but there are few that are missing. Like data from most of sensors and for example current or voltage. However this is not appliable to Einsy printers like MK3, these supports only Prusa Link API.
For Buddy - SYSLOG exists. Syslog is standard for logging for a quite while however printer used it for sending metrics. Trough UDP. So what I just did is that I created experimental Syslog UDP server within this exporter and I'm catching these "metrics". Be aware that these metrics can be send only via wired ethernet. You are out of luck over the air.
The issue is that if you have more printers you'll create a lot of traffic in the network. Printer could send about 10-100 kB per second^needs more testing^. If you have more printers this number multiplies. I choose flag this feature experimental because you cannot be sure you'll get the metrics, it's UDP and printers are sending data as much as they can but it is not consistent. Between printers there are differences - obvisouly.
Example how metrics looks can be found in file. This file also includes Einsy and Buddy syslog metrics.
Another issue with SYSLOG is configuration. You need munually enable sending metrics in printers GUI - step by step bellow. And you need to run specific gcode file, that specifies SYSLOG server.
With M330 and M334 g-code you can configure your SYSLOG server and there are two ways how to get needed g-code. I've created containing everything needed. You just need to change IP address and you can change port. however while testing I had issues with numerous text editors and printer was very picky. I was successful with
nano and basic echo command in terminal.
Second way is to add these two lines in to start of g-code with PrusaSlicer. Don't forget to change IP address and port! 10008 is default that I used but use whatever you want but you need also change that value in configuration.
M330 SYSLOG
M334 192.168.20.2 10008
For logs you can use M340.
M340 192.168.20.2 10007
Or you can combine both and you'll get
M330 SYSLOG
M334 192.168.20.2 10008
M340 192.168.20.2 10007
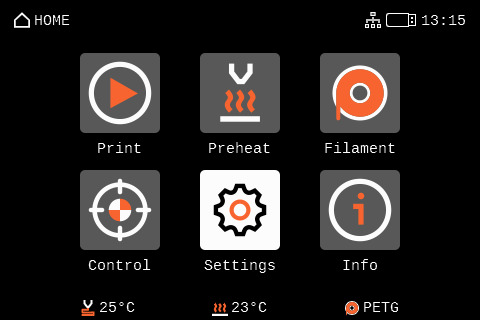
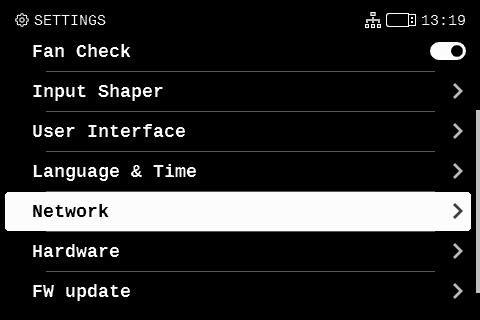
After loading gcode on to flash drive you can enable the metrics in printer.
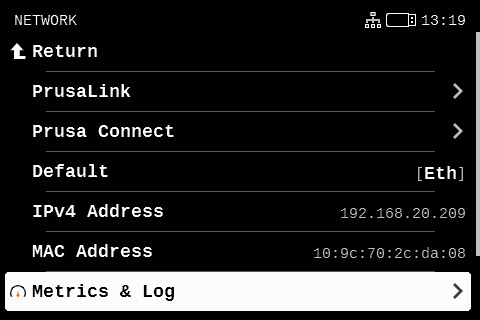
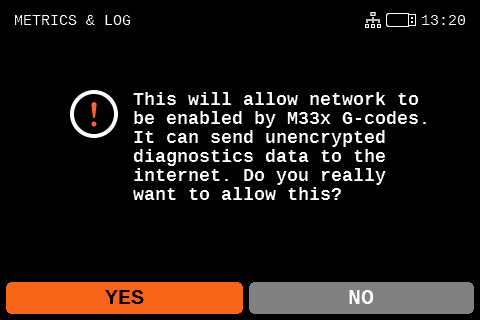
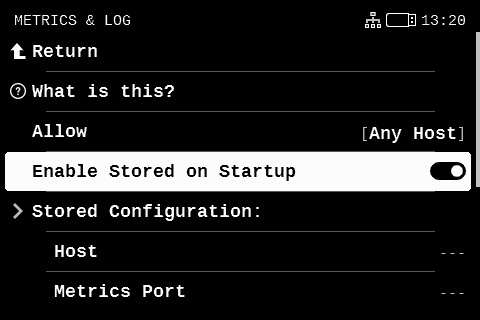
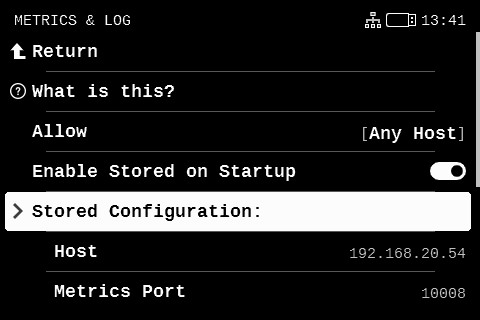
Now click on Allow - Confirm and change value to Any Host. Next switch on Enabled Stored at Startup
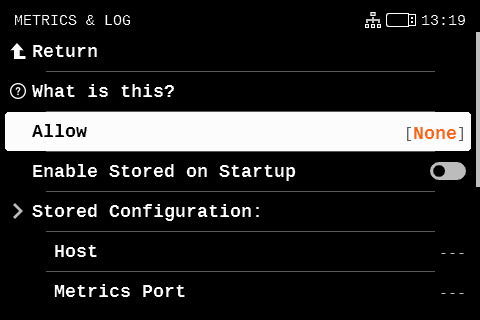
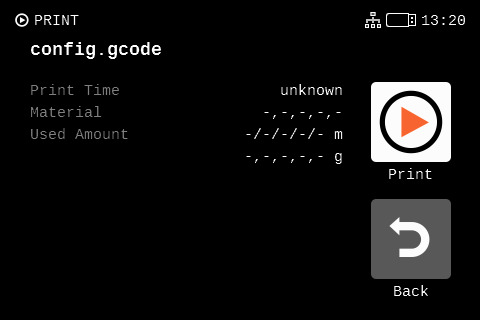
Now run your configuration gcode we created before
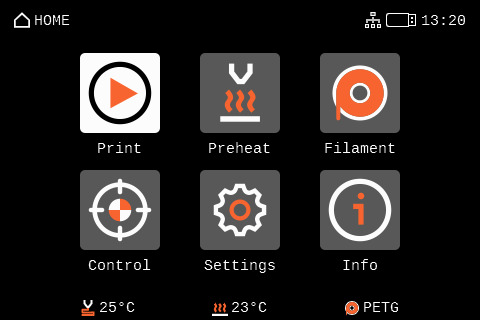
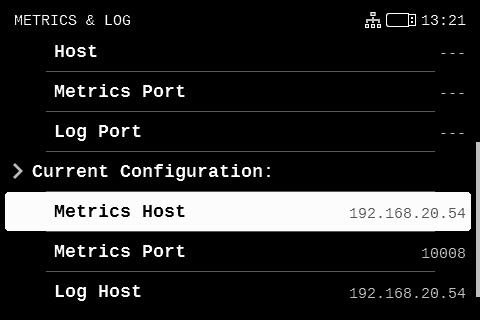
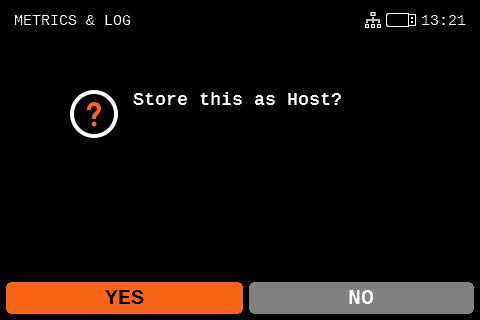
Navigate back to Metrics & Log and find Current Configuration - click on Metrics Host and store it as Host
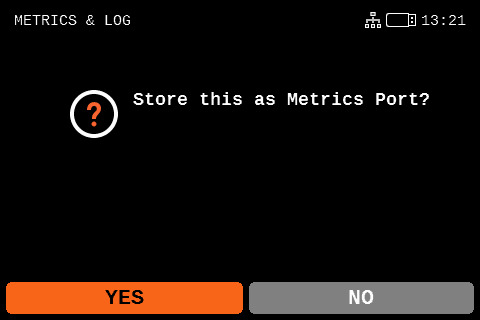
Click on Metrics Port and store it as Metrics Port
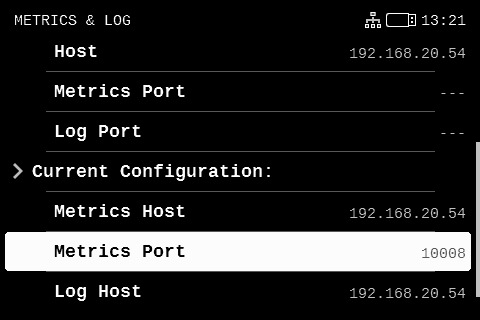
After configuration it should look like this. Only IP address should be different. And if different port was choosen then also port.
I also created Raspberry Pi image that can be flashed to memory card. If you choose this path you'll need following.
- Raspberry Pi (4 and 5 tested) with 64 bit support
- At least Class 10 and at least 16 gigs Memory card
Of course all other accessories like computer, card reader, power supply etc. are mandatory.
Download image from releases page or alternatively you can choose CI pipeline run and download particular artifact. Downloaded img.xz file is named prusa_exporter_{version}.img.xz and needs to be flashed to the memory card.
Download and install Raspberry Pi Imager. You can alternatively use different tool but rpi-imager is easiest in terms of settings.
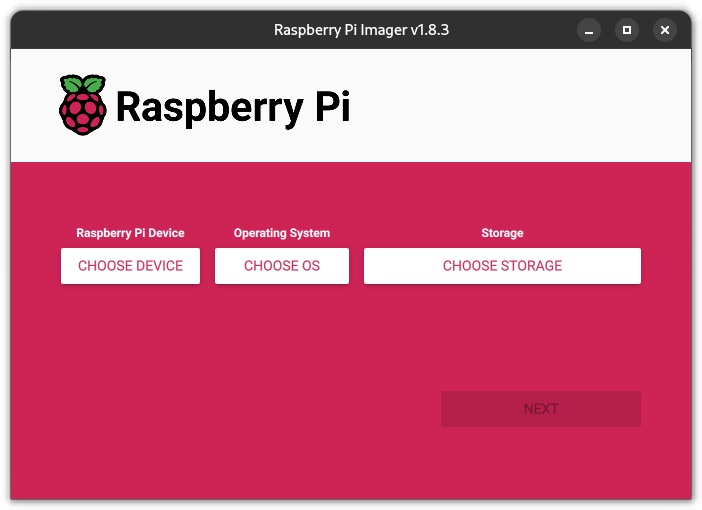
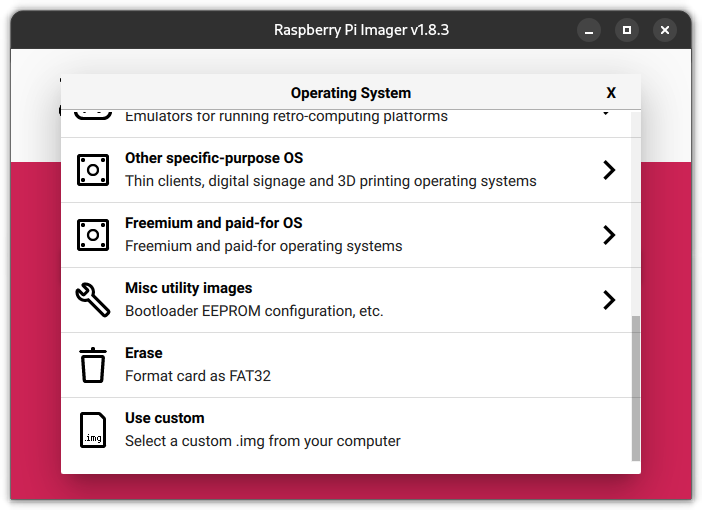
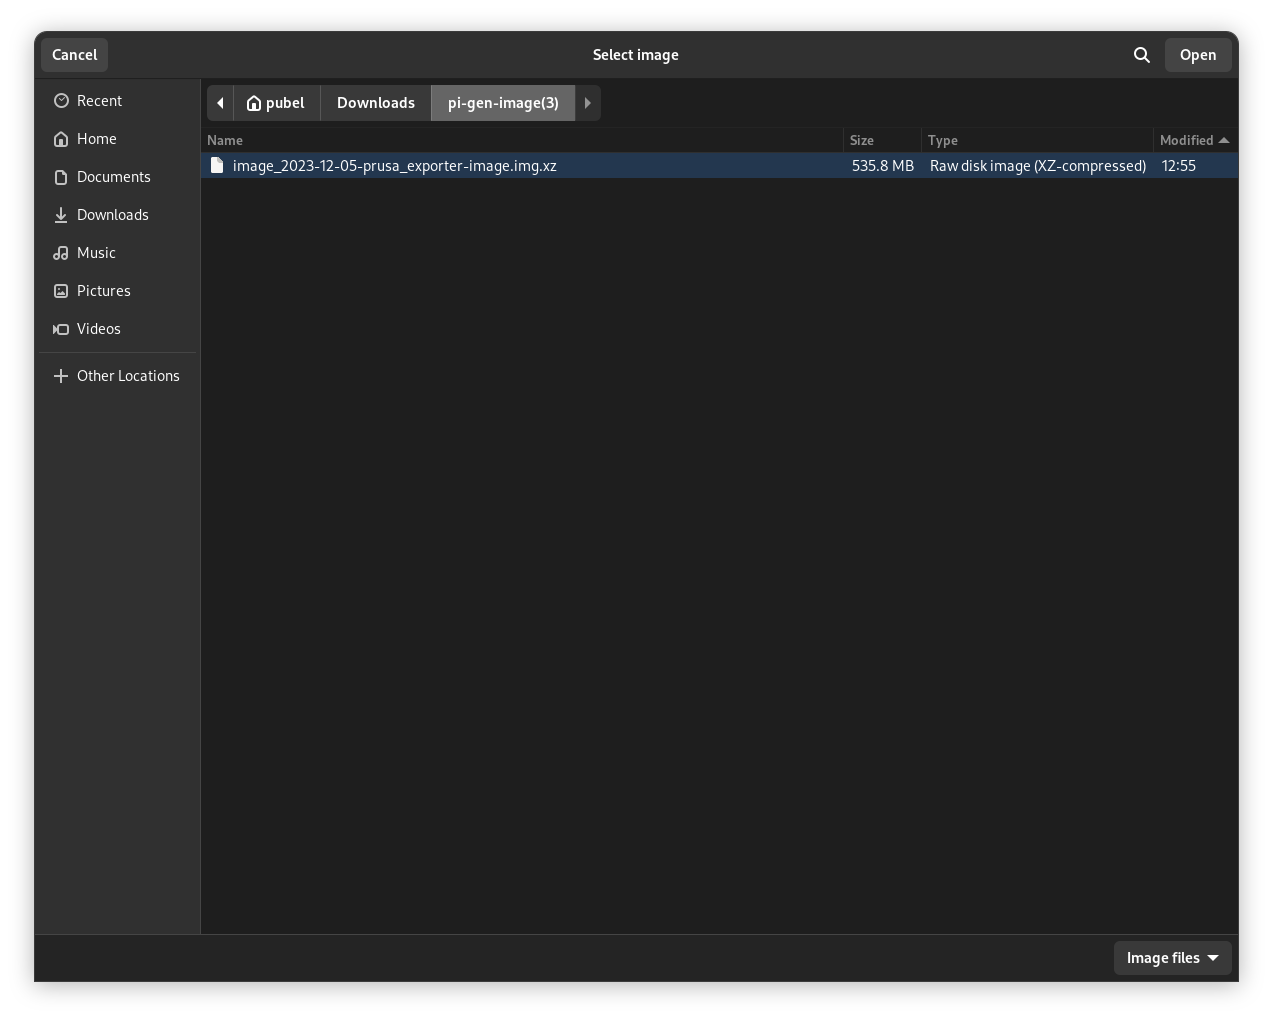
After installing open the Raspberry Pi Imager. Don't click Choose Device instead of that click on Choose OS. Scroll down, you'll find Use Custom. Select downloaded image.
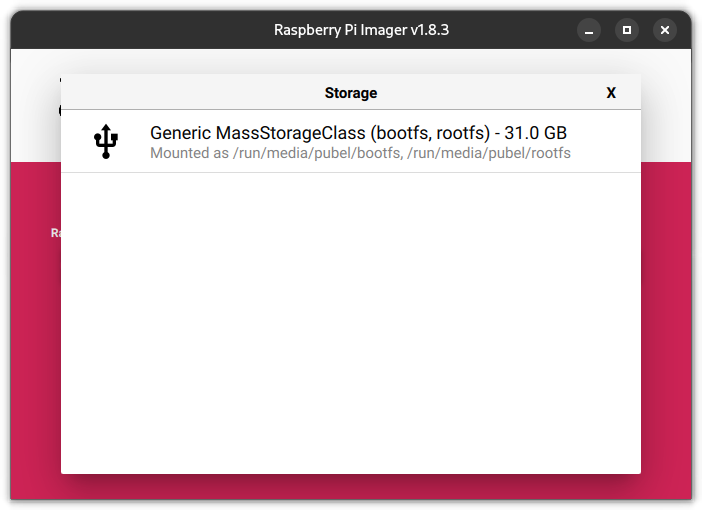
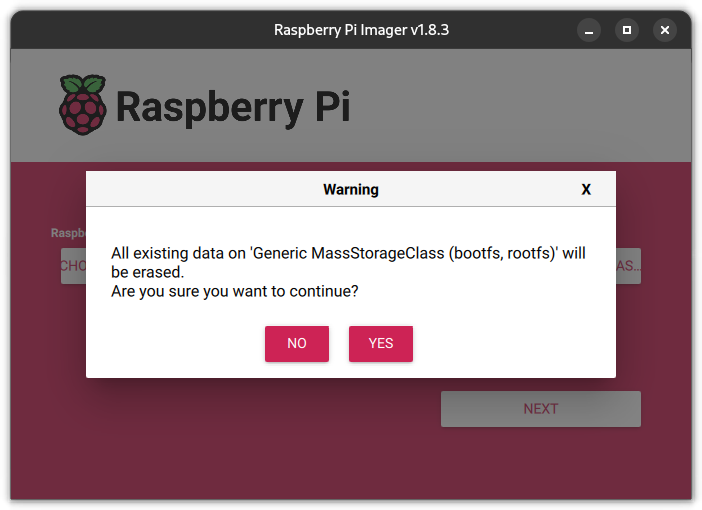
Now connect memory card to your computer and click Choose Storage. BEWARE - you can mistakenly choose wrong storage media and flashing process includes formating your drive. Now select your Raspberry Pi memory card. Now click Next.
Now it depends if you want to connect via LAN or WiFi.
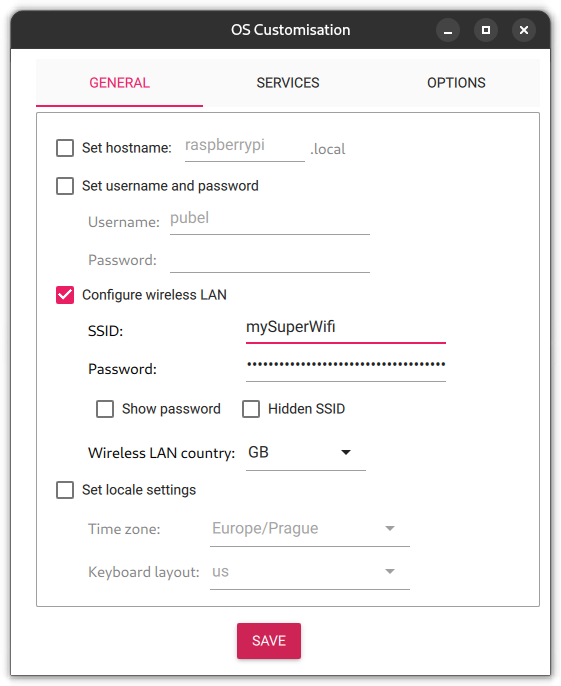
If you want to use wireless ethernet, then click at Edit Settings. Click at Configure wireless LAN and write your WiFi name (SSID) and password. Don't forget to select correct Wireless LAN country. Next be sure that Eject media when finished is unchecked . Click Save and after that click on Yes. If you are sure that all content of your memory card would be erased, click Yes.
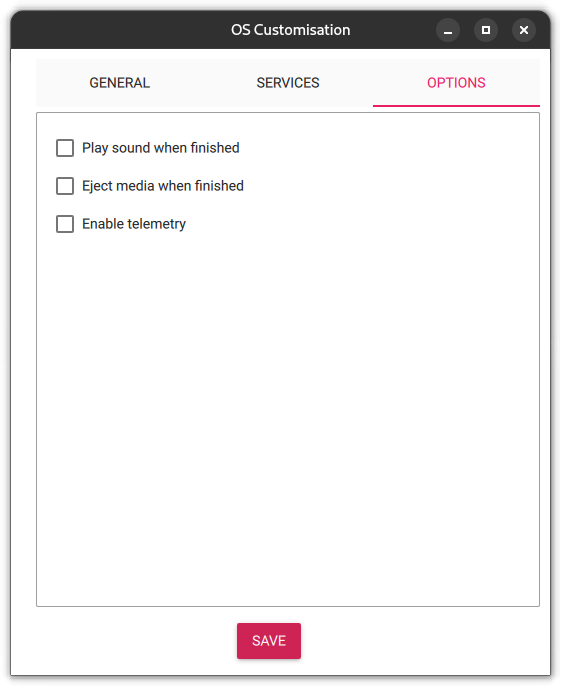
If you want to use wired ethernet, then click at Edit Settings, click Options and be sure that Eject media when finished is unchecked . Click Save and after that click on Yes. If you are sure that all content of your memory card would be erased, click Yes.
Now wait for the Raspberry Pi Imager to complete the flash process.
Now we need to configure Grafana Agent and prusa_exporter. After flashing you should see new partition connected to system, can be called boot or bootfs. In Windows you'll get also letter of partition, nowadays most probably D: - can varies. If you don't see new partition. Eject memory card from the system and reconnect it.
In boot partition you'll find two files agent.yaml and prusa.yml. Configuration is mentioned in next part of README.
Please take a look at the sample configuration examples for prusa exporter, Prometheus, and Promtail. You will need to change few things to get it up and running. Of course you can change everything you want. If you are using Grafana Cloud, you can find your API key at grafana.com -> My Account -> Grafana Cloud instance -> Send Metrics / Send Logs.
I also prepared a configuration for on-premise Prometheus and Loki if you do not want to use Cloud solution and you want to have your data somewhere local. You can find these on-premise configs in the on_premise subfolder.
Prusa exporter loads prusa.yml from an command flag --config.file=<path>. This flag can be empty and if so exporter will just try to load prusa.yml file located in the executable folder. Prusa exporter has implemented a config reloader that runs by default every 300 seconds (5 minutes).
You will find two sections in the config file, exporter and printers.
exporter is used for configuration of exporter itself:
exporter:
  metrics_port: 10009 # exporter port
  scrape_timeout: 1 # scrape timeout of Prusa Link
  reload_interval: 300 # interval in seconds for config reloader
  log_level: info
  syslog:
    metrics:
      enabled: true
      listen_udp: 0.0.0.0:10008
    logs:
      enabled: true
      listen_udp: 0.0.0.0:10007
      loki_endpoint: http://agent:3500
metrics_port: you can set whatever you want. It is the port where Prometheus would scrape metrics endpoint. Required
scrape_timeout: Value in seconds that implies timeout of scraping Prusa Link devices. Not necessary needed for Einsy but needed for Buddy becuase printer sometimes do not return values. Required
reload_inteval: Because feature of config reloading is implemeneted, you need to specify interval of reloading. Required
log_level: log level of logger, default is info. Optional
syslog: EXPERIMENTAL
syslog.metrics.enabled: EXPERIMENTAL activates or deactivates printer syslog metrics handling. Optional
syslog.metrics.listen_udp: EXPERIMENTAL address where should syslog metrics server run. Optional
syslog.logs.enabled: EXPERIMENTAL activates or deactivates printer logs handling. Optional
syslog.logs.listen_udp: EXPERIMENTAL address where should syslog log server run. Optional
syslog.logs.loki_endpoint: EXPERIMENTAL address where should printer logs be sent. Optional
printers is used for configuring your target printers. Please note that type is informational and optional; if you define it it will be part of your metric labelset.
Note: Currently, you can not log into Einsy (Raspberry Pi Zero) boards with username and password. You need to generate an API key in Prusa Link settings. This will be resolved in a future release.
printers:
  buddy:
  - address: <address_of_printer>
    username: maker
    pass: <password>
    name: <your_printer_name>
  - address: <address_of_printer>
    username: maker
    pass: <password>
    name: <your_printer_name>
  einsy:
  - address: <address_of_printer>
    apikey: <apikey>
    name: <your_printer_name>
  sl:
  - address: <address_of_printer>
    username: maker
    pass: <password>
    name: <your_printer_name>
Grafana Agent is used in Raspberry Pi image and currently works only with Grafana Cloud - if you don't configure it different way. You need to change url, username and password. You can get these values in configuration of your Grafana Cloud. How you can find in Grafana Cloud documentation.
metrics:
  global:
    scrape_interval: 15s
    remote_write:
    - url: <YOUR CLOUD METRICS URL>
      basic_auth:https://grafana.com/grafana/dashboards/20393-buddy-detail/
        username: "<YOUR CLOUD METRICS USERNAME>"
        password: "<YOUR CLOUD METRICS PASSWORD>"
In prometheus.yml you need to change the remote_write section. This section is responsible for writing data to Grafana Cloud instance. You can get all values in config of your Grafana instance. You can get more information in Grafana Docs.
| key | value |
|---|---|
| url | this is where your instance is running |
| username | name that is used for login |
| password | unique key used for login |
remote_write:
- url: https://prometheus-prod-01-eu-west-0.grafana.net/api/prom/push
  basic_auth:
    username: userName
    password: apiKey
In promtail.yml you need to change the clients section. Thanks to this block promtail will send logs to your Grafana Cloud Loki instance instead of local Loki. More details of log ingestion in Grafana docs.
| key | value |
|---|---|
| url | this is string that you can generate in Grafana Cloud |
clients:
  - url: https://<User Name>:<Your Grafana.com API Key>@logs-prod-eu-west-0.grafana.net/loki/api/v1/push
Starting of exporter is simple. Just change directory to where docker-compose.yaml and configs are and run following command.
docker compose up
🎉 if everthing went alright your instance is up and running and you can find metrics at /metrics endpoint.
I also prepared one dashboard per board which you can find in the docs/examples/grafana folder.
Download this dashboard straight from Grafana.net! Just use ID 20393 when importing.
Download this dashboard straight from Grafana.net! Just use ID 20446 when importing.
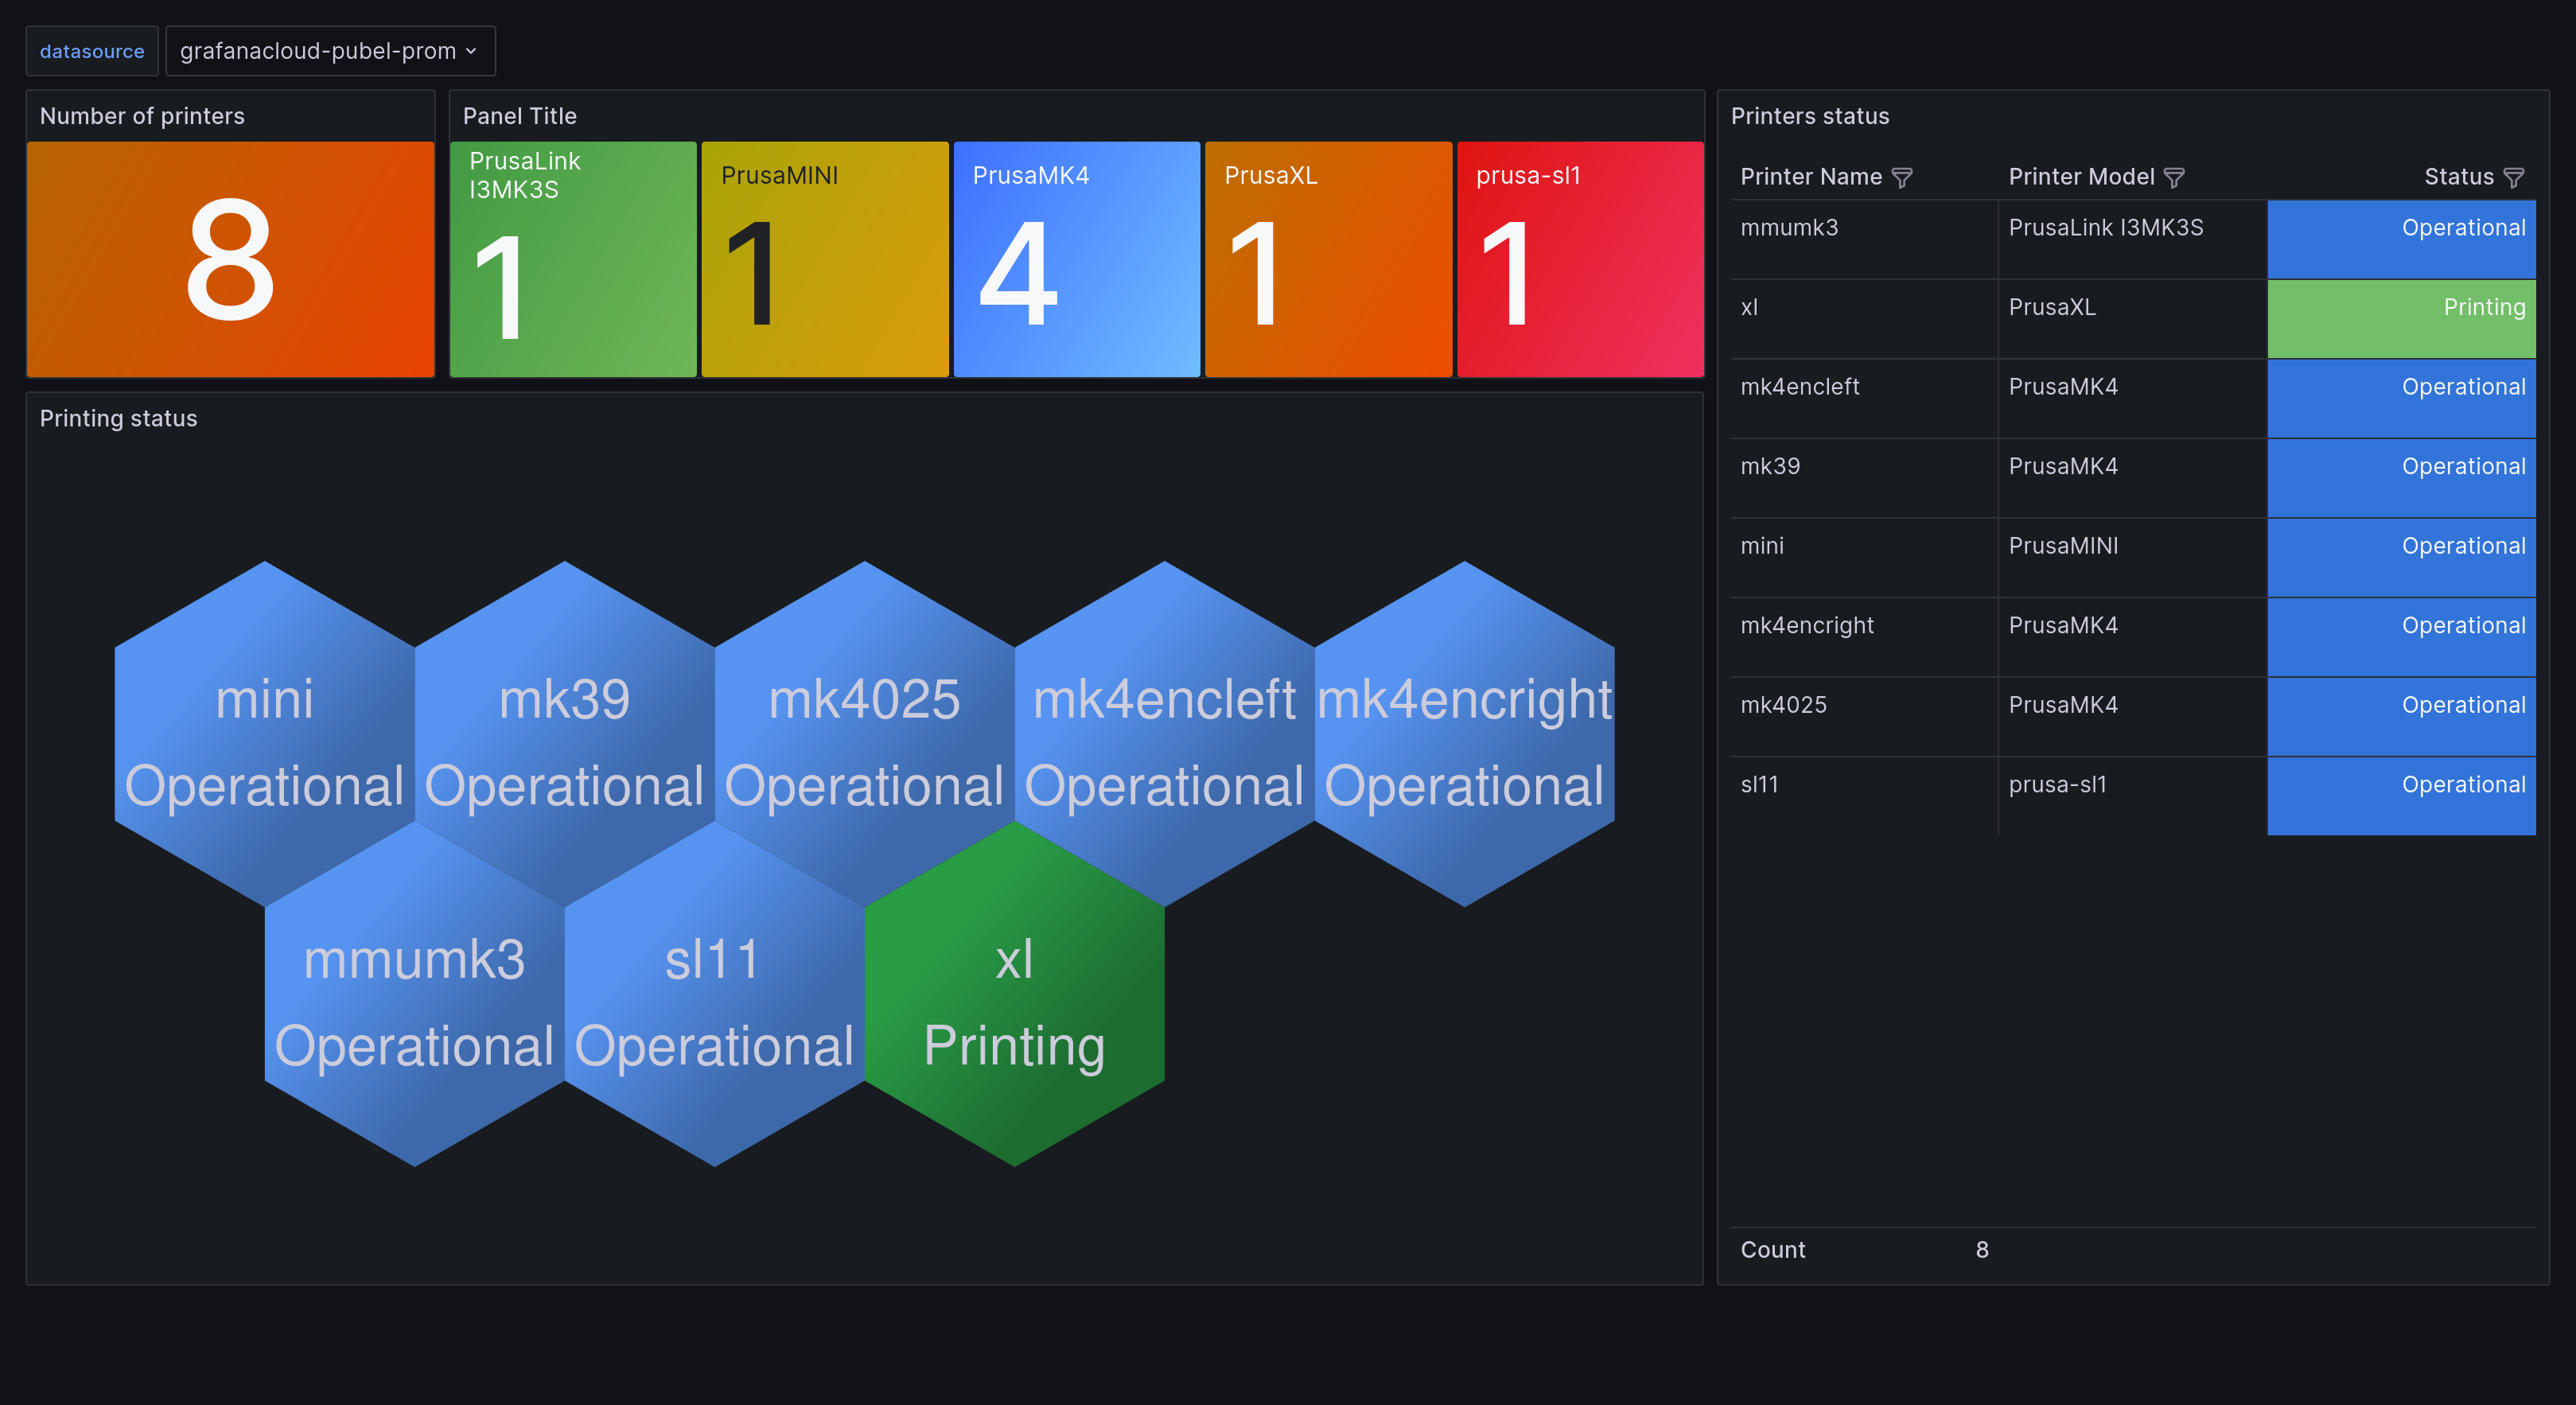
This dashboard is used for monitoring all of your printers. Basically - green means printing, blue means ready, yellow means warning and red is error. You need polystat panel for this dashboard.
Download this dashboard straight from Grafana.net! Just use ID 20449 when importing.
This dashboard is experimental same as support of resin printers
Download this dashboard straight from Grafana.net! Just use ID 20474 when importing.


