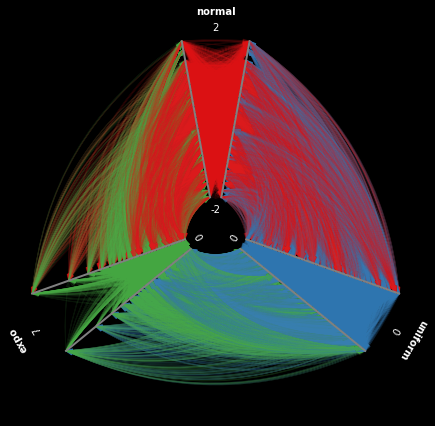
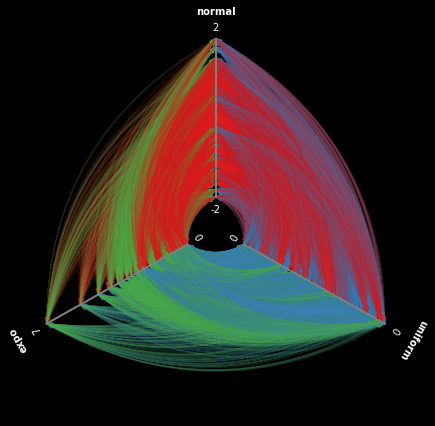
Single-class python library for creation of hiveplot data visualizations of network data. Starting from a pandas DataFrame containing the node adjacency table and one with node metadata the class creates the links visualization using bezier curves.
The hiveplot visualization places each node on one of three axis according to class partitioning (only 3-class network partitioning is supported in order to avoid link overlap), with ranking on the axes determined by a scalar quantity. Each edge is represented as a bezier curve with color-coding dependent on the source node. If intra-class edges are possible the axes can be split, resulting in two demi-axis for each class containing the same nodes.