A pivot table with intermediate and final results both by rows and by columns is already in Python.
Pivot tables are an undeniably cool thing for analyzing (summarizing, aggregating) multi-category data. Those who are familiar with them do not need to be convinced of this. Those who do not know, will be happy to receive a "Swiss army knife", which can come in handy in many situations.
Pivot tables are implemented in many environments, platforms, and libraries.
The implementation of pivot tables in Excel can be attributed to the "gold standard". It has a convenient interactive interface, including filters. A very important feature is the presence, in addition to aggregation, of intermediate and final summaries both by rows and by columns.
Everything seems to be fine. So, this is where I could end my story. But there is always a need for more. In this case, we need automation of the building the pivot table, without manual work, directly in the program code. And here we turn to the implementation of pivot tables in Python.
Perhaps the most widely known method in Python is pivot_table from the package Pandas. But there is one "but" - this method aggregates without creating intermediate and final summaries both by rows and columns.
For example, let's demonstrate this statement on the open test data set sampledatafoodsales . I will not describe this dataset, it's quite simple - let's go straight to the example. In Python terms, building this example pivot table would look like this:
''' Standard Pivot '''
pt0 = pd.pivot_table(df,
                     values='TotalPrice',
                     index=['Category', 'Product'],
                     columns=['Region', 'City'],
                     aggfunc=np.nansum)
In principle, the example is self-evident - we build the distribution of sales TotalPrice of products Product grouped by categories Category in cities City grouped by regions Region.
And now let's compare what the result looks like in Python and in Excel.
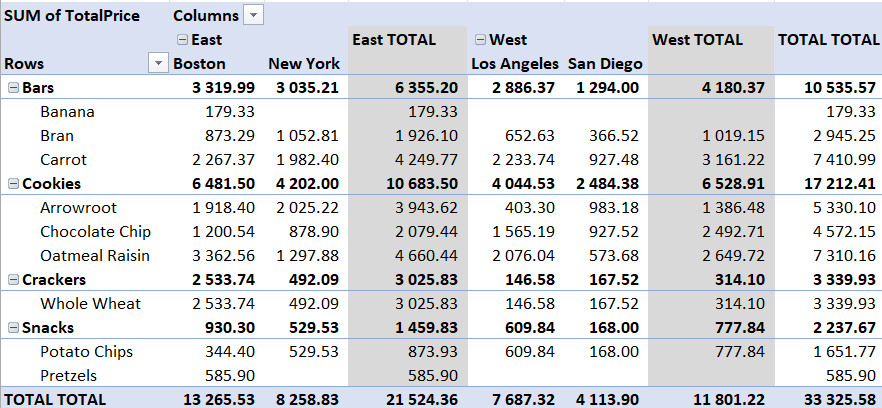
Figure 1. Excel pivot table.
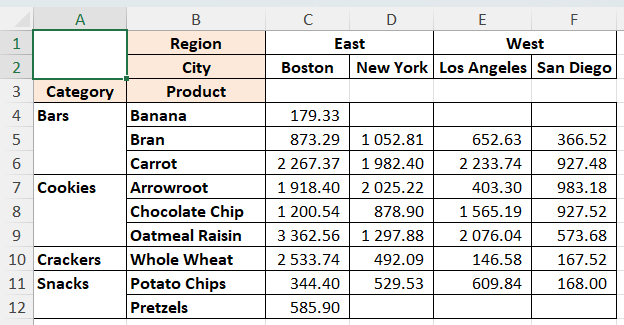
Figure 2. Standard Pandas Python pivot table. The result is imported into and displayed in Excel.
We see a numerically identical result, except that the pivot table in Excel additionally contains intermediate and total sums by regions Region (columns) and by categories Category (rows).
We will deal with the actual solution of this issue in Python below.
Found quick solutions like pivottablejs and mito didn't give the desired result.
Will Keefe's solution, described in the article " Tabulating Subtotals Dynamically in Python Pandas Pivot Tables ", turned out to be much closer to the desired result.
But this solution has its limitations. A pivot table built using the Will Keefe's method creates subtotals and grand totals by row only. Let's see how our example of a pivot table will look with this method (the name of the function here is somewhat shortened compared to the original):
''' Will Keefe's Pivot '''
pt1 = pivot_w_subtot(df=df,
                     values='TotalPrice',
                     indices=['Category', 'Product'],
                     columns=['Region', 'City'],
                     aggfunc=np.nansum,
                     margins=True)
The actual pivot table will look like this:
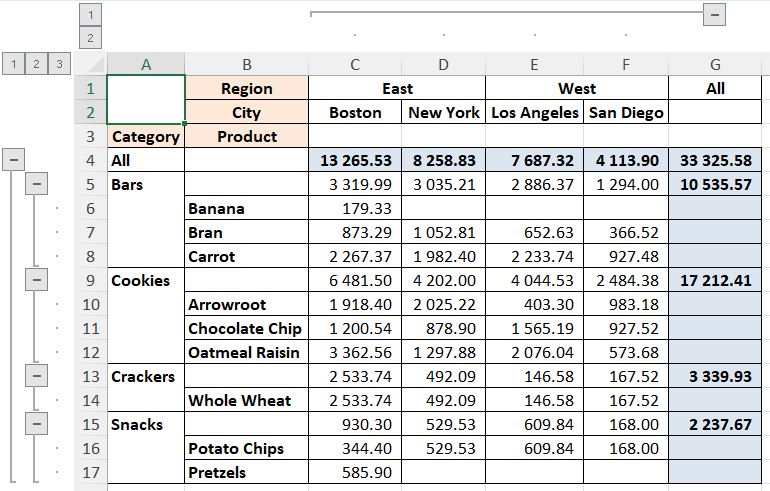
Figure 3. Python pivot table by Will Keefe. The result is imported into and displayed in Excel.
As you can see, the generalization by lines comes up as it should - there is aggregation by individual categories Bars, Cookies, Crackers, Snacks and also by all categories All.
At the same time, there are no summaries for individual regions (columns) East and West, and there are also no total summaries in the rows of specific products.
Let's try to develop Will Keefe's method pivot_w_subtot, adding to it the ability to build summaries by columns by categories of higher levels.
To do this, we call pivot_w_subtot with an argument value of margins=False. In this case, only the column All and row All will disappear in the resulting pivot table. Everything else remains in place.
Then to obtain total summaries vertically and horizontally only at the top level, we create two new temporary columns in the input dataframe df_long:
df_long = df.copy()

df_long['All_cols'] = np.nan # For the summary by columns at uppermost level
df_long['All_rows'] = np.nan # For the summary by rows at uppermost level
First, we create a vertical summary, that is, for all rows, including the total summary of the top level of the input table df_long, thanks to the inclusion of the column All_colsand the corresponding index:
df_wide = pivot_w_subtot(df=df_long, values=values,
                         indices=['All_rows',] + indices,
                         columns=['All_cols',] + columns,
                         aggfunc=np.nansum,
                         fill_value=np.nan)
Then we stretch the "wide" table df_wide again into a "long" one df_long, but this time it contains the summaries of all levels of the vertical hierarchy:
df_long = pd.melt(df_wide,
                  value_name='value',
                  ignore_index=False).reset_index()
Now we create a summary from a long table df_long horizontally (that is, on all columns), but placing them vertically. This is achieved by assigning all the columns to the argument indices and, conversely, all the rows to the argument columns. And, at the end, we transpose (.T) the resulting table, that is, we change the rows (axis=0) and columns (axis=1):
df_wide = pivot_w_subtot(df=df_long,
                         values='value',
                         columns=['All_rows',] + indices,
                         indices=['All_cols',] + columns,
                         aggfunc=np.nansum,
                         fill_value=np.nan).T
And, finally, we change the vertical and horizontal indices, for this we cut off the temporary highest levels in them - All_cols and All_rows:
    df_wide.index = df_wide.index.droplevel(0)
    df_wide.columns = df_wide.columns.droplevel(0)
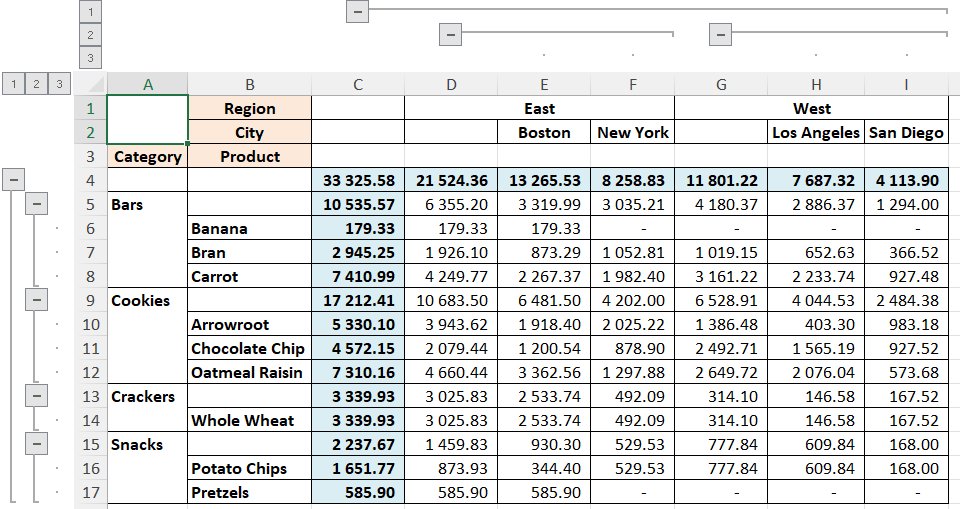
That's all. Now the pivot table will look like this:
Figure 4. Python pivot table by @oleghbond. The result is imported into and displayed in Excel.
A pivot table with intermediate and final results both by rows and by columns is already in Python. The complete code of the method with a test example can be found on github – .
The presented method is not interactive, but it is not required. Instead, the result is obtained programmatically in the form of a standard multi-index data frame.
And the last. The methods on which the presented method is built, namely: python_tableand pivot_w_subtotdo not lose their value when summarization without subtotals or with subtotals only by rows is required.


