![]()
Floodd provides a comprehensive analysis of flood events, utilizing a range of visualizations to explore patterns, trends, and impacts based on geographical data, temporal factors, and causal information. It is designed to aid researchers, policymakers, and the public in understanding the dynamics of floods and facilitating data-driven decision-making in disaster management and mitigation strategies.
Site live at: https://floodd.streamlit.app/
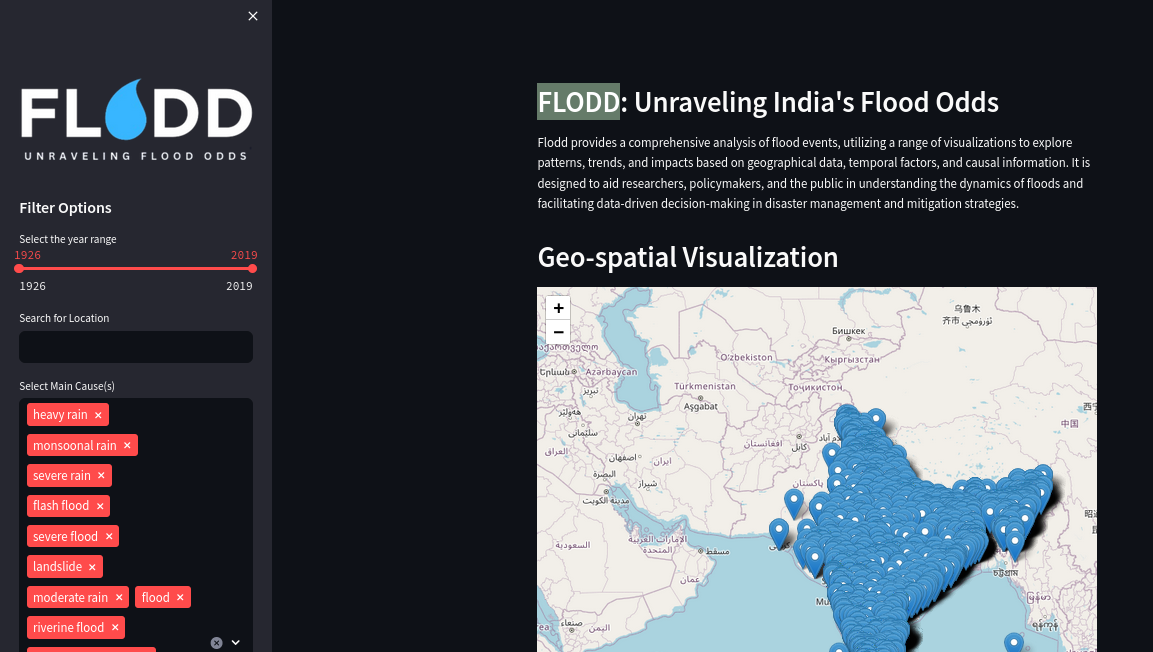
- Geo-spatial Visualization: Visualize flood events on a map to understand the geographical distribution.
- Time Series Analysis: Analyze flood events over time to observe trends and patterns.
- Categorical Analysis: Explore the distribution of floods based on their main causes.
- Statistical Analysis: Examine relationships between flood duration, fatalities, and injuries.
- Word Cloud Visualization: View key terms from the descriptions of flood events to gain insights into common themes.
- Interactive Filters: Dynamically filter data based on year, location, and main causes of floods.
To run the Flodd dashboard locally, follow these steps:
- Clone the repository:
git clone https://github.com/yourusername/flodd.git
-
Navigate to the cloned directory:
cd flodd -
Install the required Python packages:
pip install -r requirements.txt
markdown
- Run the Streamlit application:
streamlit run app.py
- Python: Primary programming language
- Streamlit: Framework for creating the dashboard
- Pandas: Data manipulation and analysis
- Matplotlib/Seaborn: Data visualization
- Folium: Interactive map visualizations
- WordCloud: Generating word clouds from text data
We welcome contributions to the Flodd project. If you have suggestions or improvements, please fork the repository and submit a pull request.
This project is licensed under the MIT License - see the LICENSE file for details.