dsar is a commandline utility that collects statistics from prometheus format endpoints.
Currently it can recognise statistics from node_exporter and from the YugabyteDB server processes (tablet servers and masters).
dsar prints the statistics it is set to print (default output in the format of sar -u).
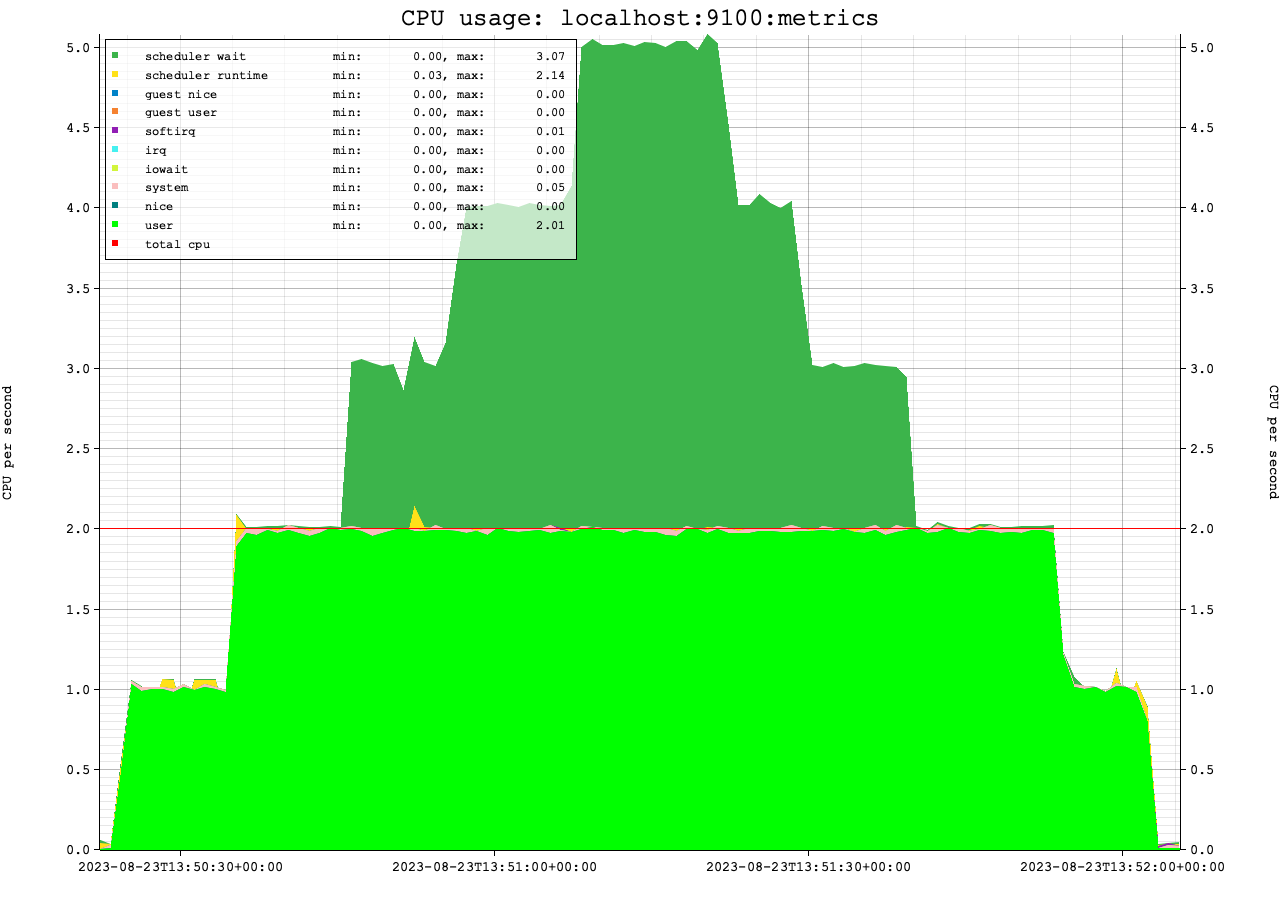
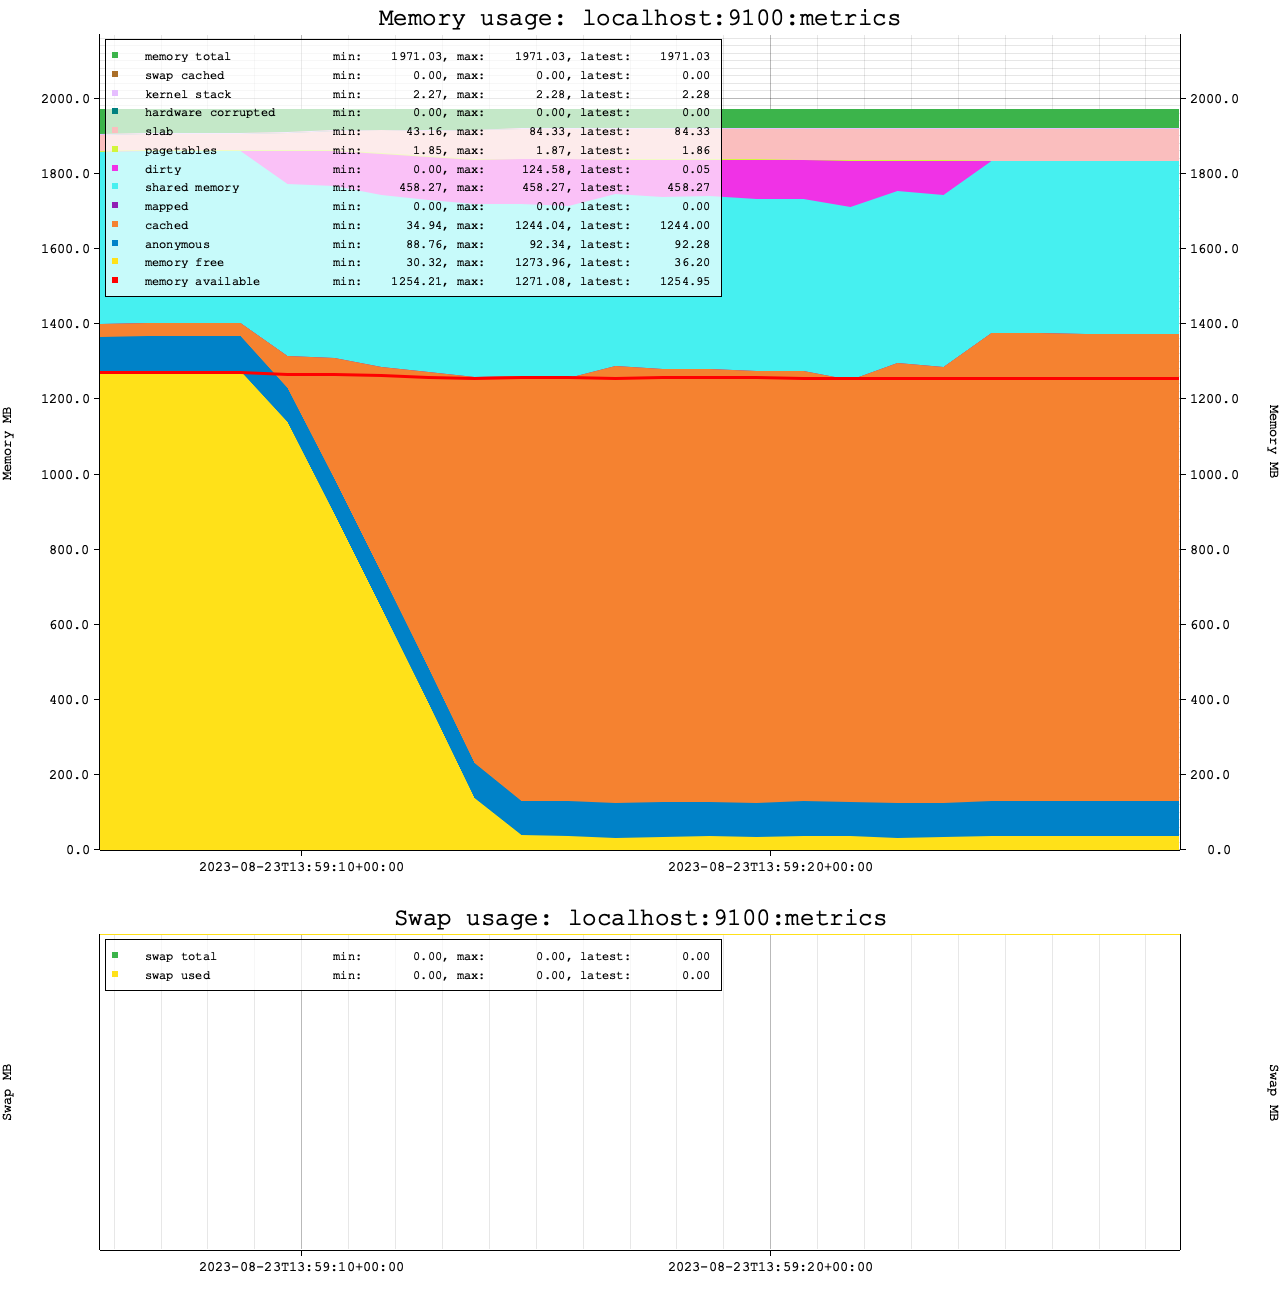
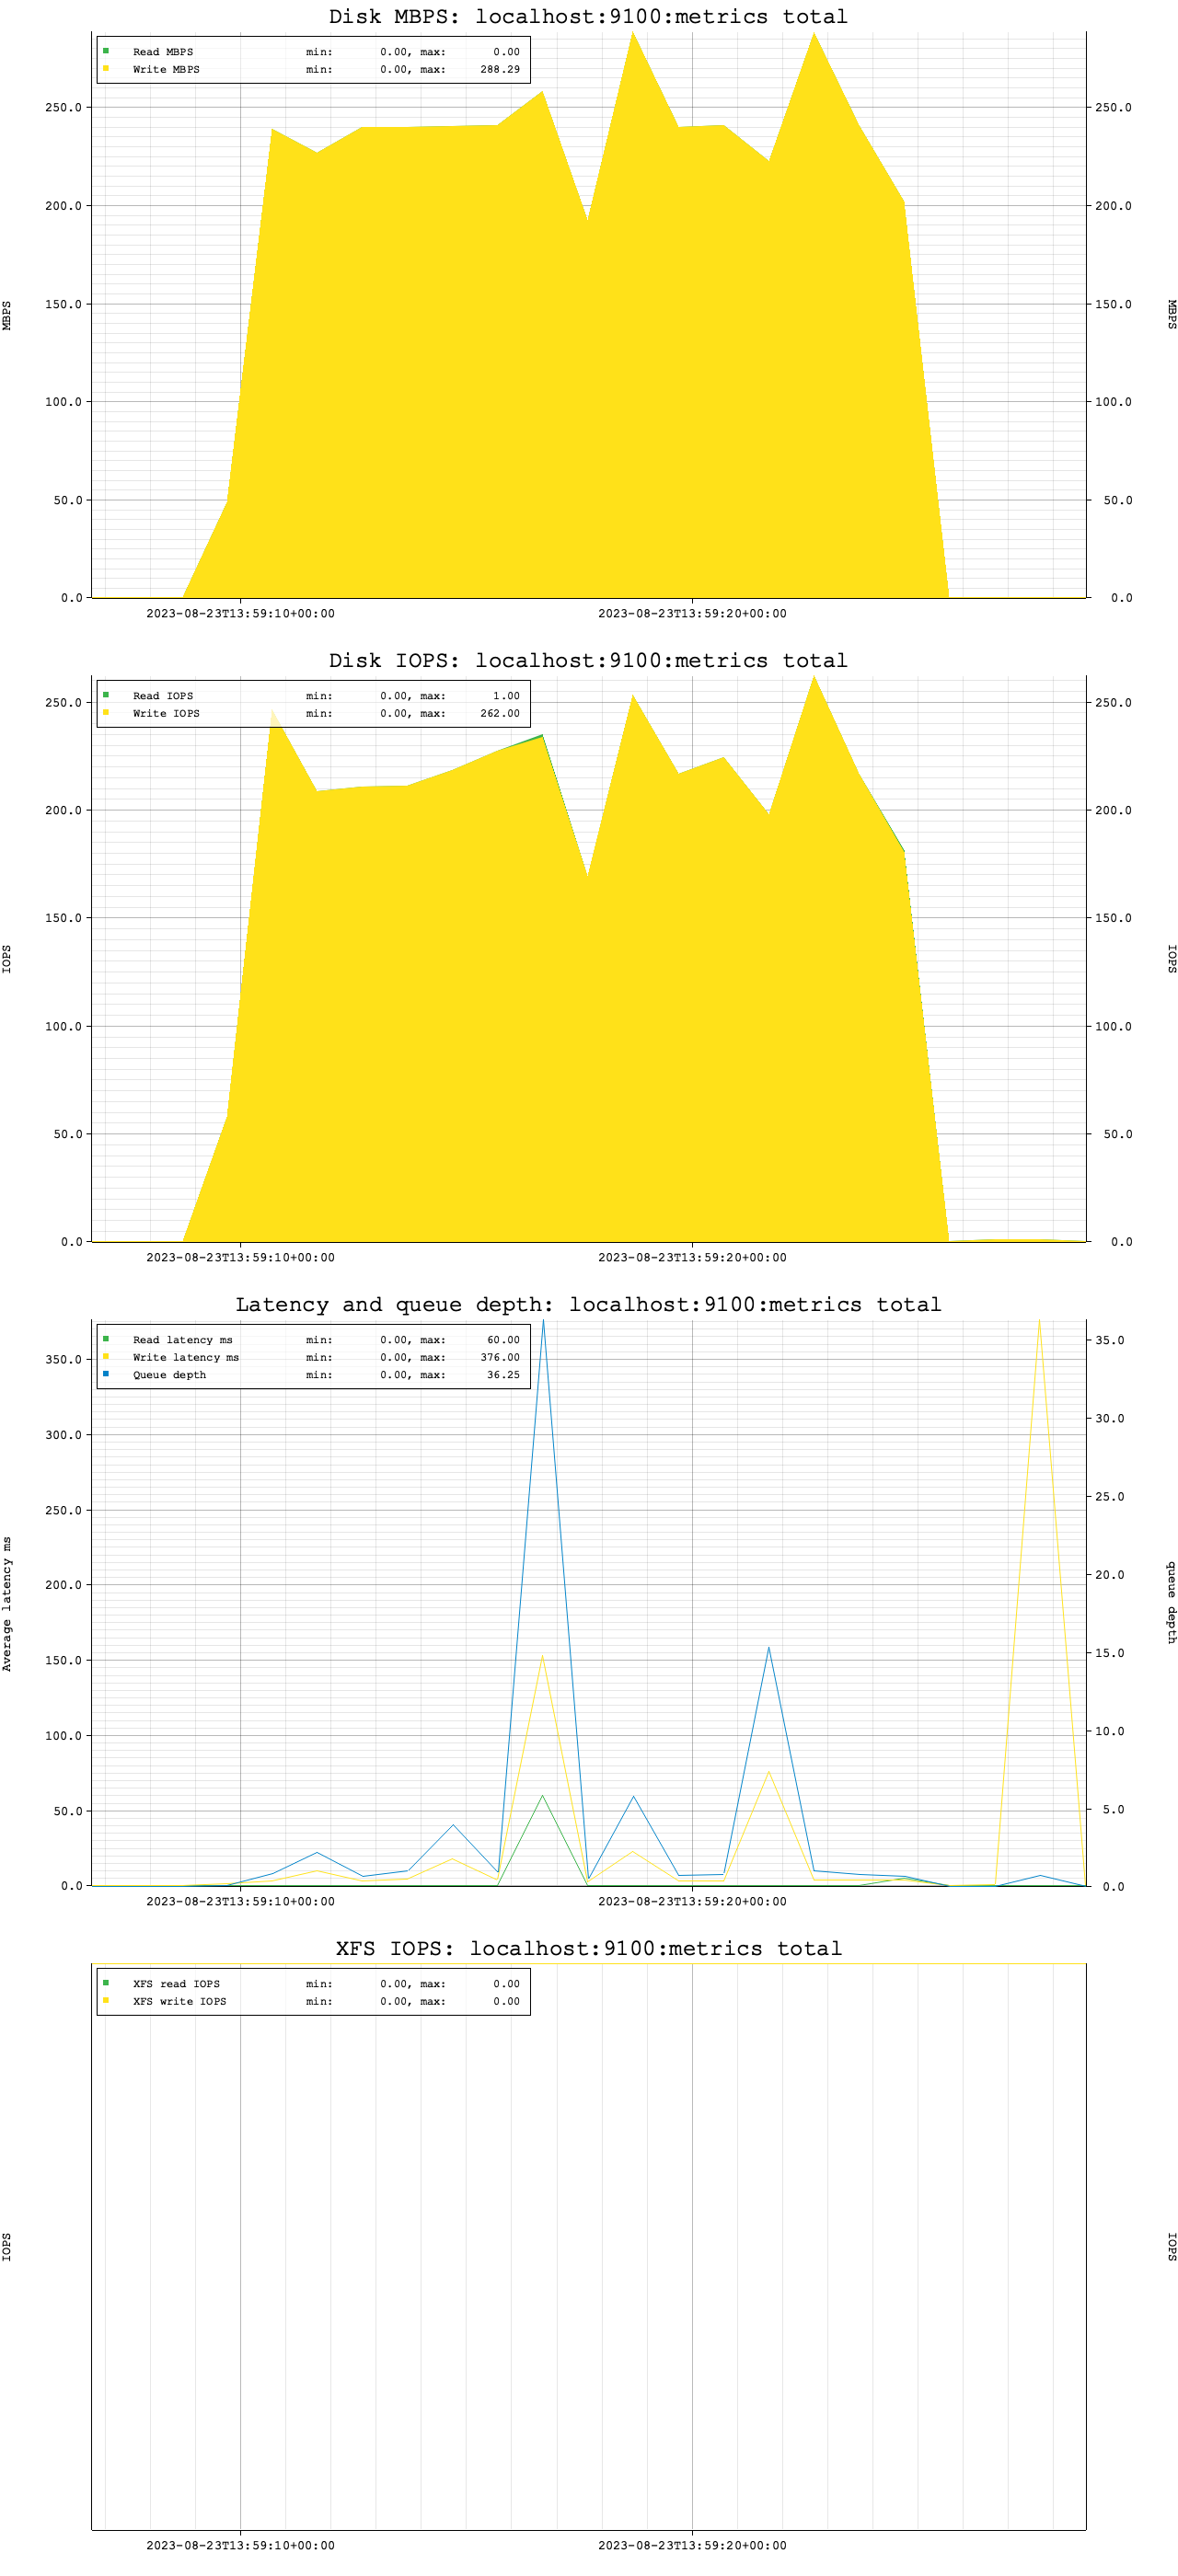
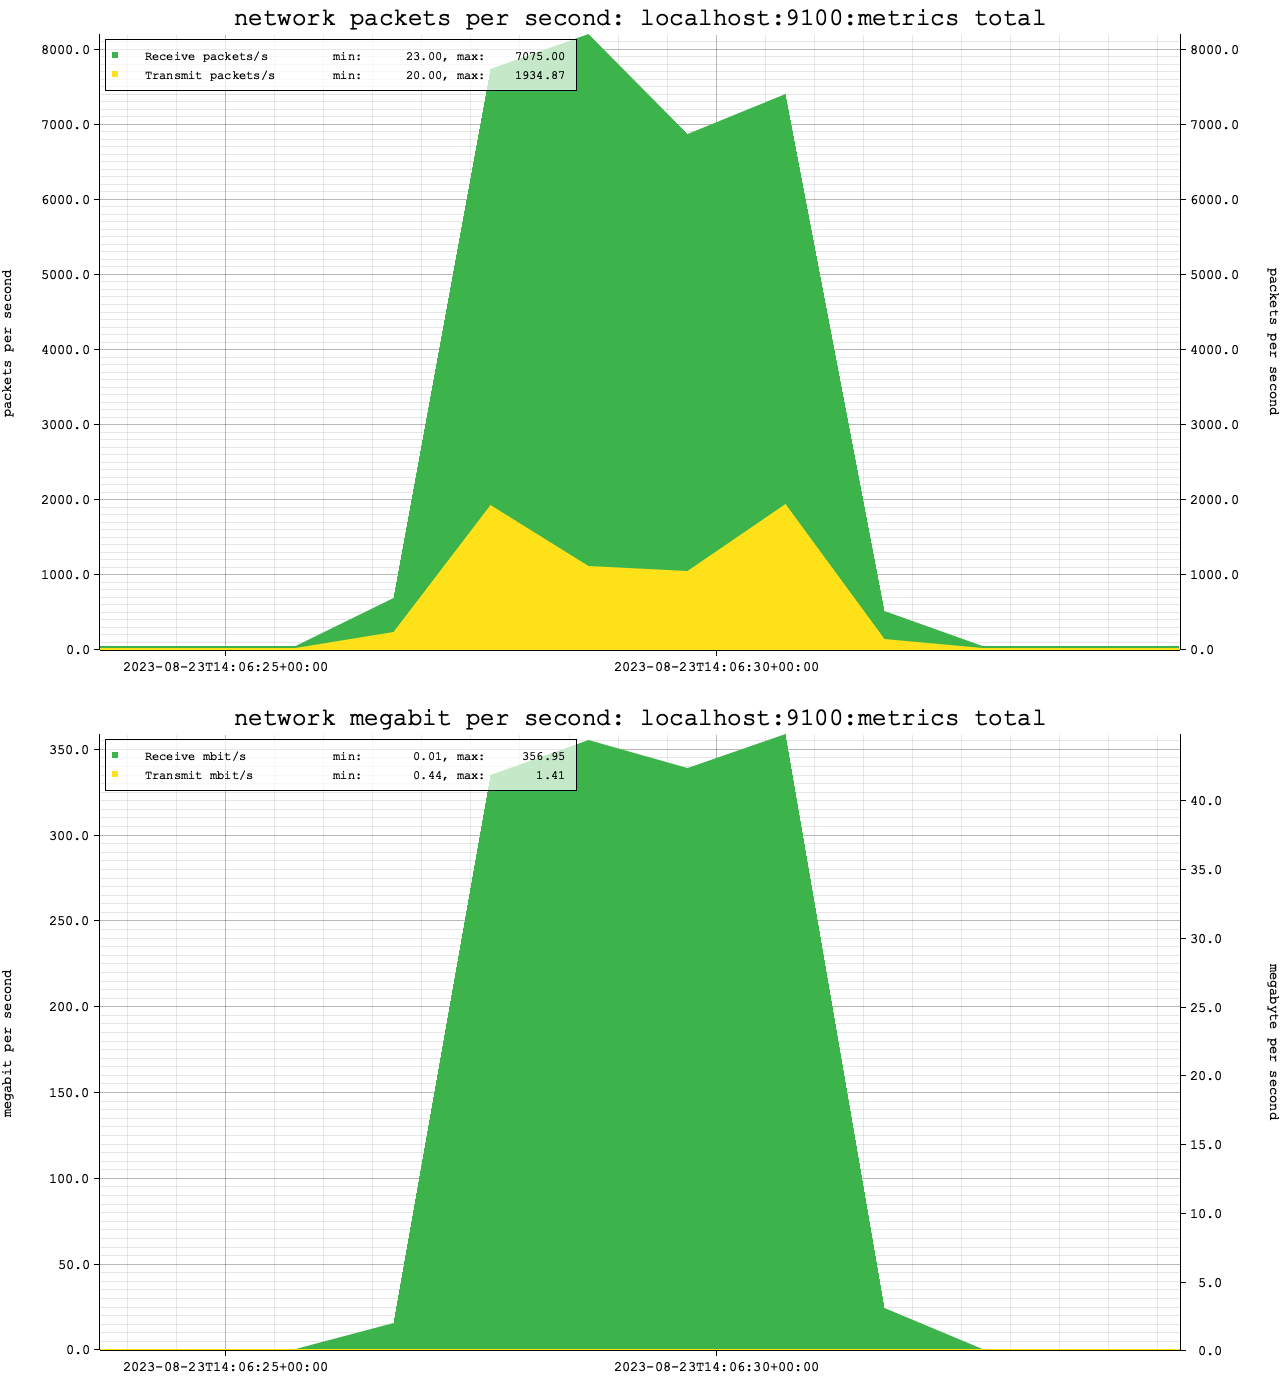
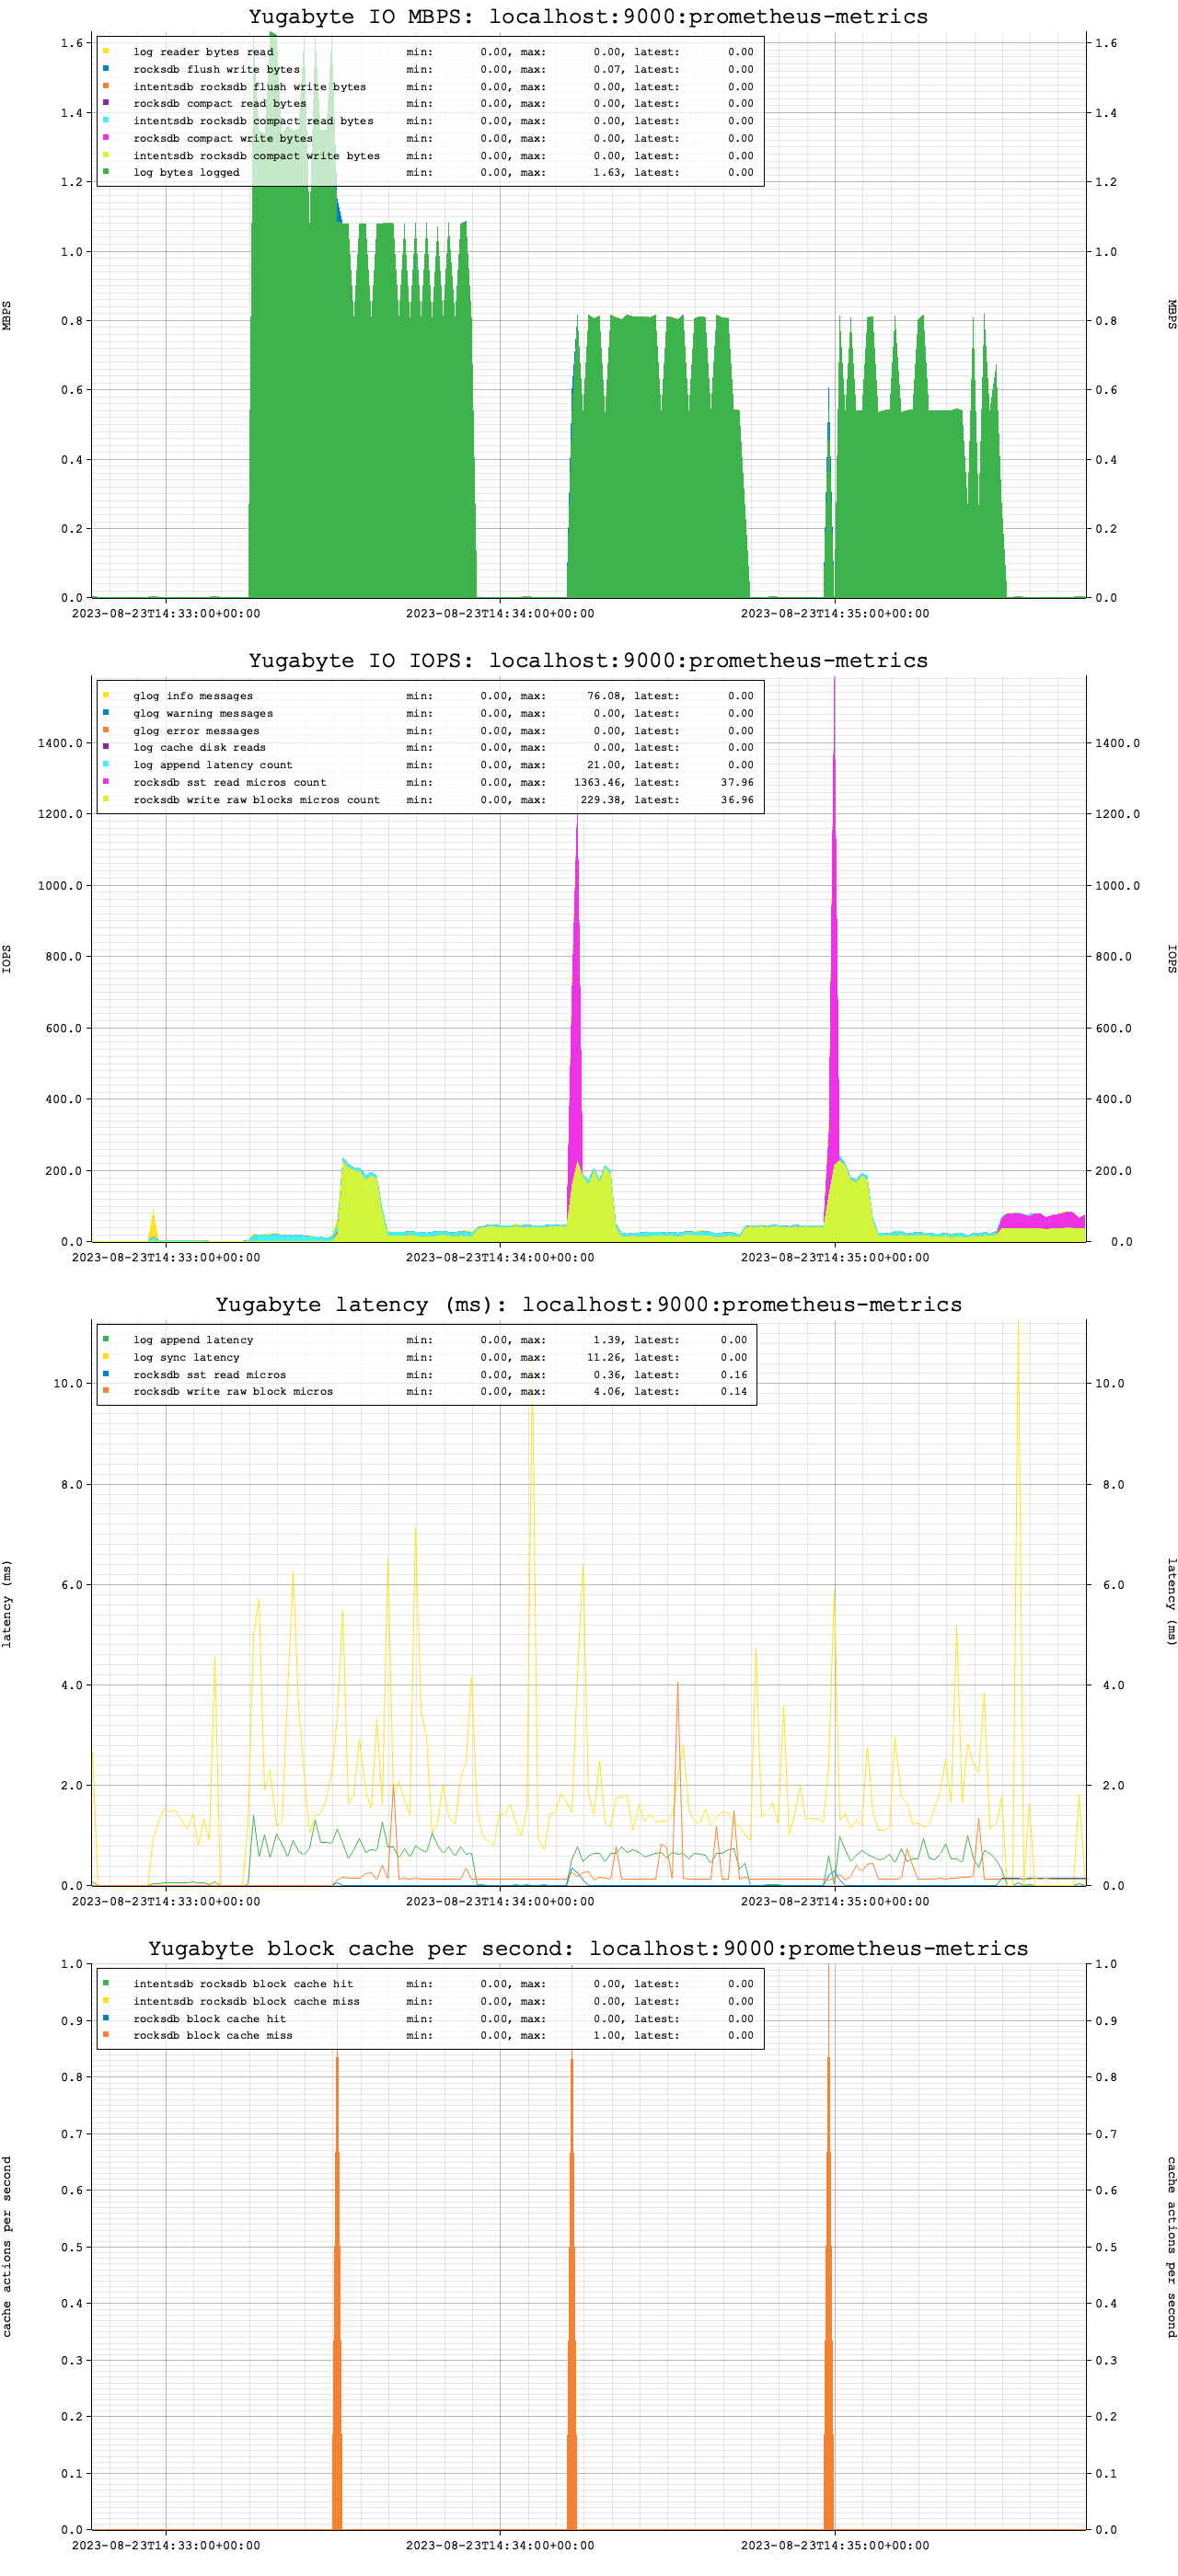
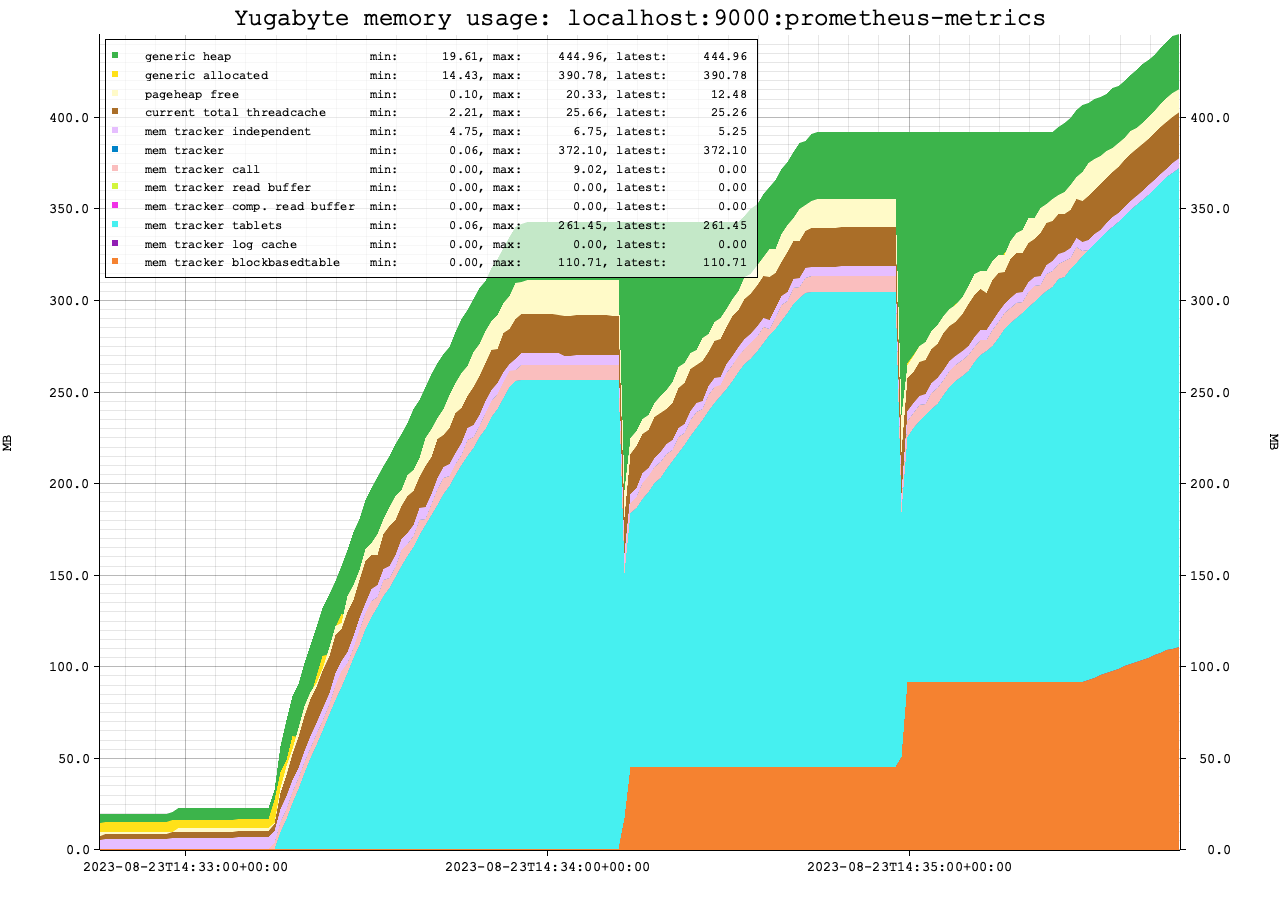
dsar stores a selection of the statistics, which it can use to plot the details of the selected statistics if it's set to create them (-g).
By default dsar will use "localhost" and port number 9100, the default node_exporter port.
The output by default is identical to the sar utility (sar on recent linux versions):
$ dsar
hostname                       time     CPU      %usr     %nice      %sys   %iowait    %steal     %idle
localhost:9100:metrics         13:41:05 all     25.66      0.00      8.05      0.00      0.00     66.29
localhost:9100:metrics         13:41:06 all     24.56      0.00      8.40      0.00      0.00     67.04
localhost:9100:metrics         13:41:07 all     25.13      0.00      7.29      0.00      0.00     67.59
Outside of the simple CPU percentages, it can show multiple sar and other utilities format statistics:
-
sar-u (default): CPU percentages for user, nice, system, iowait, steal and idle.
-
sar-u-ALL: CPU percentages for user, nice, system, iowait, steal, irq, softirq, guest, guest nice and idle.
-
cpu-all: CPU time(!) for user, nice, system, iowait, steal, irq, softirq, guest, guest nice, idel, scheduler run and scheduler wait.
-
yb-cpu: CPU time as accounted by the YugabyteDB tablet server and master processes, excludes the postgres layer.
-
sar-d: disk device statistics: tps, rMB/s, wMB/s, areq-sz, aqu-sz, await.
-
iostat: disk device statistics: tps, MB_read/s MB_wrtn/s, MB_read, MB_writn.
-
iostat-x: disk device statistics: r/s, w/s, rMB/s, wMB/s, rrqm/s, wrqm/s, %rrqm/s, %wrqm/s, r_await, w_await, aqu-sz, rareq-sz, wareq-sz.
-
xfs-iops: disk device statistics: XFS level (logical IO) statistics: device, W_IOPS, R_IOPS.
-
yb-io: disk device statistics by the YugabyteDB tablet server and master processes, excludes the postgres layer.
-
sar-n-DEV: network statistics: IFACE, rxpck/s, txpck/s, rxMB/s, txMB/s, rxcmp/s, txcmp/s, rxmcst/s.
-
sar-n-EDEV: network error statistics: IFACE, rxerr/s, txerr/s, coll/s, rxdrop/s, txdrop/s, txcarr/s, rxfifo/s, txfifo/s.
-
sar-n-SOCK: network socket statistics: totsck, tcpsck, udpsck, rawsck, ip-frag, tcp-tw.
-
sar-n-SOCK6: network socket ipv6 statistics: tcp6sck, udp6sck, raw6sck, ip6-frag.
-
sar-n-SOFT: network softnet statistics: total/s dropd/s/ squeezd/s, rx_rps/s flw_lim/s.
-
yb-network: network statistics (RPC only) by the YugabyteDB tablet server and master processes, excludes the postgres layer.
-
sar-S: swap statistics: mbswpfree, mbswpused, %swpused, mbswapcad, %swpcad.
-
sar-W: swap IO statistics: pswpin/s, pswpout/s.
-
sar-q: run statistics: runq-sz, plist-sz, ldavg-1, ldavg-5, ldavg-15, blocked.
-
sar-B: paging statistics: pgpgin/s, pgpgout/s, fault/s, majflt/s.
-
vmstat: virtual memory statistics: procs, memory, swap, io, system, cpu.
-
sar-r: memory statistics: mbmemfree, mbavail, mbmemused, %memused, mbbuffers, mbcached, mbcommit, %commit, mbactive, mbinact, mbdirty.
-
sar-r-ALL: memory statistics: mbmemfree, mbavail, mbmemused, %memused, mbbuffers, mbcached, mbcommit, %commit, mbactive, mbinact, mbdirty, mbanonpg, mbslag, mbstack, mbpgtbl, mbvmused.
-
mem-relevant: total, swpcached, kernelstk, hwcorrupt, slab, pgatbls, shared, dirty, mapped, cached, anon, free, avail.
-
yb-mem: memory statistics by the YugabyteDB tablet server and master processes, excludes the postgres layer.
-
psi: pressure stall information: some cpu, some io, full io, some mem, full mem.
If the -g or --graph switch is added, dsar will create graphical plots of some metrics:
