InnovaTest. R-based software to process data from ligand-binding assays (eg. ELISA, Pierce)
based on 4PL sigmoid curve.
Copyright (c) 2018 Olga Poleshchuk, Ruslan Al-Shehadat
This program is free software: you can redistribute it and/or modify
it under the terms of the GNU General Public License as published by
the Free Software Foundation version 3 of the License, or
any later version.
This program is distributed in the hope that it will be useful,
but WITHOUT ANY WARRANTY; without even the implied warranty of
MERCHANTABILITY or FITNESS FOR A PARTICULAR PURPOSE. See the
GNU General Public License for more details.
You should have received a copy of the GNU General Public License
along with this program. If not, see http://www.gnu.org/licenses/.
InnovaTest is a user-friendly application for 4PL curve fitting, commonly used in ELISA, dose-response analysis, real-time PCR and a lot of other fields. It allows you to calculate 4-parametric equation, based on your data and calculate concentrations/response in test samples. Based on R-Shiny, it provides high-quality reproducible scientific research and ELISA system development
It is quite useful for dose response and receptor-ligand (i.e. ELISA) assays, or other similar types of assays. To fit the curve, following values are need to be known:
y - system signal (i.e. optical density)
x - calibration factor (concentration)
Parameters:
A - the minimum value that can be obtained (signal at 0 dose)
B - slope of the curve (related to the steepness of the curve at point C)
C - the point of inflection (point of curve halfway between A and D)
D - the maximum value that can be obtained (signal at infinite dose, plateau)
The model makes S-shaped curve, called logistic sigmoid. The equation(1) is:

Example of 4PL sigmoid:

Rearranged equation to solve x is (2):
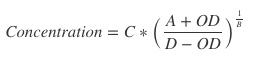
This software use R package drc (Ritz et al., 2015) to fit the model from raw data. It calculates coefficients (A,B,C,D) based on equation (1) and solves equation (2) using them.
- Online version - https://innovatest.shinyapps.io/InnovaTest/
- Run within RStudio - after downloading this repository, run
app.Rfile using RStudio. Application will be opened in new RStudio window or in your default browser. - Run within linux console - only R programming is required (https://www.r-project.org/). Download repository, then enter the following command:
R -e "shiny::runApp('path/to/folder/innovatest-master')"Application will be opened in default browser or the following line will be displayedListening to <link>copy link to browser.
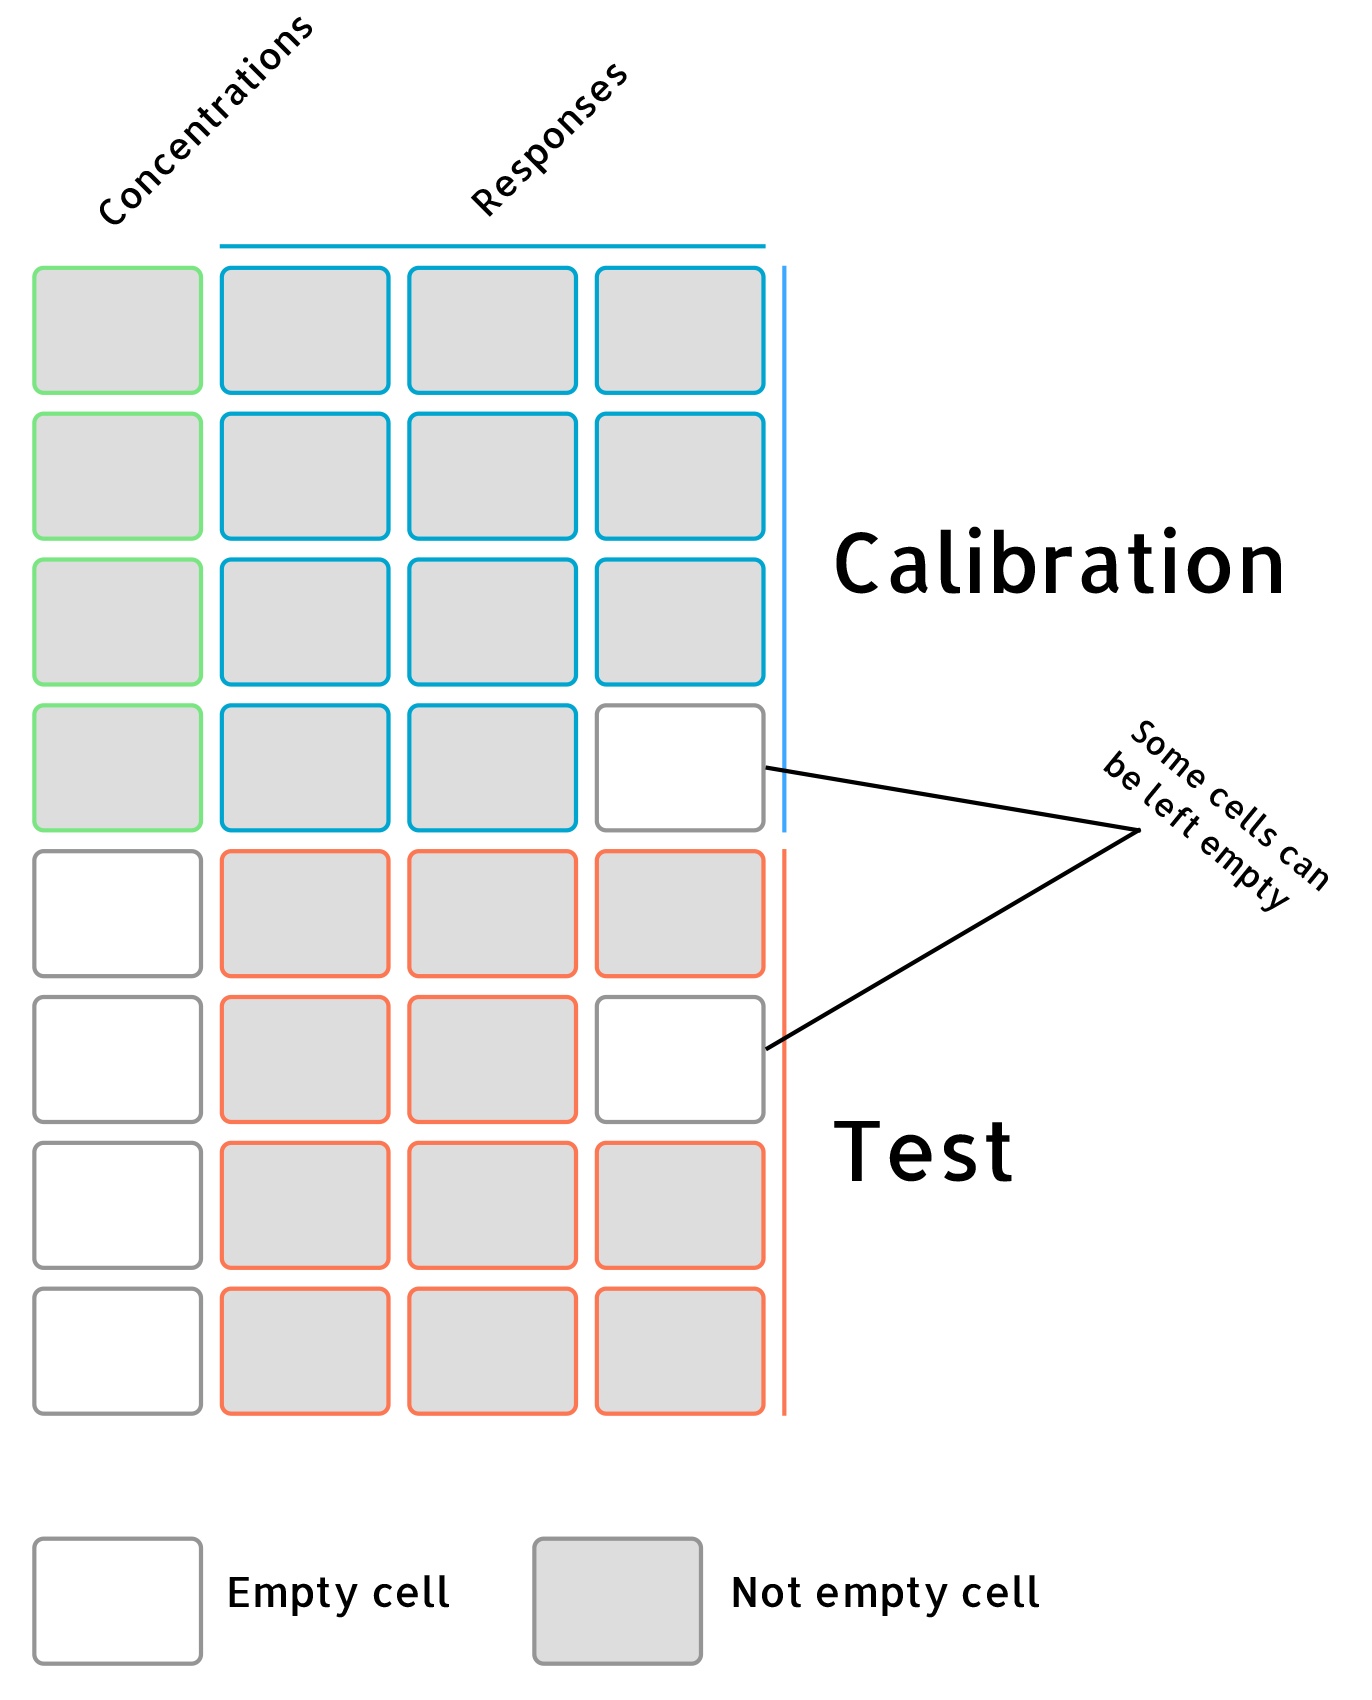
Table mode is easier to use if you are not familiar with essays such ELISA and dose response analysis.
To use table mode .csv of .xls table should be created. First column is Concentration, fill the it with values indicationg the concentration of defined calibrators. Next columns should be filled with response values (optical density). Each cell is set for one replicate, so if you have three replicates of one sample in your experiment, than 3 cells in row should be filled.
NB: There should be no column names in your file, they will be generated automatically.
Maximum number of replicates - specify maximum number of replicates in your experiment. If all samples have 2 replicates and one has 3, then select 3;
Choose file type - choose format of your input file. If it is a csv, then \tab is considered as column separator and dot is a decimal separator;
Output file name - is set as a current date by default, but you can change it.
This mode is convenient if you are familiar with ELISA essays, so using it, you are able to use raw plate data straight from your spectrophotometer with scheme of plate, which defines positions of calibratiors and test samples in your plate.
Input file - in plate mode the only supported format is xls
Concentrations - paste list of calibrators' concentrations with commas in-between (without spaces or any other symbols)
To process the whole plate you need to make a scheme of plate right below your data in excel spreadsheet.
C - Calibrators
T - Tests

Results are shown in a convenient format after the Calculate button is pushed.
It contains table with calculated concentrations' values, mean ODs, variation coefficient and 4PL curve generated based on resulting table
- When using table mode and
csvinput file make sure that all columns have proper names displayed (Concentration, OD1, OD2...). In case there are NAs in column names, tuneMaximal number of replicatesparameter; - There should be no column headers in your input file;
- Pay attention to decimal separator and column separator in csv files (decimal -
dot, between-column -\tab). - There are example files in repository, you can use them as a template in case of any problems.
P.S. in case you have any questions and ideas, feel free to contact:
poleshchukolala@gmail.com