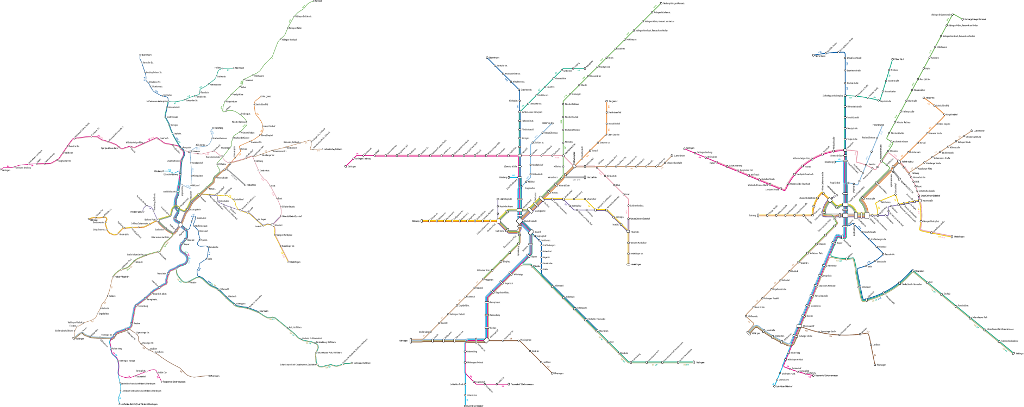
 2015 Stuttgart light rail network maps generated from GTFS data, with optimal line orderings, geographically correct (left), octilinear (middle), and orthoradial (right).
Software suite for the automated generation of geographically correct or schematic transit maps. Still alpha status with minimal documentation, so beware.
Based on our work in the following papers:
Bast H., Brosi P., Storandt S., Efficient Generation of Geographically Accurate Transit Maps, SIGSPATIAL 2018
Bast H., Brosi P., Storandt S., Efficient Generation of Geographically Accurate Transit Maps (extended version), ACM TSAS, Vol. 5, No. 4, Article 25, 2019
Bast H., Brosi P., Storandt S., Metro Maps on Octilinear Grid Graphs, EuroVis 2020
Bast H., Brosi P., Storandt S., Metro Maps on Flexible Base Grids, SSTD 2021
Also see our web demos here and here.
cmakegcc >= 5.0(orclang >= 3.9)- Optional:
libglpk-dev,coinor-libcbc-dev,gurobi
Fetch this repository and init submodules:
git clone --recurse-submodules https://github.com/ad-freiburg/loom.git
mkdir build && cd build
cmake ..
make -j
To (optionally) install, type
make install
This suite consists of several tools:
gtfs2graph, create a GeoJSON line graph from GTFS datatopo, create an overlapping-free line graph from an arbitrary line graphloom, find optimal line orderings on a line graphocti, create a schematic version of a line graphtransitmap, render a line graph into a map
All tools output a graph, in the GeoJSON format, to stdout, and expect a GeoJSON graph at stdin. Exceptions are gtfs2graph, where the input is a GTFS feed, and transitmap, which write SVG to stdout.
The example folder contains several overlapping-free line graphs.
To render the geographically correct Stuttgart map from above, use
cat examples/stuttgart.json | loom | transitmap > stuttgart.svg
To also render labels, use
cat examples/stuttgart.json | loom | transitmap -l > stuttgart-label.svg
To render an octilinear map, put the octi tool into the pipe:
cat examples/stuttgart.json | loom | octi | transitmap -l > stuttgart-octilin.svg
To render for example the orthoradial map from above, use a different base graph for octi:
cat examples/stuttgart.json | loom | octi -b orthoradial | transitmap -l > stuttgart-orthorad.svg
To extract for example a line graph for streetcars from GTFS data, use gtfs2graph as follows:
gtfs2graph -m tram freiburg > freiburg.json
This line graph will have many overlapping edges and stations. To create an overlapping-free line graph ready for rendering, add topo:
gtfs2graph -m tram freiburg | topo > freiburg.json
A full pipeline for creating an octilinear map of the Freiburg tram network would look like this:
gtfs2graph -m tram freiburg | topo | loom | octi | transitmap > freiburg-tram.svg
You can also use any tool in a Docker container via the provided Dockerfile.
To build the container:
docker build -t loom
To run a tool from the suite, use
docker run -i loom <TOOL>
For example, to octilinearize the Freiburg example, use
cat examples/freiburg.json | sudo docker run -i loom octi
Note: if you want to use gurobi for ILP optimization, you must mount a folder container a valid gurobi license file gurobi.lic to /gurobi/ in the container. For example, if your gurobi.lic is in /home/user/gurobi:
docker run -v /home/user/gurobi:/gurobi loom <TOOL>