 |
 |
 |
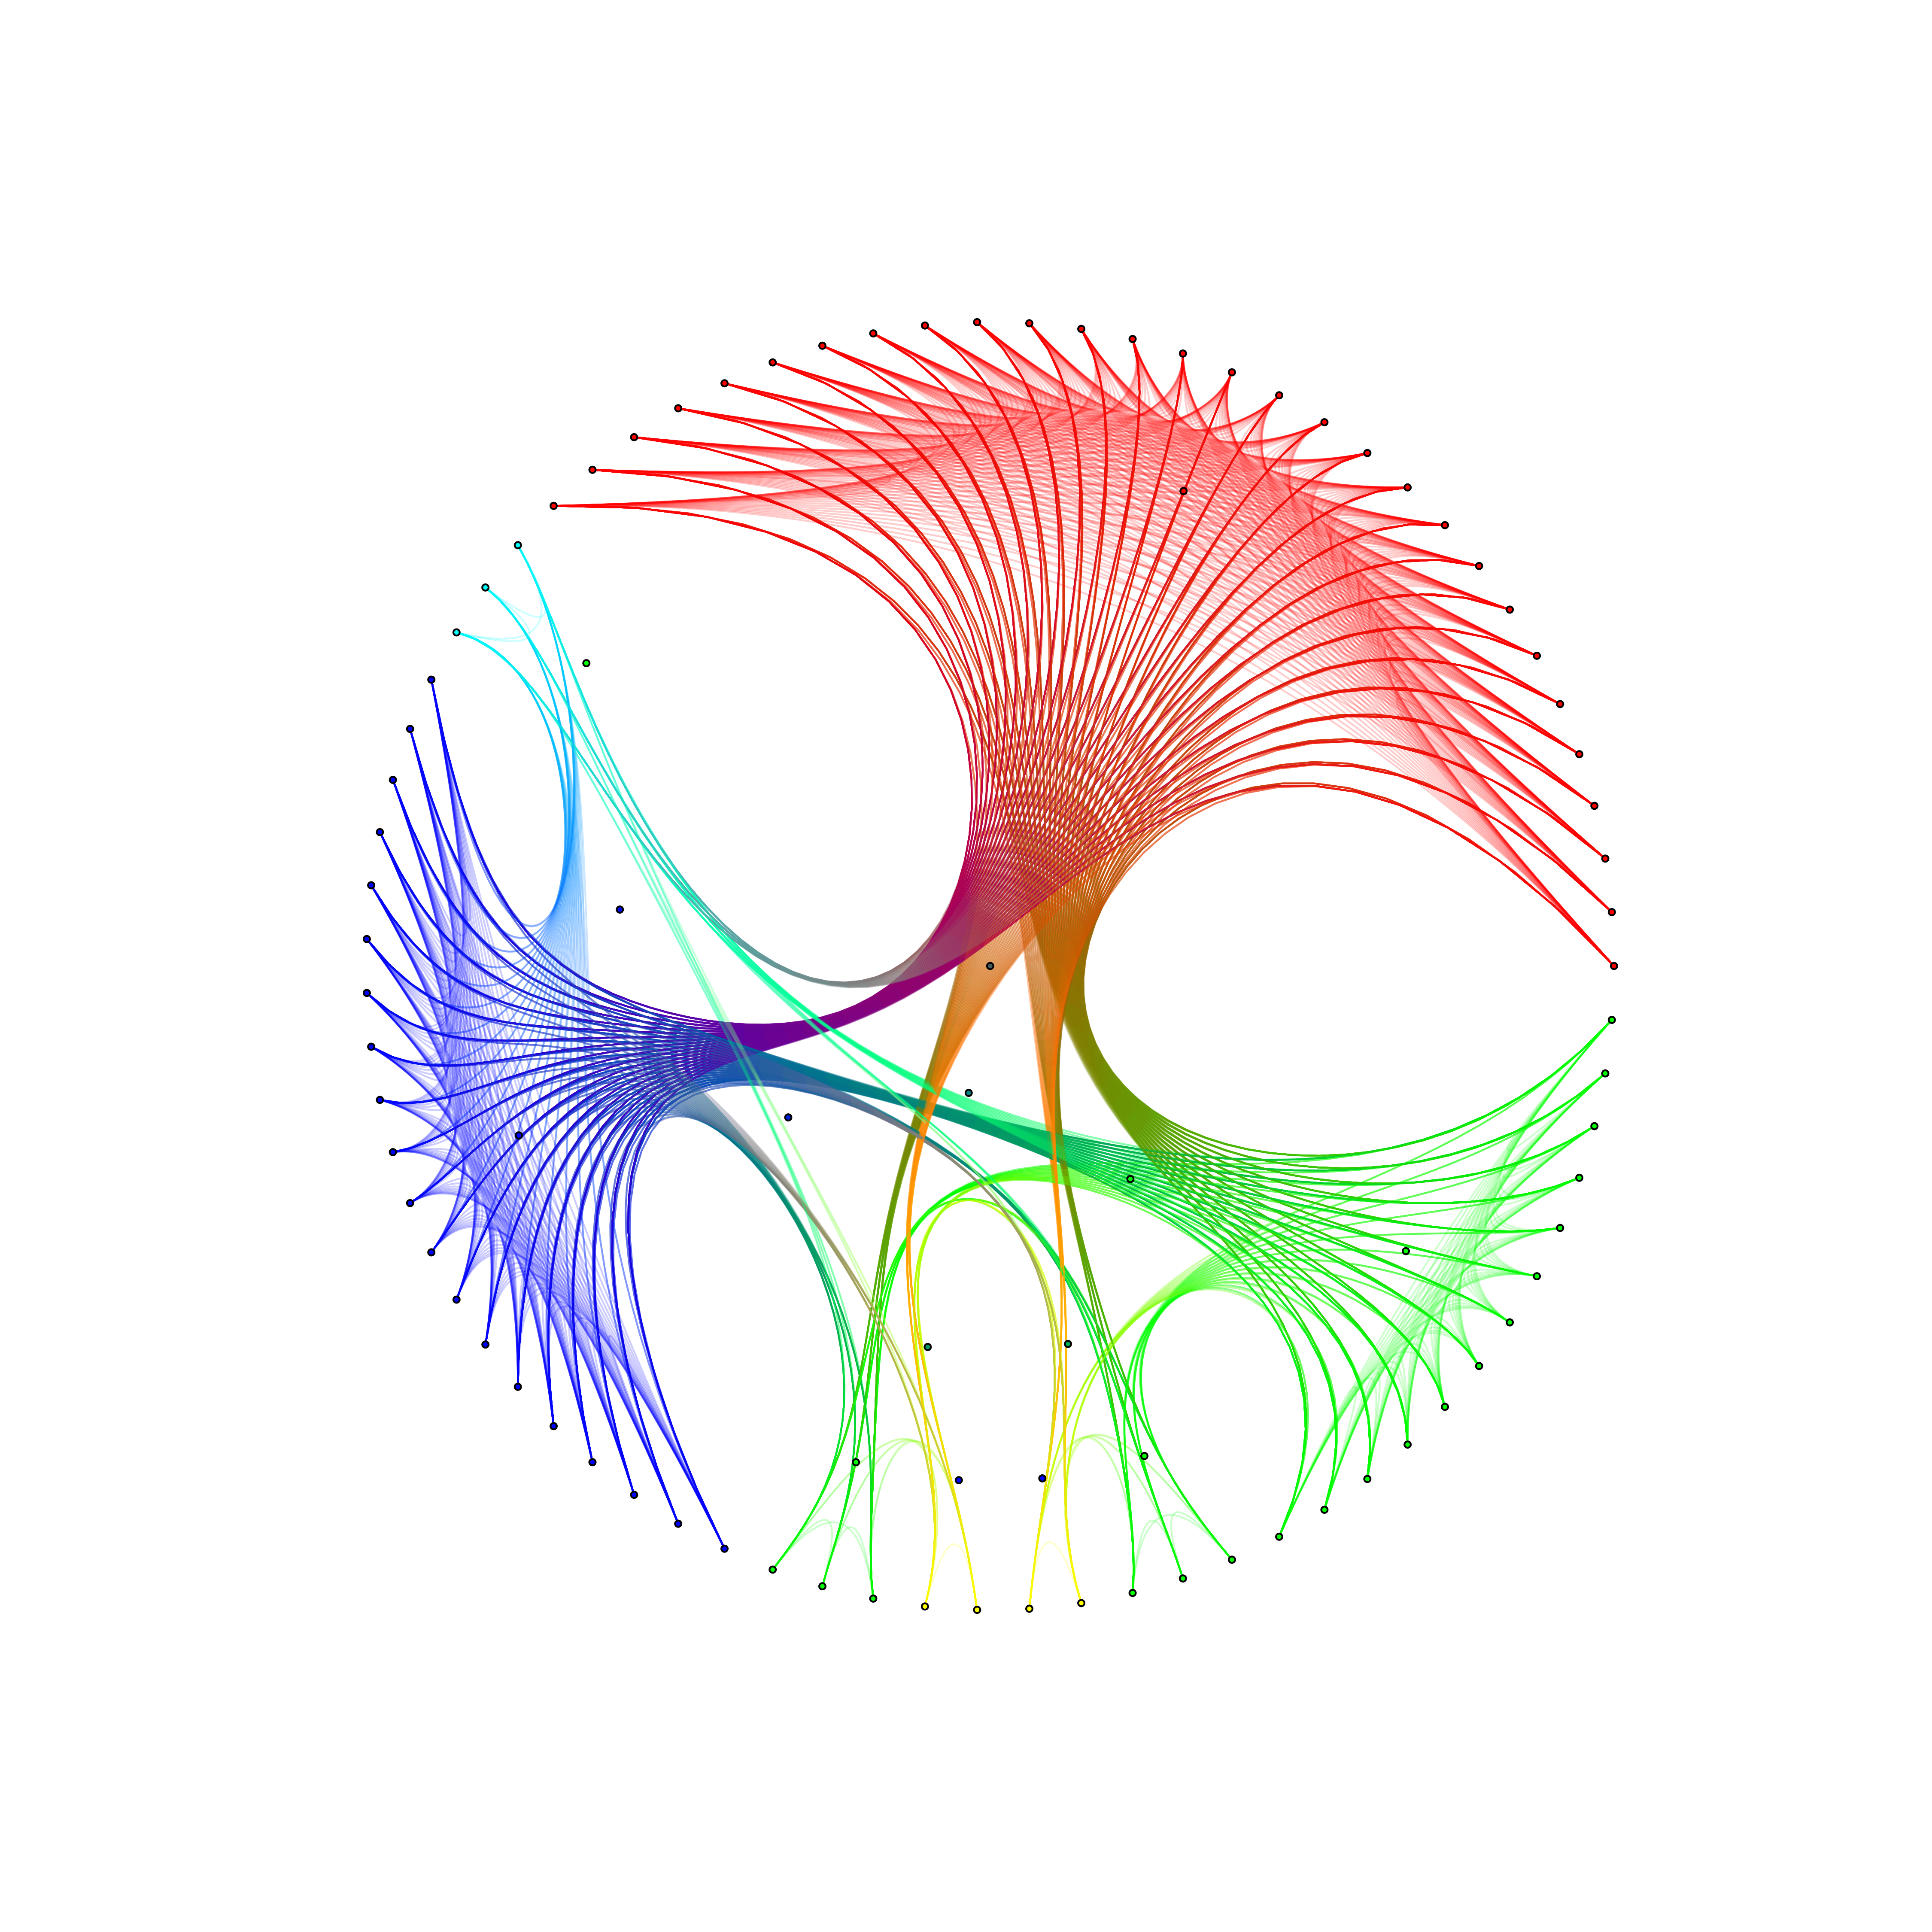
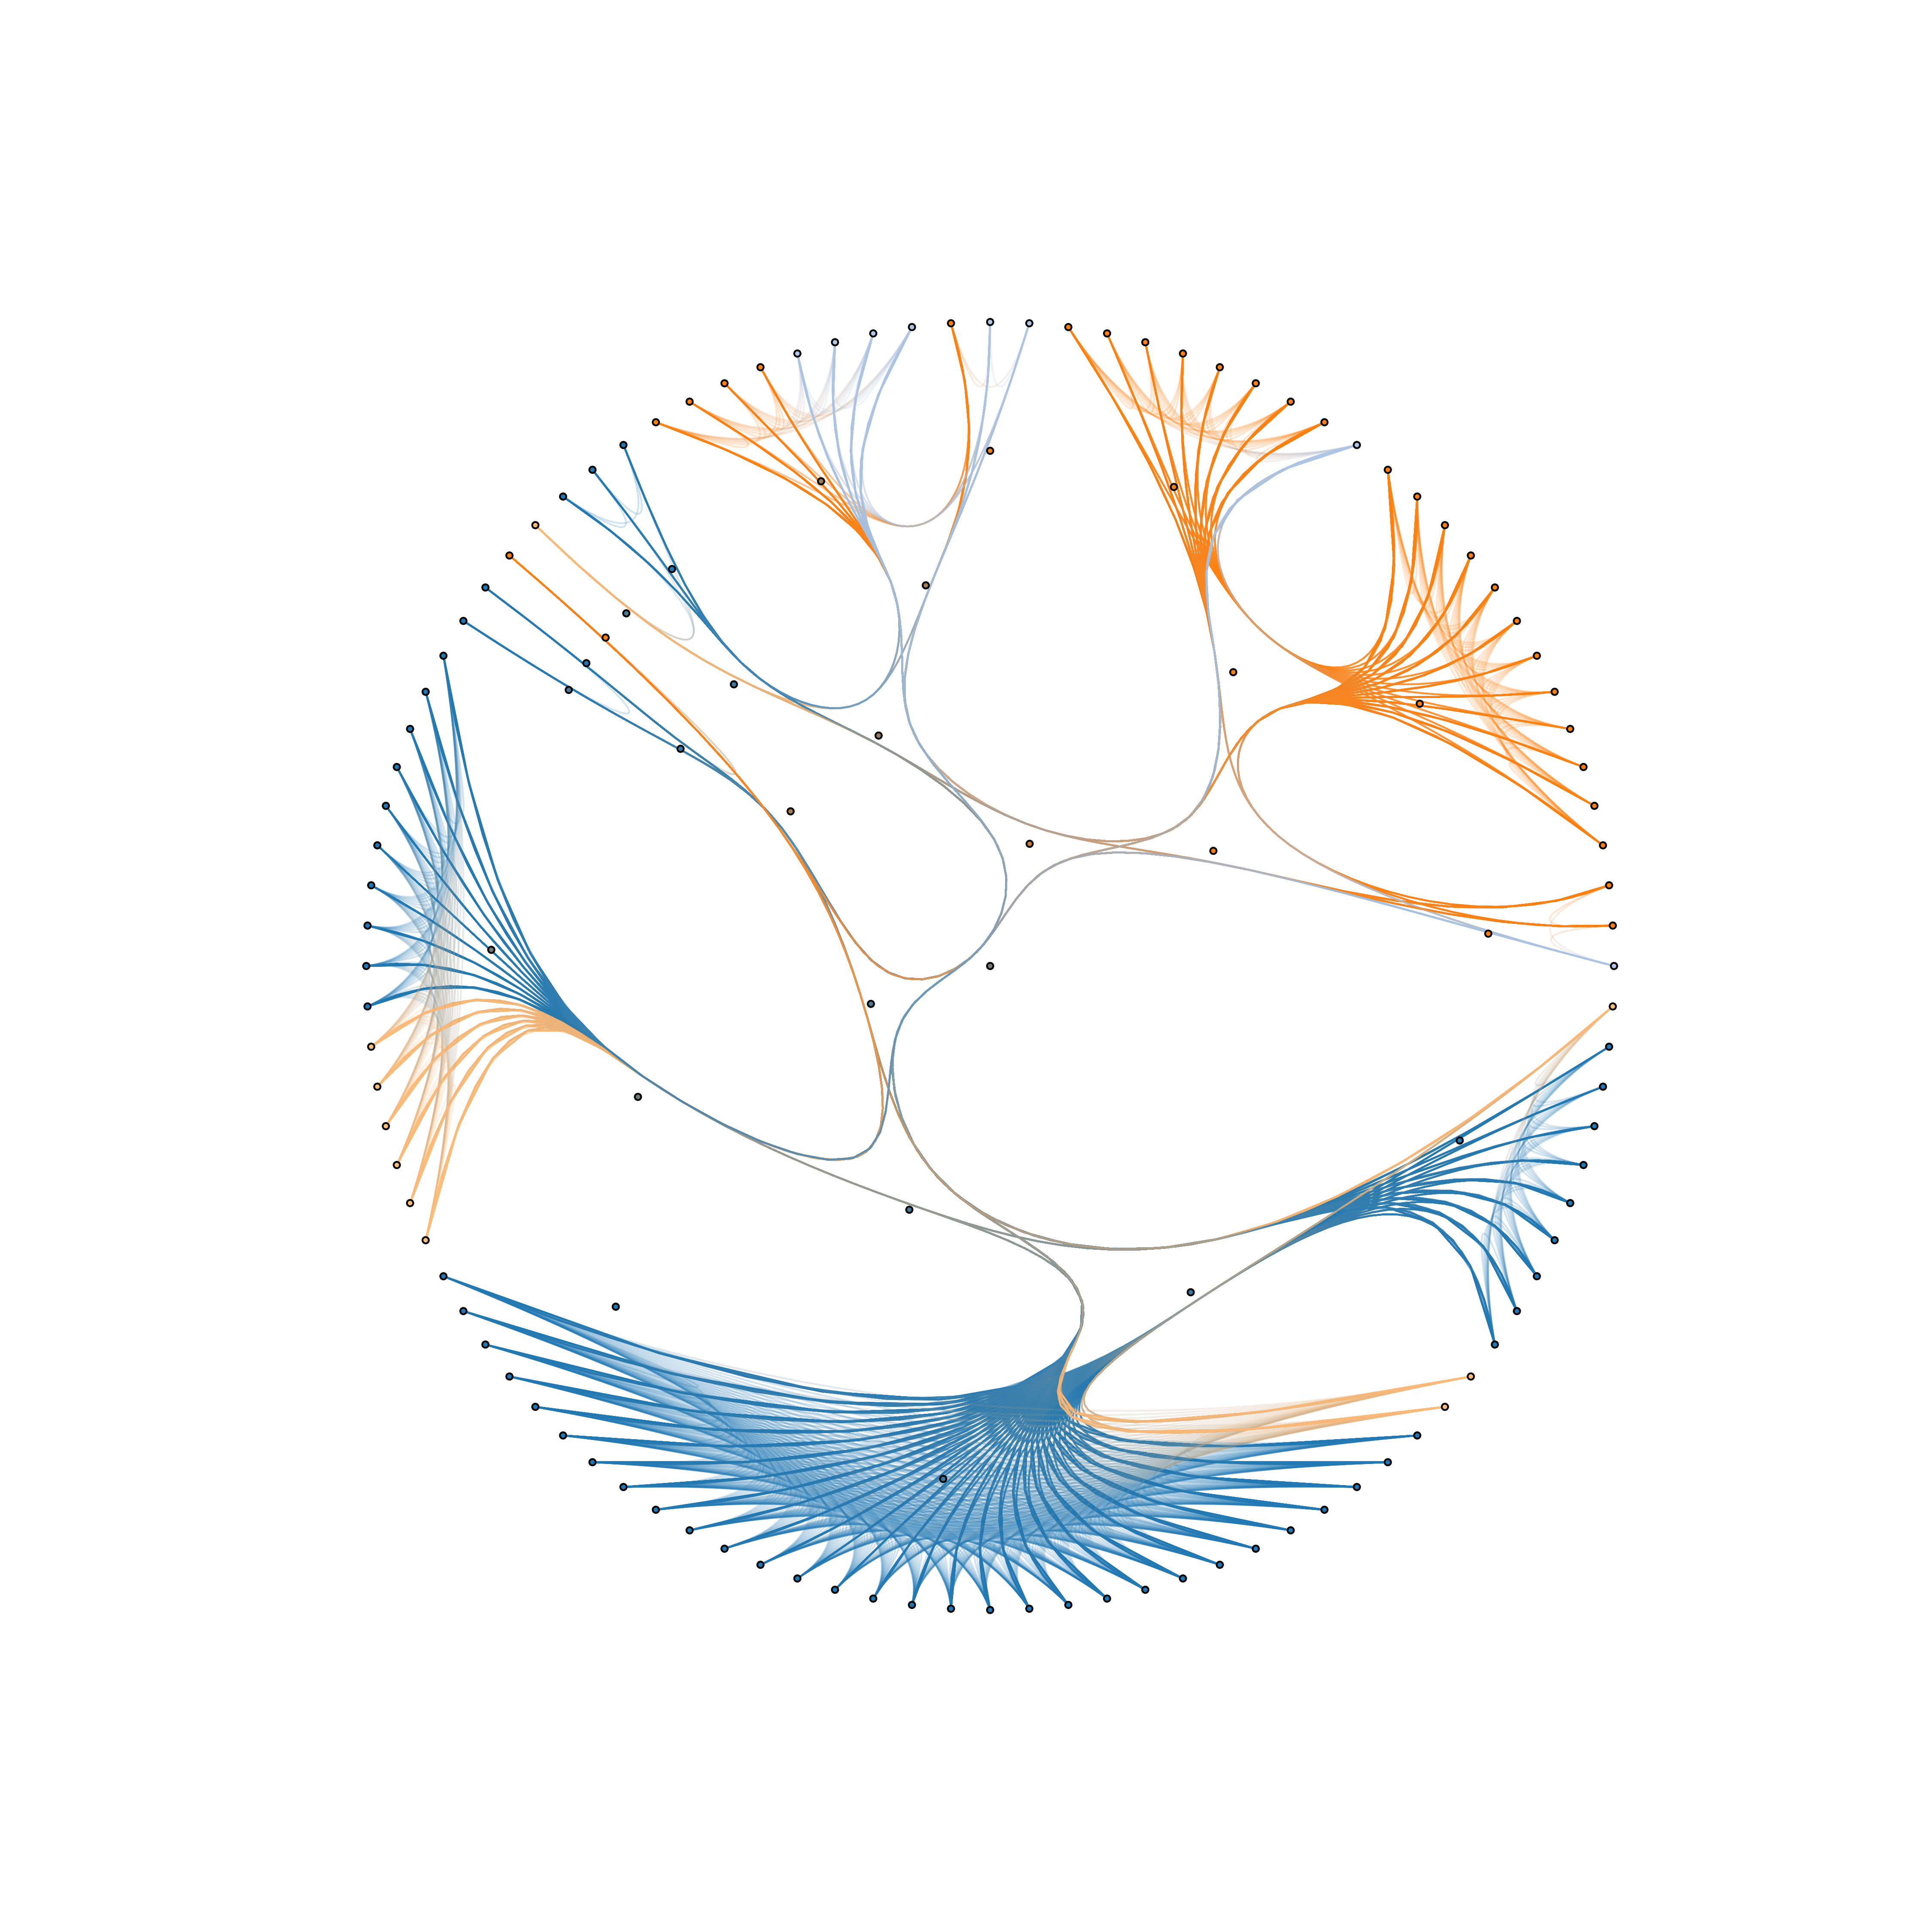
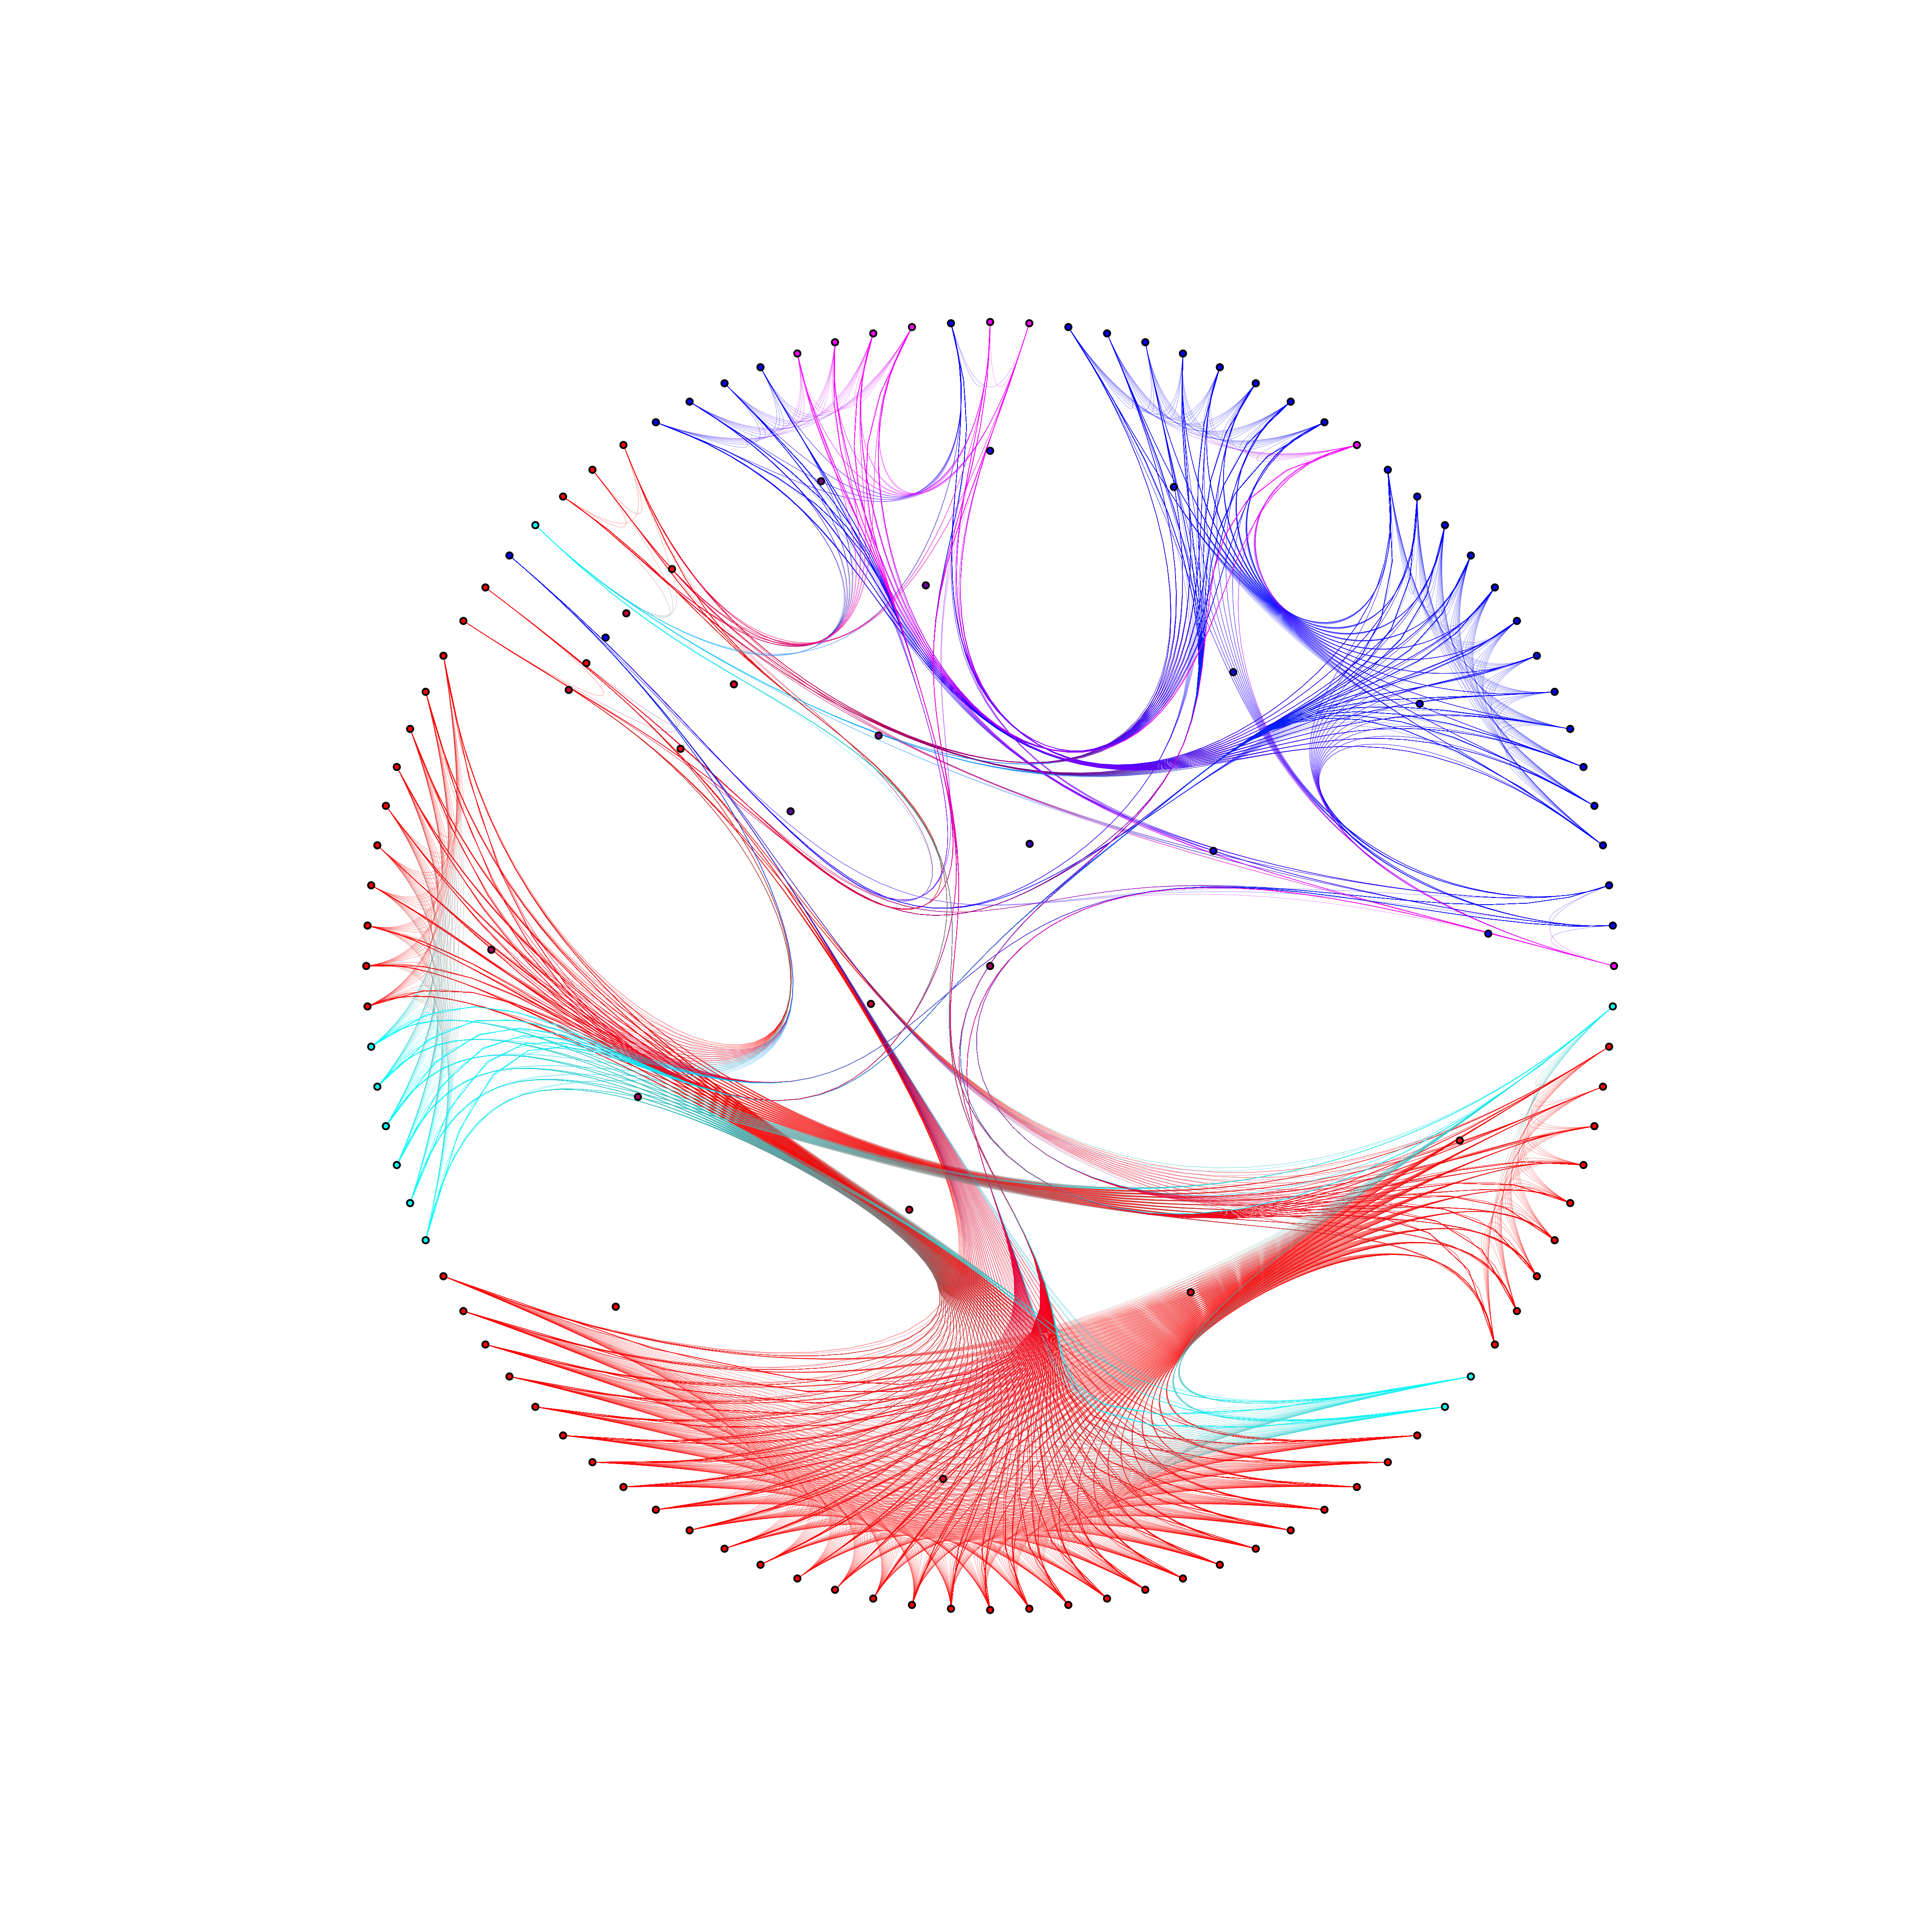
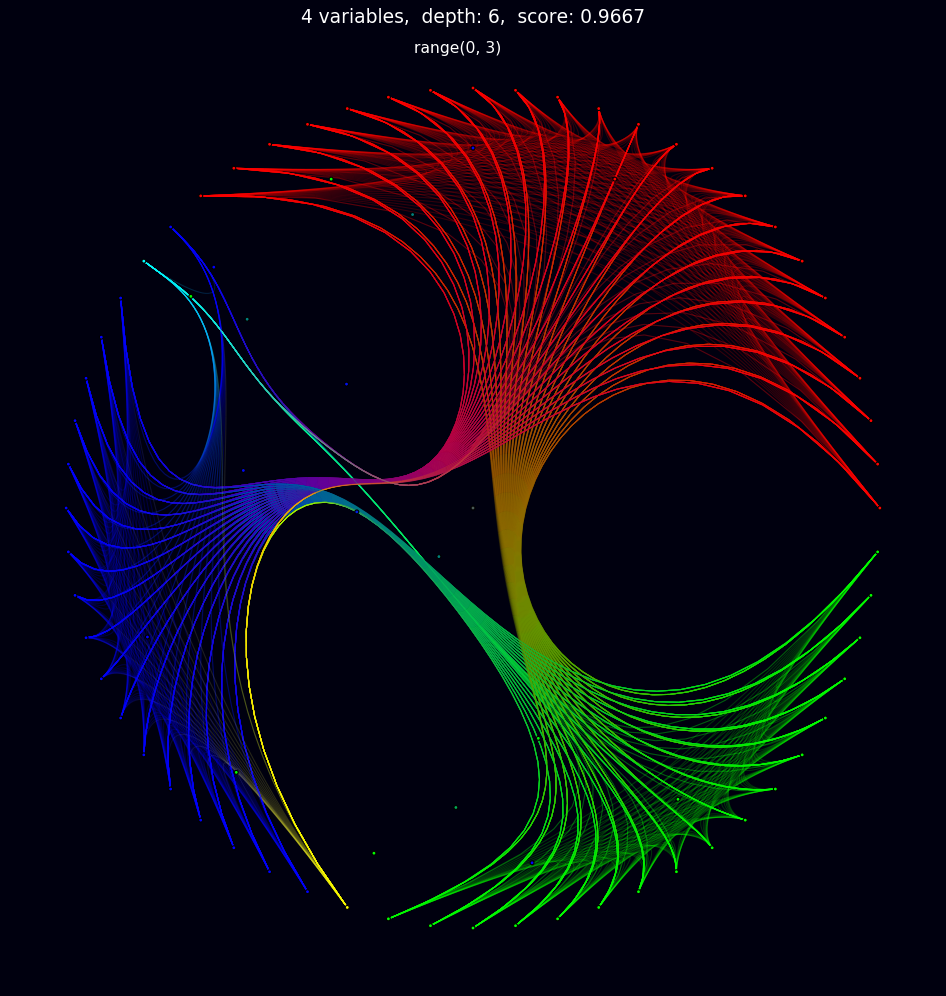
radtree is a tool for visualizing Decision Trees Classifiers as a radial plot.
It uses networkx to create the tree structure and matplotlib to plot.
I would like to thanks Fnord for tem b-spline algorithm.
This is a beta version. Some functionalities need to be improved.
Since it calculates all the possible paths between the points in the dataset, the processing time will increase drastically as the number of samples increase.
By default, it's capped at 100 random samples maximum. To use all the data given, please use num_samples=None.
- Install
radtreewith pip :
pip install git+https://github.com/poctaviano/radtree
Please check the /notebooks folder to view some examples.
%matplotlib inline
from sklearn.model_selection import train_test_split
from sklearn.tree import DecisionTreeClassifier
from sklearn import datasets
random_state = 42

import radtree

X, y = datasets.load_iris(True)
X_train, X_test, y_train, y_test = train_test_split(X, y, test_size=.4, random_state=random_state)
dtree = DecisionTreeClassifier(random_state=random_state)
dtree.fit(X_train, y_train)

radtree.plot_radial(dtree, X=X_test,Y=y_test,
                    smooth_d=8, l_alpha=.2, l_width=1,
                    random_state=random_state,
                   )
To automatically save the plot as a PNG file, you can use save_img=True.
The file will be saved in /plots folder.
 |