A Grafana- (see https://grafana.com/) and PosteSQL-based dashboard to visualize MQTT-XES (see https://github.com/pmcep/mqtt-xes) event streams.
The following screenshot shows how the dashboard looks like:
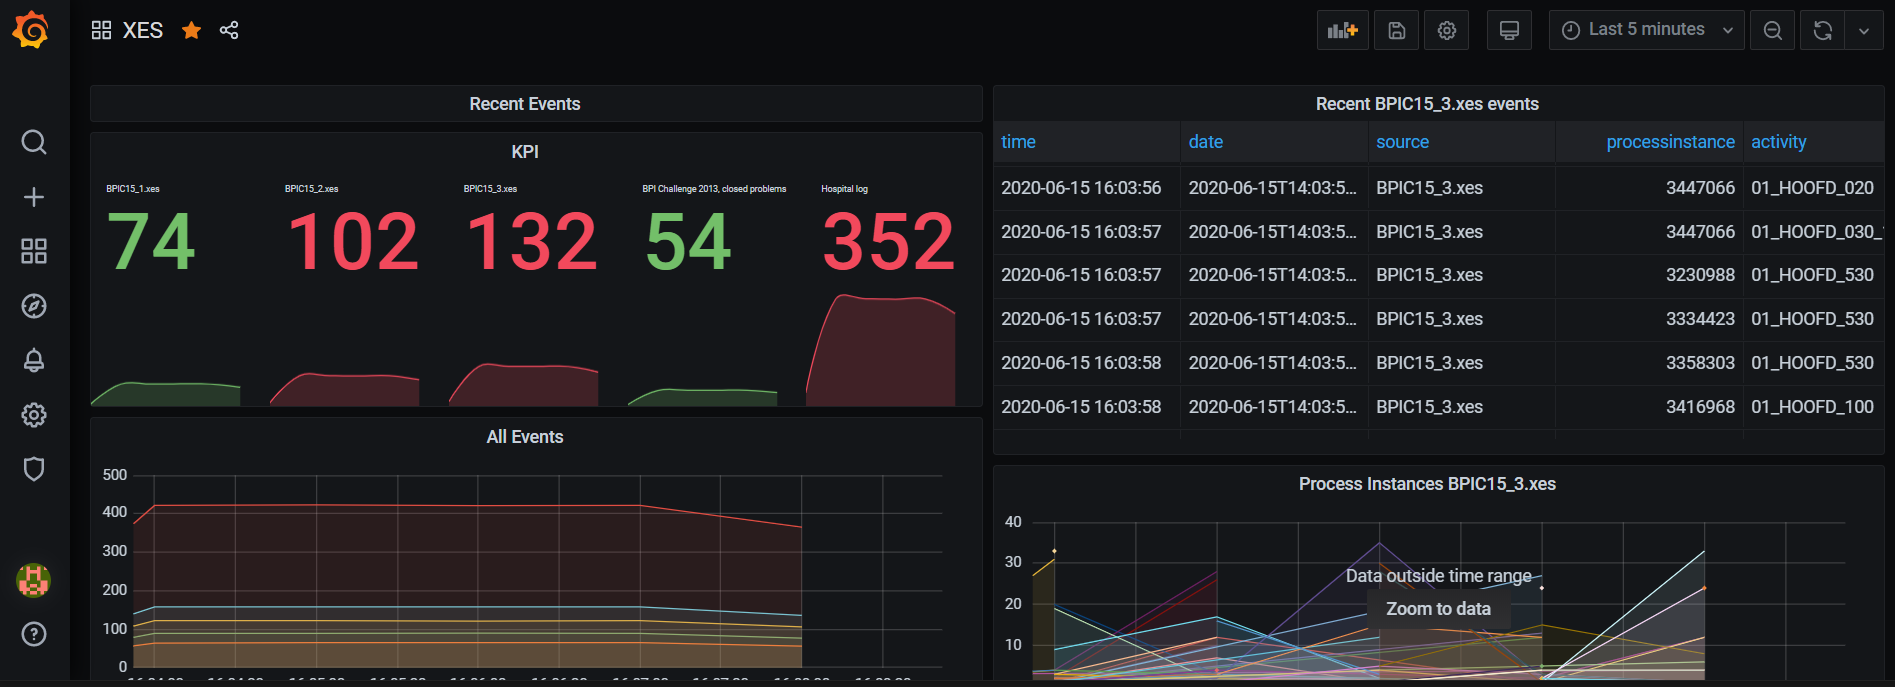
The MQTT event stream is collected and subsequently persisted to the datastore. Grafana allows the visualisation of user defined queries. These queries can also include filter and aggregation operations and thus, the dashboard is capable of displaying a wide variety of metrics of multiple streams in a unified manner. Although the current state of dashboard displays several metrics, it is still a early prototype and has to be understood as a proof of concept.