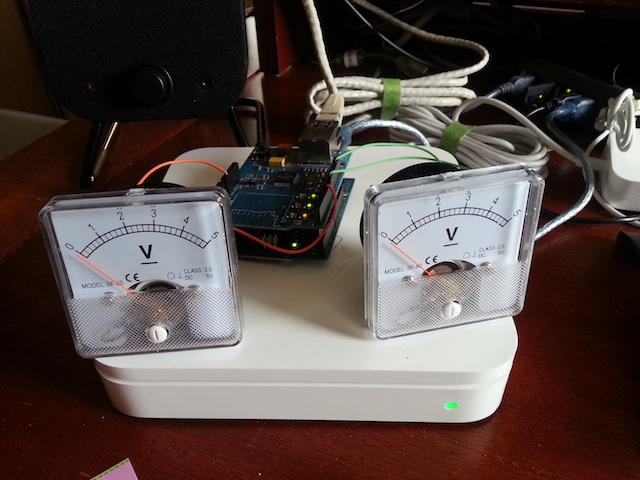
A Python application to read link utilization from a pfSense-based router and display it in the real world with a couple of old-fashioned DC voltmeters. If your downlink is saturated, nothing like seeing the needle pegged to let you know!
I've found that 'ambient information' like this is really helpful. I quite like being able to glance over on my desk and see how busy my network is. You can argue that an X-Y graph would be better, and perhaps so, but something like this that just runs and quietly keeps you in the know suits how I work.
- pfSense-based router. I use a Netgate 2d13 which I can highly recommend.
- An Arduino
- Ethernet shield for Arduino
- The wonderfully simple RESTDuino installed on the Arduino.
- Two 0-5VDC meters, which are the simplest to drive directly from the output pins of the Arduino. I found these on eBay for $9.95 each and have been happy with them.
- Four patch wires.
- Python 2.x, not tested with v3
- The Python Requests library. Which is 100% awesome.
pfSense has a neat SVG-based graph on the home page showing usage:
If you dig into the source code, you'll find repeated calls to
/ifstats.php?if=wan
which returns a single line like this:
1361229172.9342|-614262342|1278023881
A bit of searching finds that its:
timestamp|down_bytes|up_bytes
So the algorithm is
- Login to the router (HTTP POST, using field names extracted from the HTML)
- Get a datapoint
- Wait
- Get another
- Subtract to get delta_t and then divide to get bytes per second.
The meters are driven directly by the analog voltage pins of the Arduino. So, using RESTDuino, we simply have to scale the bytes/second into an integer between 0 and 255. (PWM output). And then call something like this:
http://arduino.phfactor.net/6/122
http://arduino.phfactor.net/9/21
Those two calls will drive the pins. We're leaving a lot of the RESTDuino functionality untouched, but that's OK for this project.
- Connect pin 9 to the uplink meters' plus pin
- Connect ground to the uplink meters' minus pin
- Repeat with pin 6 for the downlink meter.
That's it. No resistors, no components, that's it.
The code relies upon the Arduino being available at a fixed IP address or hostname, so you can setup RESTDuino with either DHCP or a fixed IP address. I don't know if the RESTDuino stack supports a WiFi adapter or not, since the code just does HTTP it should work either way.
Once RESTDuino is up and running, test it out by trying it manually. You can use a browser, curl, wget or similar. E.g.
http://arduino.phfactor.net/6/0
http://arduino.phfactor.net/6/255
The meters should move to position and hold there. Neat!
I've put all of the configuration into
config.ini
to make life simpler. Here's mine, elided a bit:
[arduino]
address=arduino.phfactor.net
pin_up=9
pin_down=6

[router]
username=*YourUsernameHere*
password=*YourPasswordHere*
address=204.128.136.11
if_name=wan
# 5 mbit up
up_max_cps=393216
# 24 mbit down
down_max_cps=3145728
login_refresh_interval=86400

[runtime]
update_delay_sec=0.1
num_pts_average=15
Hopefully those make sense. Experimenting a bit, but 10Hz updates with 15-point averages seems to work pretty well.
./pushpull.py
should suffice. Control-C will stop it and reset the meters to zero.
You could use LEDs instead of meters to save money. No circuit change required, though discerning relative usage would be tricky.
You could monitor other link metrics (jitter, latency, packet loss, breakin attempts, etc, etc) instead of link usage. The RESTDuino can display more output channels, so adding on is quite possible.
You could probably use a Raspberry Pi and DAC, and run the entire thing on a single board. I had Arduino on-hand, but might try my RPi next.
If you have a different router, you need to find a way to get link metrics off of it. SNMP, NetFlow, screen scraping, lots of methods.