Uses Deep Convolutional Neural Networks (CNNs) to model the stock market using technical analysis. Predicts the future trend of stock selections.
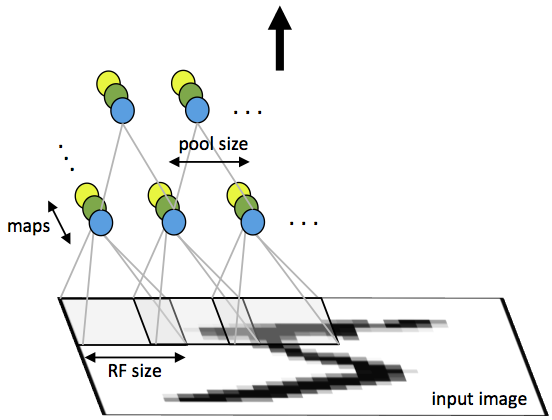
Convolutional neural networks are designed to recognize complex patterns and features in images. It works by dividing an image up into multiple overlapping perceptive fields and running a myriad of trainable filters through them, capturing basic features and patterns. This process is repeated several times, and as the filtered image is ran through more filters, deeper and more meaningful features are extracted and quantified. For example, to recognize an image of a car we might have several filters that are sensitive to wheels, or windows, or exhaust pipes, or licence plates... and all of the results of these filters are gathered and quantified into a final classifier.
OK, that's great, but how does this tie in to stock analysis? Here we introduce the study of technical analysis. I'll let Investopedia's words describe it: "Technical analysis is a trading tool employed to evaluate securities and attempt to forecast their future movement by analyzing statistics gathered from trading activity, such as price movement and volume. Unlike fundamental analysts who attempt to evaluate a security's intrinsic value, technical analysts focus on charts of price movement and various analytical tools to evaluate a security's strength or weakness and forecast future price changes." In other words, technical analysis focuses on the movement patterns and trading behaviors of stock selections to pinpoint a stock's future trend. Wait a minute, if technical analysis works by analysing the movement patterns of stocks, we can use CNN to model this analytical technique!
For example, we would have some filters that are sensitive to shortterm uptrends, and they will be combined by fully connected layers to be sensitive to longterm uptrends. The same goes for some complex patterns such as shortterm floats, or an overall downward trend capture.
As previously mentioned, CNN works by stacking several filters on top of each other to form complex feature-sensitive filters; if we were to treat stock data as images, we can apply CNN to it and extract useful and deep information. How do we go about this?
Instead of convolving a 2D image, we convolved a 1D image, since stock data is linear and is represented as an 1D tensor.
def conv1d(input, output_dim,
           conv_w=9, conv_s=2,
           padding="SAME", name="conv1d",
           stddev=0.02, bias=False):
  with tf.variable_scope(name):
    w = tf.get_variable('w', [conv_w, input.get_shape().as_list()[-1], output_dim],
      initializer=tf.truncated_normal_initializer(stddev=stddev))
    c = tf.nn.conv1d(input, w, conv_s, padding=padding)

    if bias:
      b = tf.get_variable('b', [output_dim], initializer=tf.constant_initializer(0.0))
      return c + b

    return c
Also, the input images is in the shape [batch_size, 128, 5], the moving-window (the length of data we will be looking at in one batch) the five channels being [Open, High, Low, Close, Volume], all information I deemed important for technical analysis.
After several convolutional layers and batchnorms later, we arrive at a tensor sized [batch_size, 2, 1024], which we then run through several softmax layers and finally a sigmoid activation to result in a tensor sized [batch_size, 2], with two values, one representing the bullish confidence, and the other one the bearish confidence.
| Name | Link |
|---|---|
| Historical Data | https://quantquote.com/historical-stock-data |
| Description of Technical Analysis | http://www.investopedia.com/terms/t/technicalanalysis.asp |
| Berkeley paper on ANN-based analysis | http://www.cs.berkeley.edu/~akar/IITK_website/EE671/report_stock.pdf |
19991118,0,42.2076,46.382,37.4581,39.1928,43981812.87
| Date | Time | Open | High | Low | Close | Volume |
|---|---|---|---|---|---|---|
| 19991118 | 0 | 42.2076 | 46.382 | 37.4581 | 39.1928 | 43981812.87 |
The trained model is proprietary, but you are absolutely welcome to train your own using my code.
You must have python 3.5+ and tensorflow installed, tensorflow-gpu highly recommended as the training requires a lot of computational power.
pip install tensorflow-gpu
git clone https://github.com/philipxjm/Convolutional-Neural-Stock-Market-Technical-Analyser.git
cd Convolutional-Neural-Stock-Market-Technical-Analyser
python stock_model.py
Of course, you have to tinker with the hyper parameters, archeteture of the encoder, and the dataset setup if you want to achieve good results. Good luck and make some money.