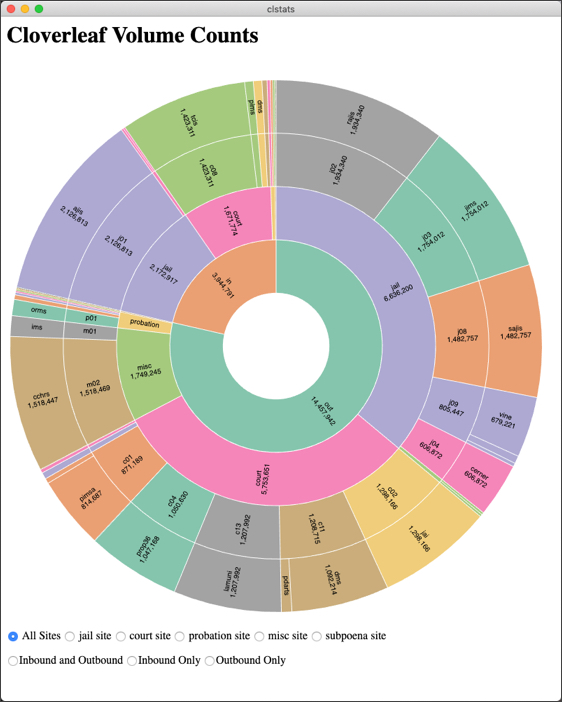
This repository holds scripts used to visualize traffic volume through the Cloverleaf integration broker that facilitates much of PIX.
The data passes through several stages before visualization.
-
The daily counts for Cloverleaf nodes are collected each night by a maintenance script just before these counts are reset for the next day. The
hcimsiutilcommand is used to fetch these counts. -
The output from
hcimsiutilis semi-structured text that must be parsed to extract the desired counts. The nightly maintenance script does this by piping thehcimsiutiloutput through anawkscript, which emits a single record with a timestamp, node name, and the daily count. This single-line record is appended to a file named/cis/local/log/traffic_YYYY-MM.txt, whereYYYYandMMare the current year and month, respectively. A new file is started each month. Sample content is shown below.
2019-07-01 23:37:58 cchrs_misc_dest_out_p02 429
2019-07-01 23:37:58 dash_jail_dest_out_p02 853
2019-07-01 23:37:58 doj_probation_out_p02 742
2019-07-01 23:37:58 linx_jail_dest_out_p02 853
2019-07-01 23:37:58 jaims_probation_out_p03 0
-
The traffic file (from Step #2) is processed by a Python/Pandas script
monthlySummary.pyto aggregate the counts to a montly summary. Here is an invocation example.python monthlySummary traffic_2019-07.txtThis creates a new file with a
.jsonextension:traffic_2019-07.json. -
The Electron application reads the JSON flat file and creates treemaps and sunbursts.
