Compute segmented least squares for a dataset. Probably assumes that X = 1...N or something.
$ seglines 10 data.csv --plot
opt = 70.19
segment  1:   0 (1.330)      13 (13.880)    f(x) = 1.009·x + 1.693
segment  2:  14 (1.340)      27 (14.190)    f(x) = 0.997·x + -11.887
segment  3:  28 (3.350)      41 (15.760)    f(x) = 0.987·x + -25.083
segment  4:  42 (3.420)      55 (17.630)    f(x) = 0.991·x + -37.058
segment  5:  56 (5.160)      69 (18.600)    f(x) = 0.949·x + -46.523
segment  6:  70 (3.870)      83 (17.660)    f(x) = 0.973·x + -63.211
segment  7:  84 (5.930)      97 (17.490)    f(x) = 0.977·x + -76.830
segment  8:  98 (5.210)     111 (17.590)    f(x) = 0.897·x + -82.366
segment  9: 112 (3.810)     125 (16.410)    f(x) = 0.963·x + -102.544
segment 10: 126 (16.780)    139 (3.190)     f(x) = -1.036·x + 147.696
pip install seglines
Depends only on numpy. When using --plot, we also need matplotlib.
There is a --help option: seglines --help
Use seglines L data.csv where L is the number of segments you want to segmentize into.
In case you want to generate an L-segmented linear dataset, use
seglines --generate 5 10 > data.csv
and then
seglines 5 data.csv
This will output the segments, e.g.
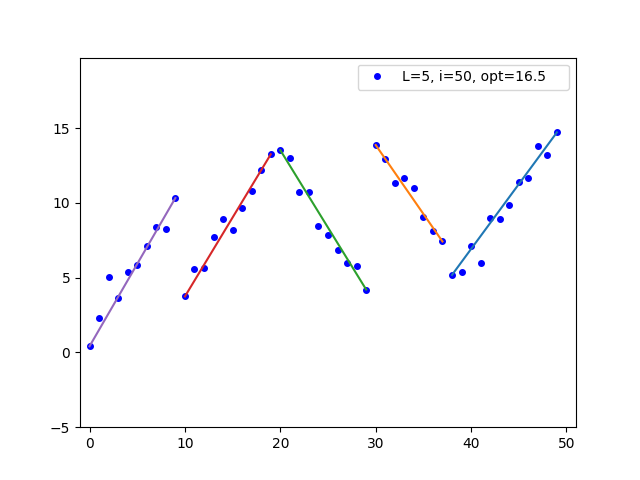
opt = 16.49
segment  1:  0 (0.410)      9 (10.330)    f(x) = 0.961·x + 1.355
segment  2: 10 (3.750)     19 (13.260)    f(x) = 0.987·x + -5.741
segment  3: 20 (13.530)    29 (4.210)     f(x) = -1.031·x + 33.960
segment  4: 30 (13.880)    37 (7.420)     f(x) = -0.913·x + 41.254
segment  5: 38 (5.190)     49 (14.720)    f(x) = 0.904·x + -29.629
To create a plot of the dataset, add --plot:
seglines 5 data.csv --plot