This git repository contains data files, Python code, and Python and R Jupyter notebooks which can be used to reproduce figures and analyses from the paper "The Profiles of Bars in Barred Galaxies" (Erwin, Debattista, & Anderson 2023, Monthly Notices of the Royal Astronomical Society, 524: 3166; arXiv:2306.15739).
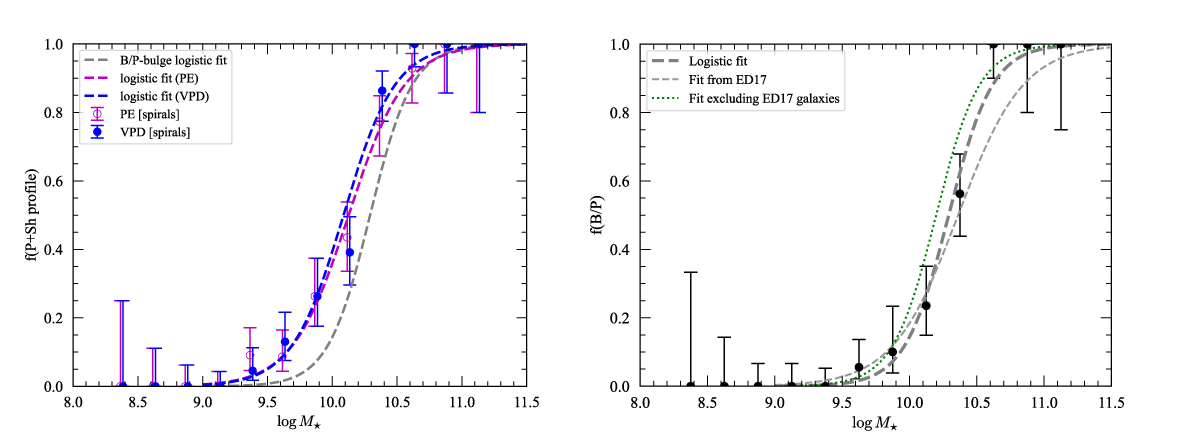
Logistic fits for Peak+Shoulders bar profiles (left) and B/P-bulge presence (right) for barred spirals, versus galaxy stellar mass.
The full set of Spitzer 3.6-micron images for the sample galaxies can be found
at, e.g., the NASA Extragalactic Database; to
make it easier to reproduce Figure 1 of the paper, we include sky-subtracted
versions of these images for three of the galaxies in the data/images folder.
The Python code and notebooks require the following external Python modules and packages,
all of which are available on PyPI and can be installed via pip:
There are two Jupyter notebooks:
-
barprofiles_figures_for_paper.ipynb-- Python notebook; generates the figures for the paper -
barprofiles_R_logistic-regression.ipynb-- R notebook; computes logistic regressions
angle_utils.py,barprofile_utils.py,plotutils.py-- miscellaneous utility functions (including statistics).
-
Download this repository.
-
Edit paths in the notebooks so they point to the correct locations, if necessary. See notes in the initial cells of the notebooks; the main variable you will probably need to edit is
plotDirin the second cell ofbarprofiles_figures_for_paper.ipynb, which is where saved PDF figures should go. Also make sure to setsavePlots = Trueif you want the PDF files to actually be generated (the default isFalse, which means the figures will appear in the notebook but won't be saved to disk). -
Optionally: Run the notebook
barprofiles_R_logistic-regression.ipynbto generate and save the various logistic fits. This is "optional" in that the output files already exist in this directory (they will be overwritten if the notebook is run). -
Run the notebook
barprofiles_figures_for_paper.ipynbto generate the figures (it will read the coefficients of the fits from the file generated by running the previous notebook).
Code in this repository is released under the BSD 3-clause license.

Text and figures are licensed under a Creative Commons Attribution 4.0 International License.
