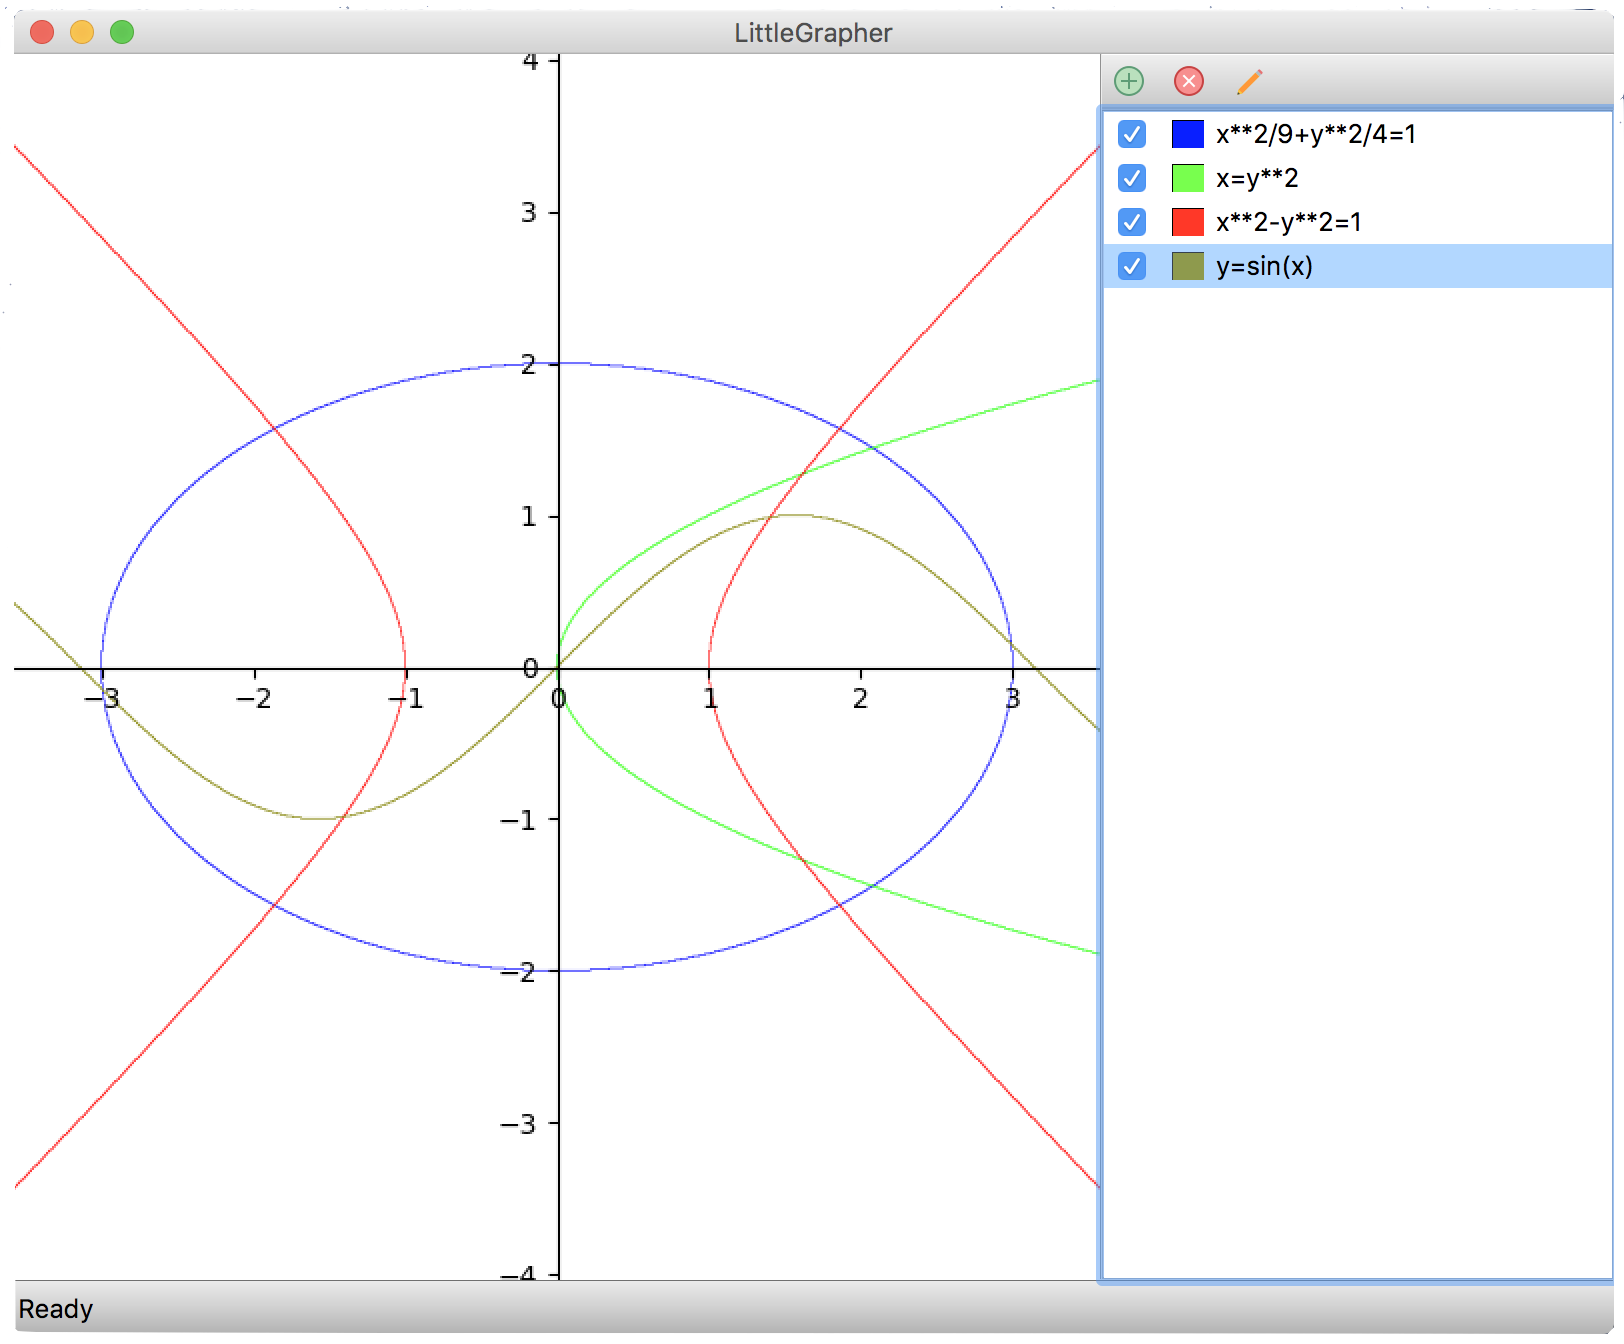
LittleGrapher is a lightweight application for plotting figures of mathematical functions and equations. LittleGrapher was written in Python3 with PyQt5 framework and SymPy library, and is open-source released on GitHub. LittleGrapher is able to plot figures of various mathematical functions and equations, including implicit functions and plane curves. With powerful symbolic mathematics library SymPy, LittleGrapher works efficiently and accurately. Also, PyQt5 framework helps LittleGrapher create handy user interfaces available for Windows, MacOS and Linux.
LittleGrapher is an open-source project released on Github community, thus, we encourage developers interested in this project to help us improve LittleGrapher. We would appreciate your suggestions and implementation code. Contact us to let us know your ideas.
LittleGrapher has released executables for Windows and MacOSX on GitHub, check the release directory and download the .zip installation package according to your operating system.
If you are using Windows, uncompress the .zip installation package, move LittleGrapher.exe to a proper folder(e.g. C:/Program Files/LittleGrapher), and make a shortcut to the executable on the desktop. Then you can launch LittleGrapher by double-clicking the icon on the desktop.
If you are using MacOSX, uncompress the .zip installation package and simply drag LittleGrapher.app into your Application directory to install LittleGrapher.
LittleGrapher is an open-source application written in Python3, thus, to run LittleGrapher, you have to ensure that you have installed Python3 on your computer first.
Check here to download and install Python3.
After you install Python3, you may need to install the third-party dependencies. Python3 provides pip3 tool to help you install and manage your site-packages. Also see: https://docs.python.org/3/installing/index.html
First you need to install PyQt5 on your computer. Input the following command into your terminal:
pip3 install PyQt5
Then you need to install SymPy on your computer. Input the following command into your terminal:
pip3 install sympy
Since SymPy depends on Matplotlib library, you may need to install Matplotlib afterward by the following command:
pip3 install matplotlib
After installing all the dependencies, you can clone LittleGrapher to your local by the following command:
git clone git@github.com:peihaowang/LittleGrapher.git
Then cd to the cloned directory on your local, and run LittleGrapher like this:
python3 main.py
You can put an & at the end to put LittleGrapher working on the backend like this:
python3 main.py &
After launching LittleGrapher successfully, you can plot with LittleGrapher. You can add mathematical functions or equations through the button in the right sidebar, and also you are allowed to hide, delete or edit added expressions. LittleGrapher will start to plot figures as soon as you submit the new expression.
Note that, the plotting process takes time to do a large amount of computation, you may not get the figures immediately. But the user interface won't stop responding, since LittleGrapher handles plotting in other threads.
In addition, LittleGrapher allows users to change the line color of figures, which helps users to distinguish different curves of functions or equations.
LittleGrapher allows users to zoom in/out and shift figures of mathematics functions and curves, users can use keyboard to zoom in/out to show/hide details of figures and shift the position of curves to show their different parts, according to the following list:
| Button | Action |
|---|---|
| =/+ | Zoom in |
| -/_ | Zoom out |
| Left | Shift left |
| Right | Shift right |
| Up | Shift up |
| Down | Shift down |
| Ctrl+0 | Center and restore |
LittleGrapher provides a menu button [Save As ...] to let users save expressions as lists or export plotted figures as images. Please note that, the extension of the saved expression list is .exli and the content is saved as text.
After saving expressions as lists, you can import them to LittleGrapher again by choosing [Open ...] menu button. You can also select plain text files(e.g. .txt).
Email to us for bug report and technical support.
