Authors: Peder Norr
Real estate continues to be one of the most lucrative and secure investment vehicles available. This proposal contains an analysis of Minnesota home value time series data in order to provide a real estate investment firm the identification of the best locations to invest in Minnesota. Initial analysis of the data shows that there are 5 zip codes that provide the biggest opportunity for return on investment. The real estate investment firm can use this analysis to make their entry in the Minnesotan market more effective and profitable.
Due to the booming housing market in the state, a real estate investment firm has decided to invest in property in Minnesota. However, they are unfamiliar with the state. They want to identify the top 5 best zip codes in the state in which to invest. This proposal will identify the top 5 zip codes for investment by calculating the potential return on investment after 24 months.
The data used in this analysis come from Zillow Research which aggregates housing data. The data set contains 6 variables describing property sale including zip code, city, state, metro area, size rank It includes 14,723 individual entries recorded daily from 1996-2018.
In this analysis, I create and iterate through several SARIMA models for each zip code time series to create forecasts of future home values. With those forecasted values, I calculated potential future ROI of investing in each zip code. To reduce computation time, I first identified the top 11 zip codes with the highest historical ROI from 2010-2018 and made forecasts for each. I improved my model's iterations by adjusting parameters and differencing the data. This was done in an attempt to increase the accuracy of the model's forecasts.
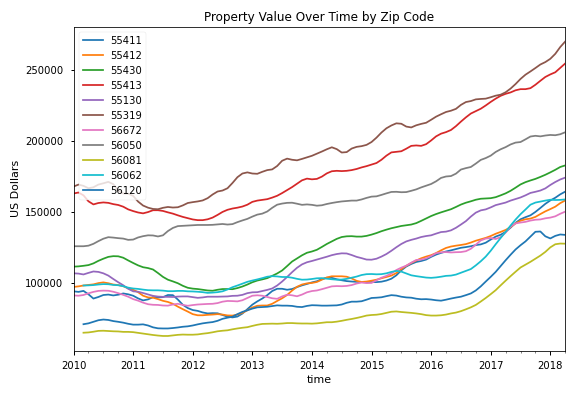
The figure above shows home value by zipcode over time
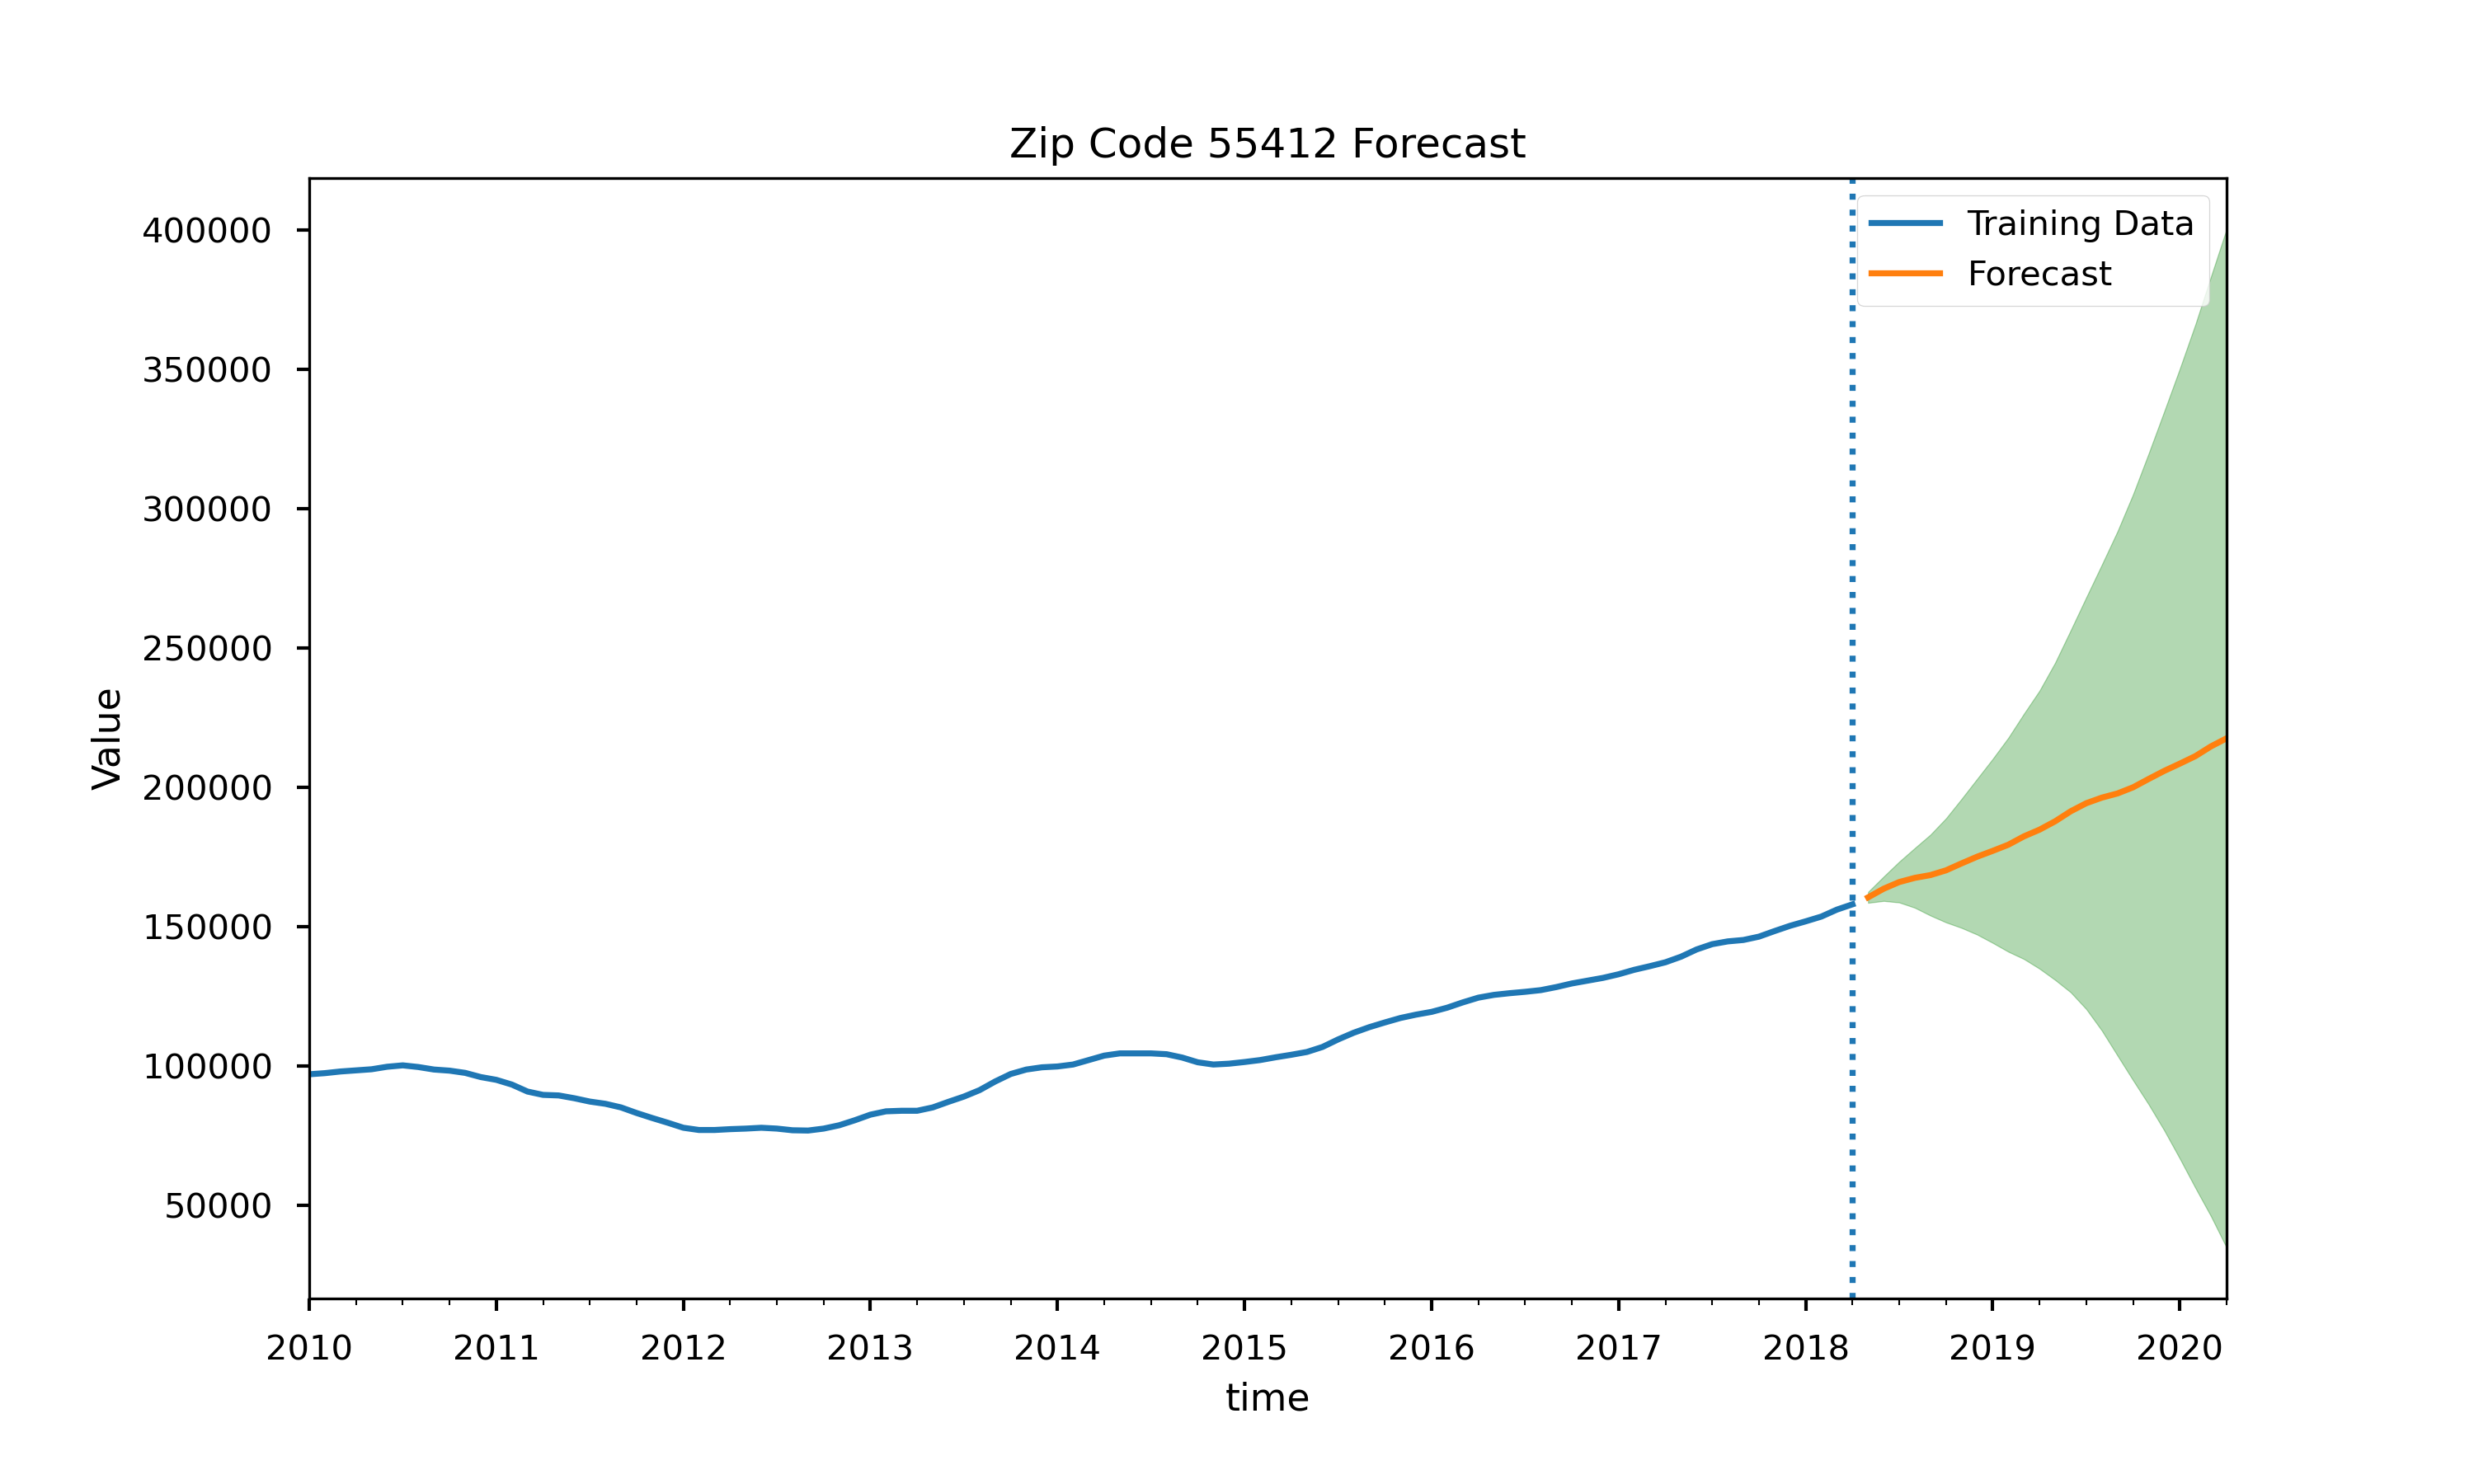
Zip Code 55412: 35.6% 24 month ROI
The figure above shows 24 month home value forecast and confidence interval
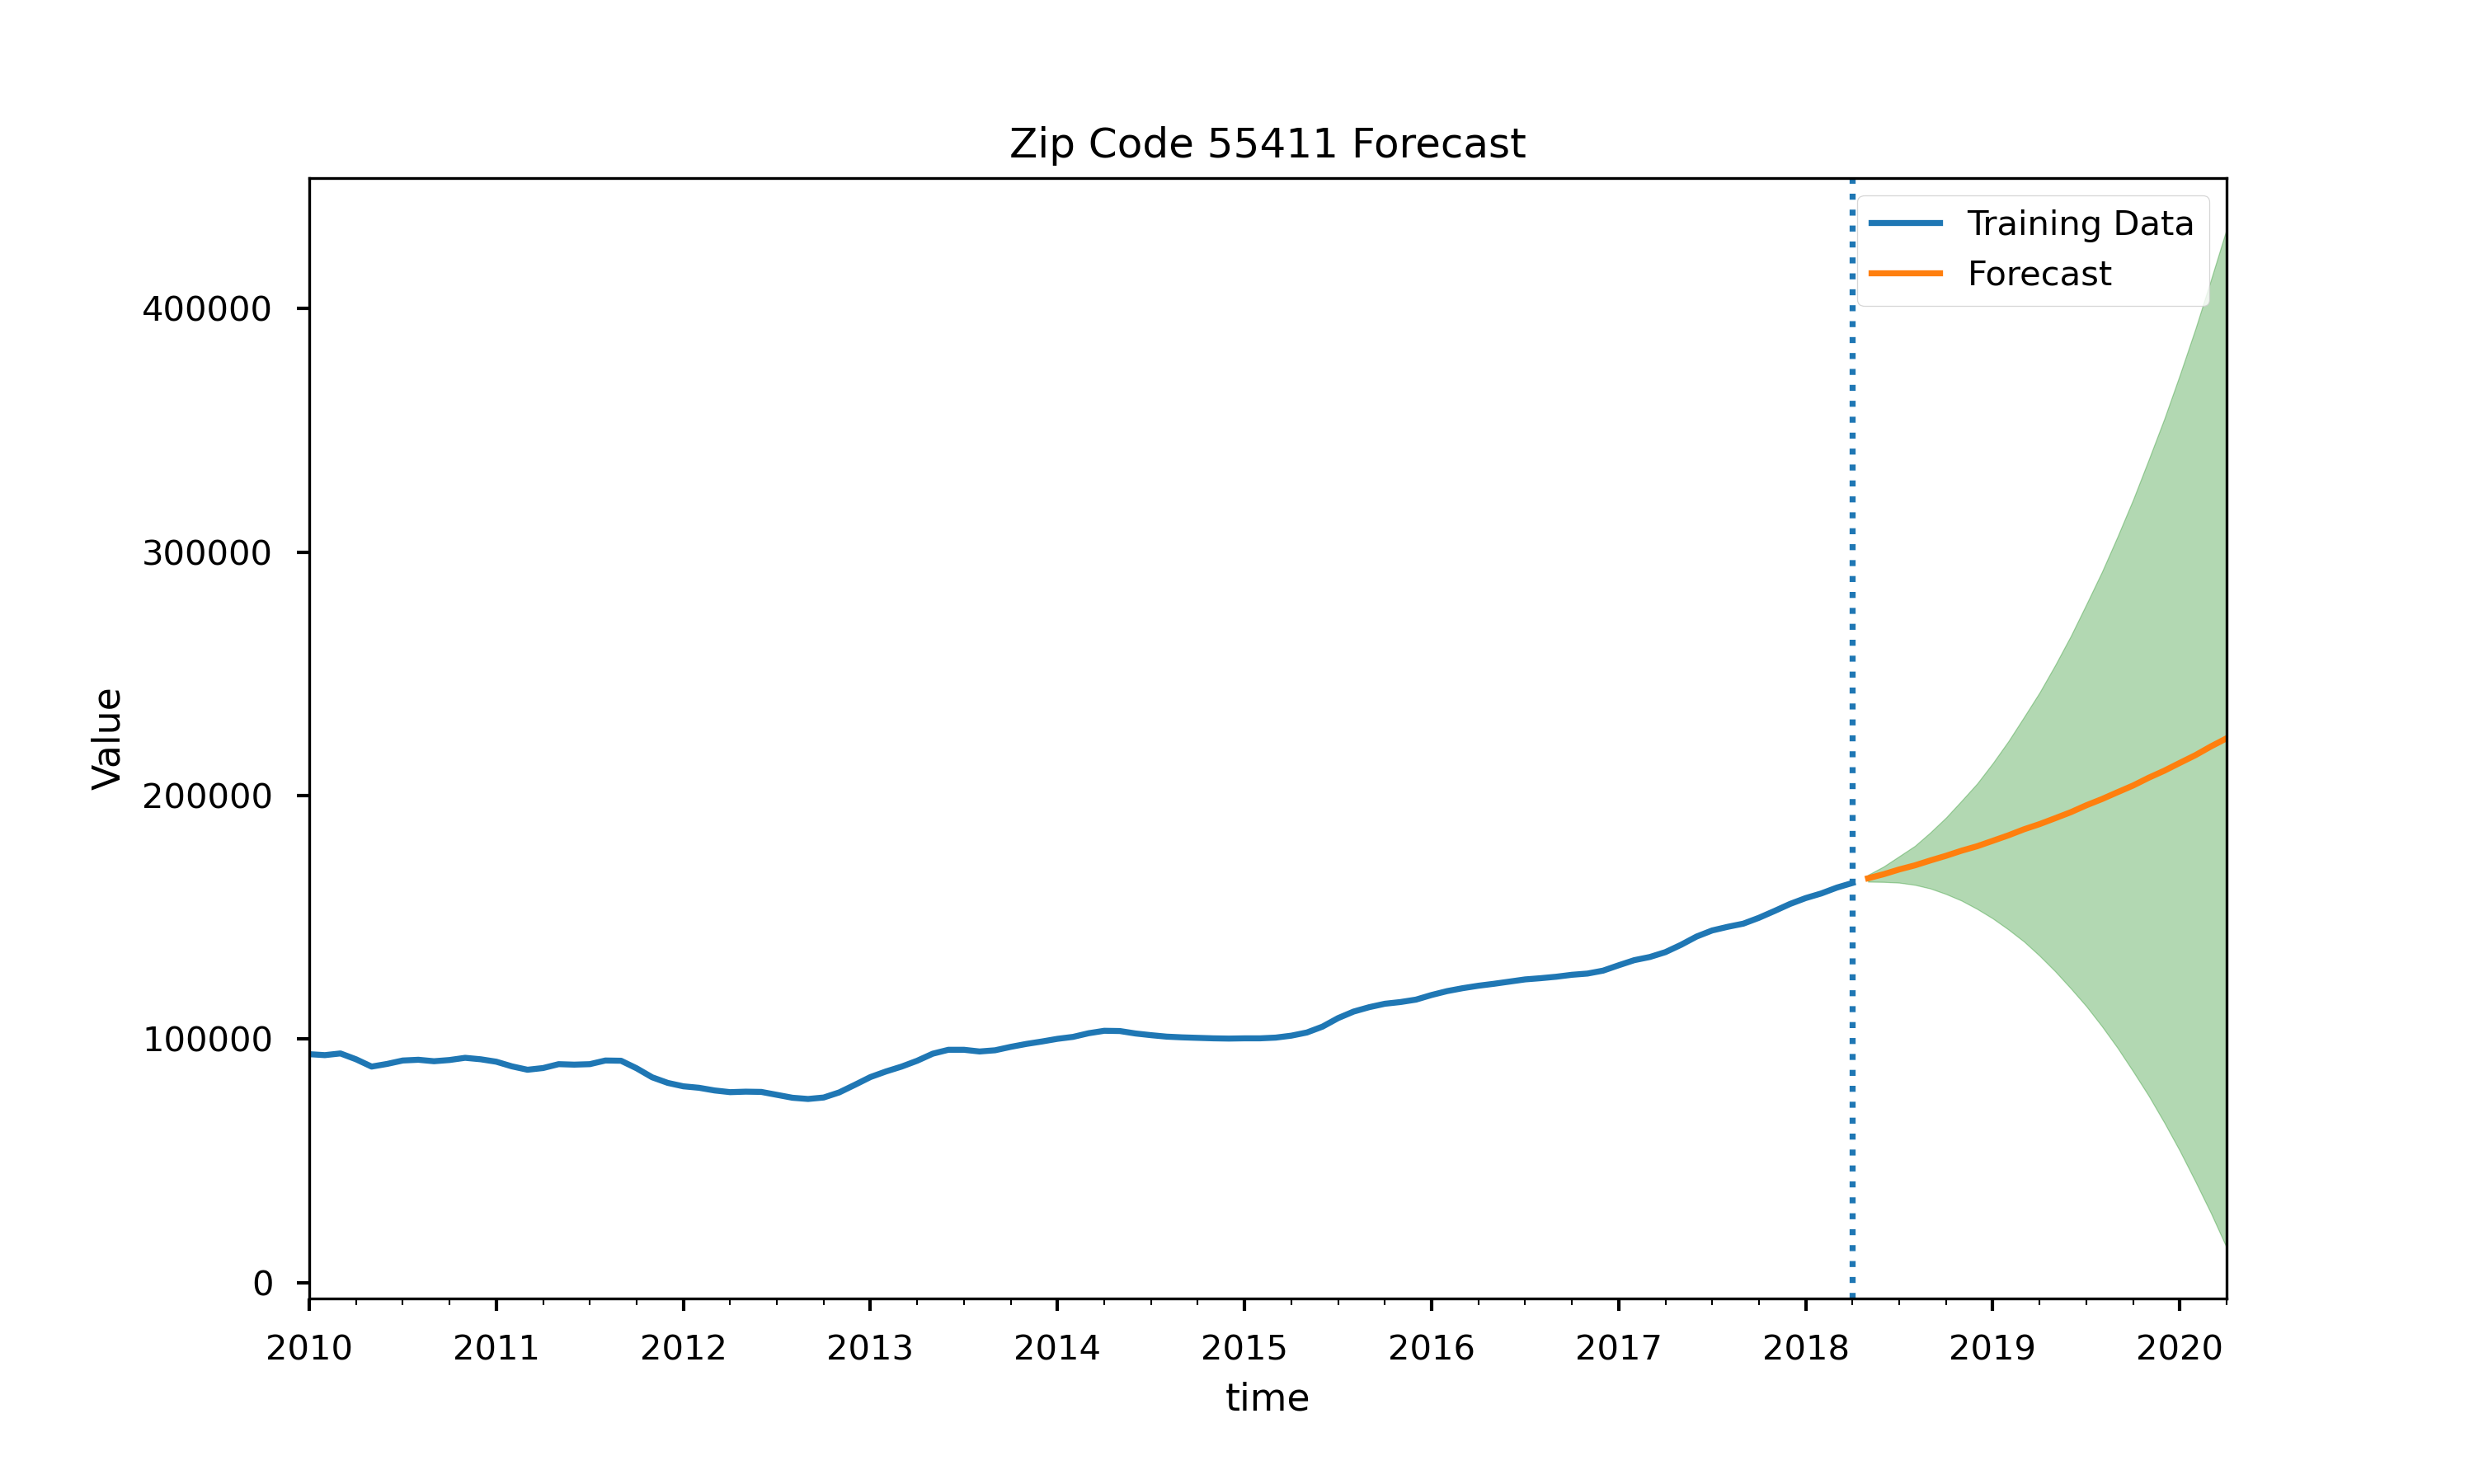
Zip Code 55411: 34.6% 24 month ROI
The figure above shows 24 month home value forecast and confidence interval
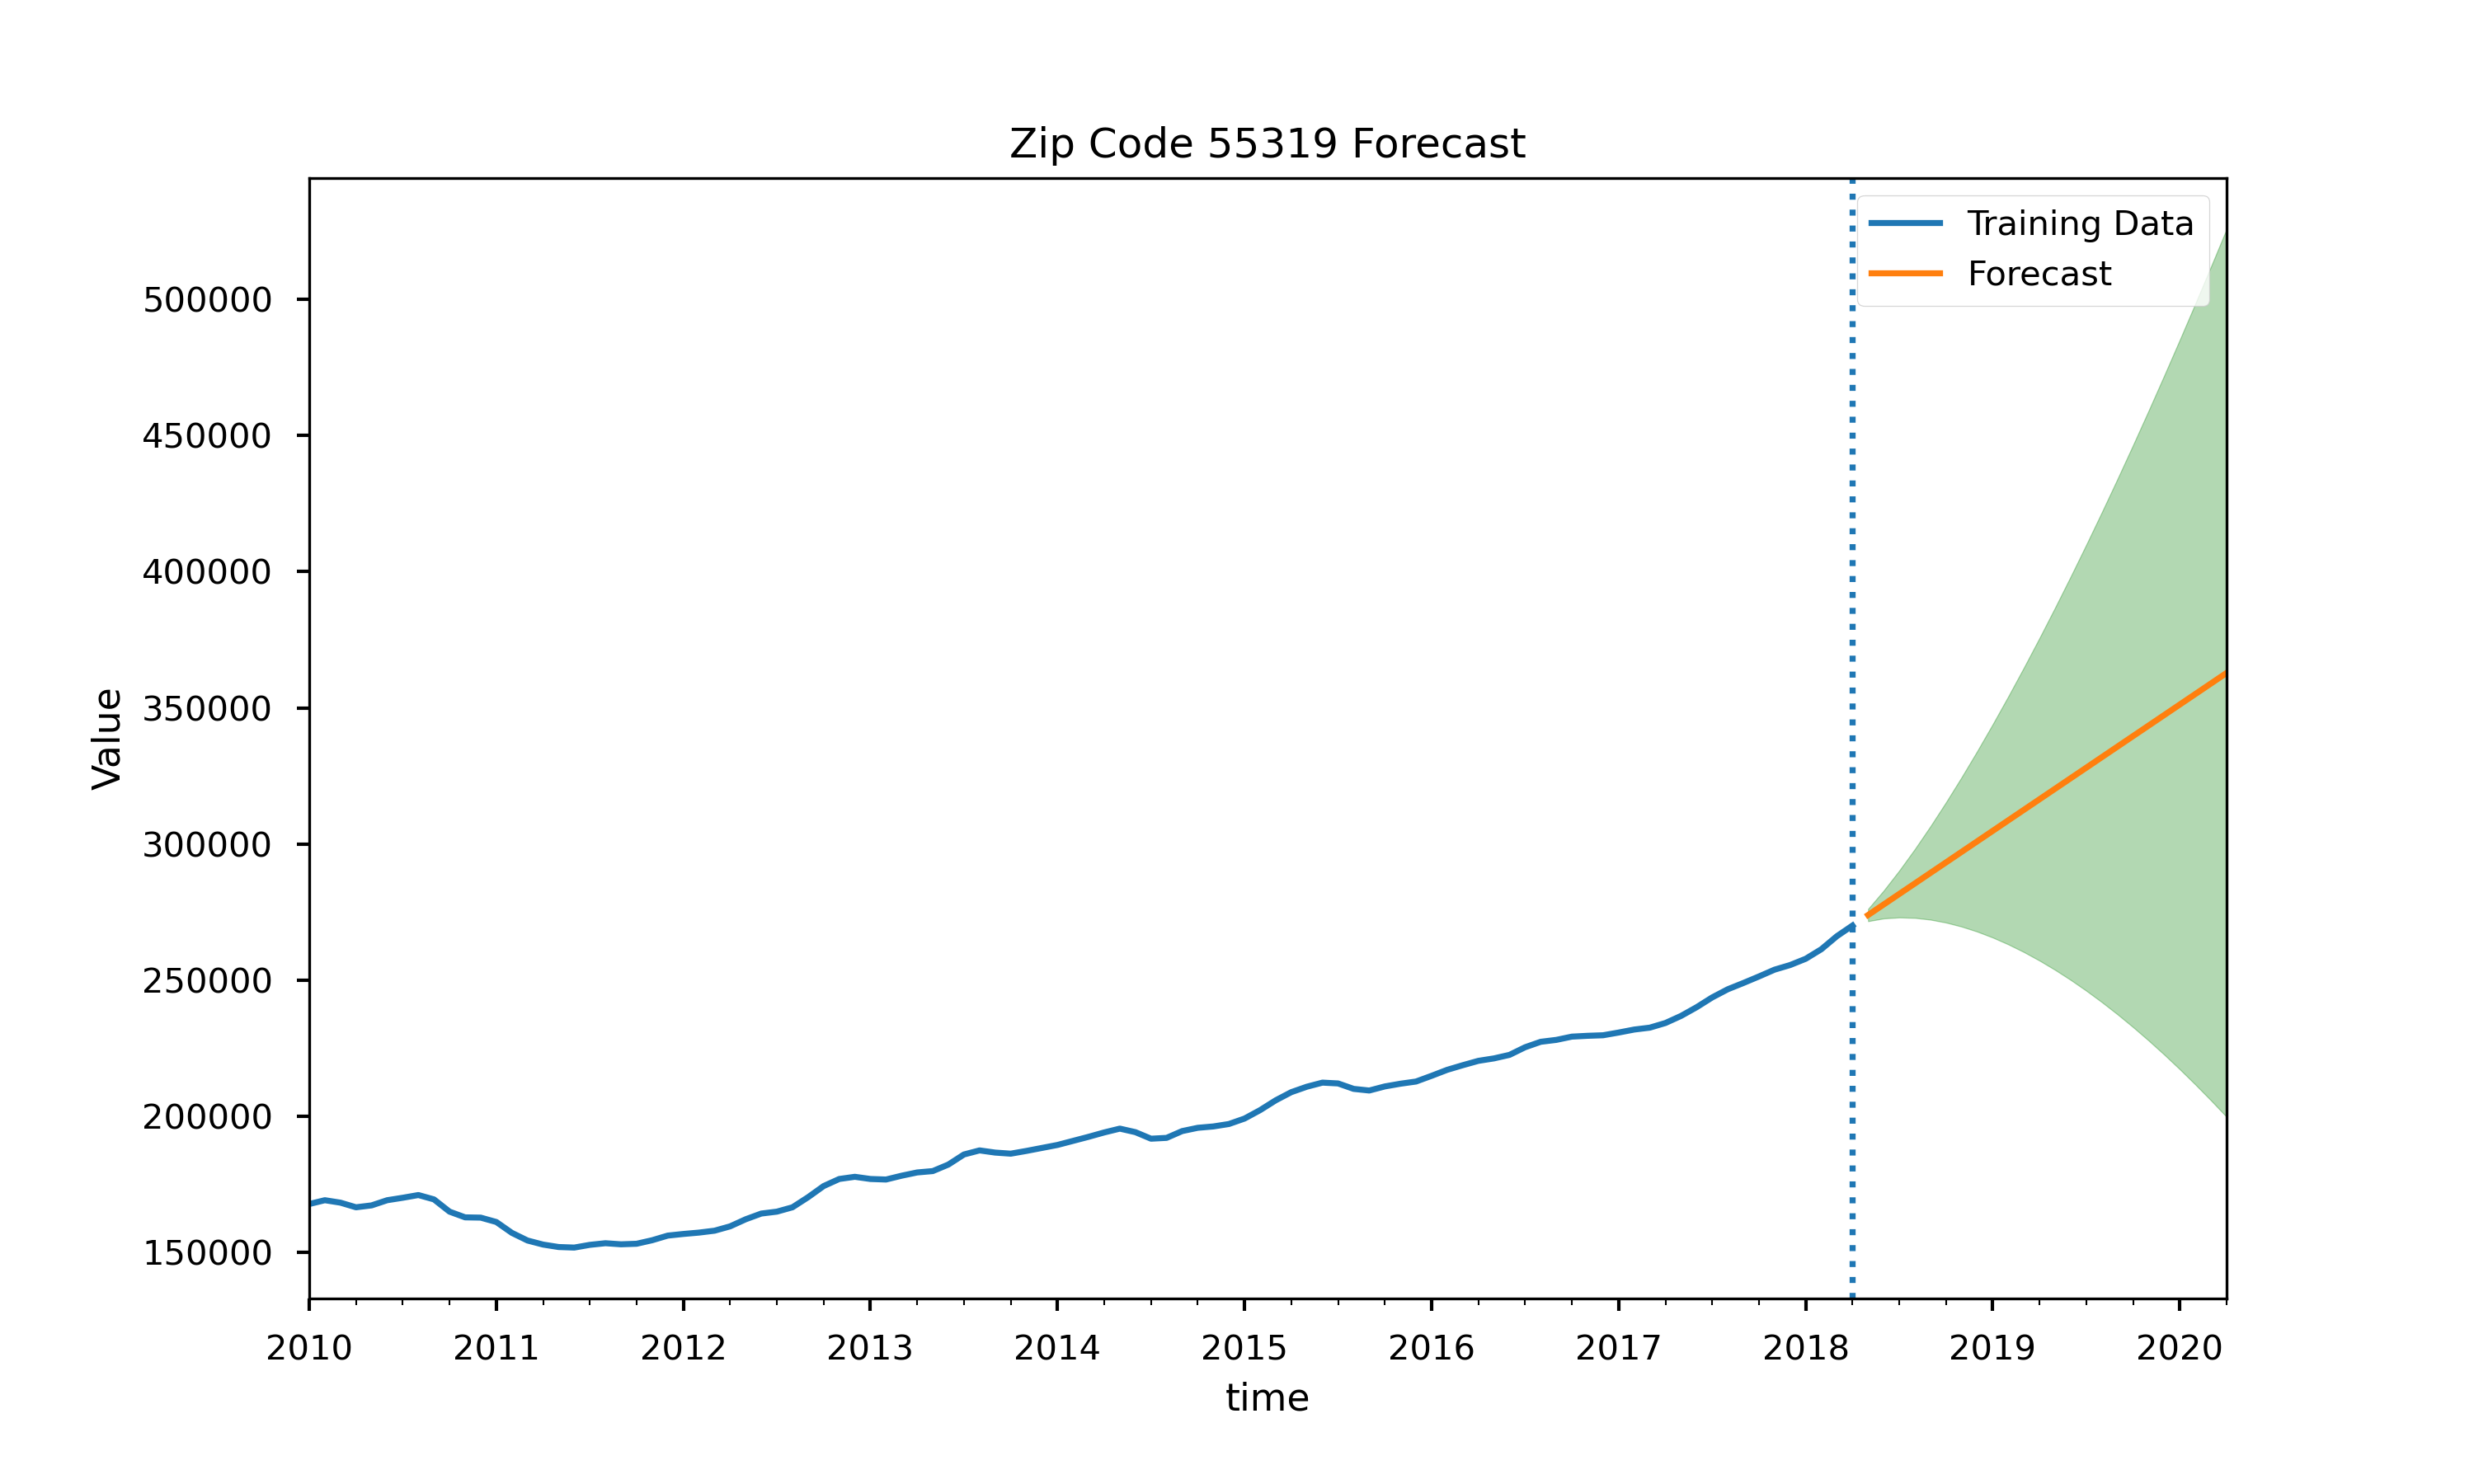
Zip Code 55319: 32.4% 24 month ROI
The figure above shows 24 month home value forecast and confidence interval
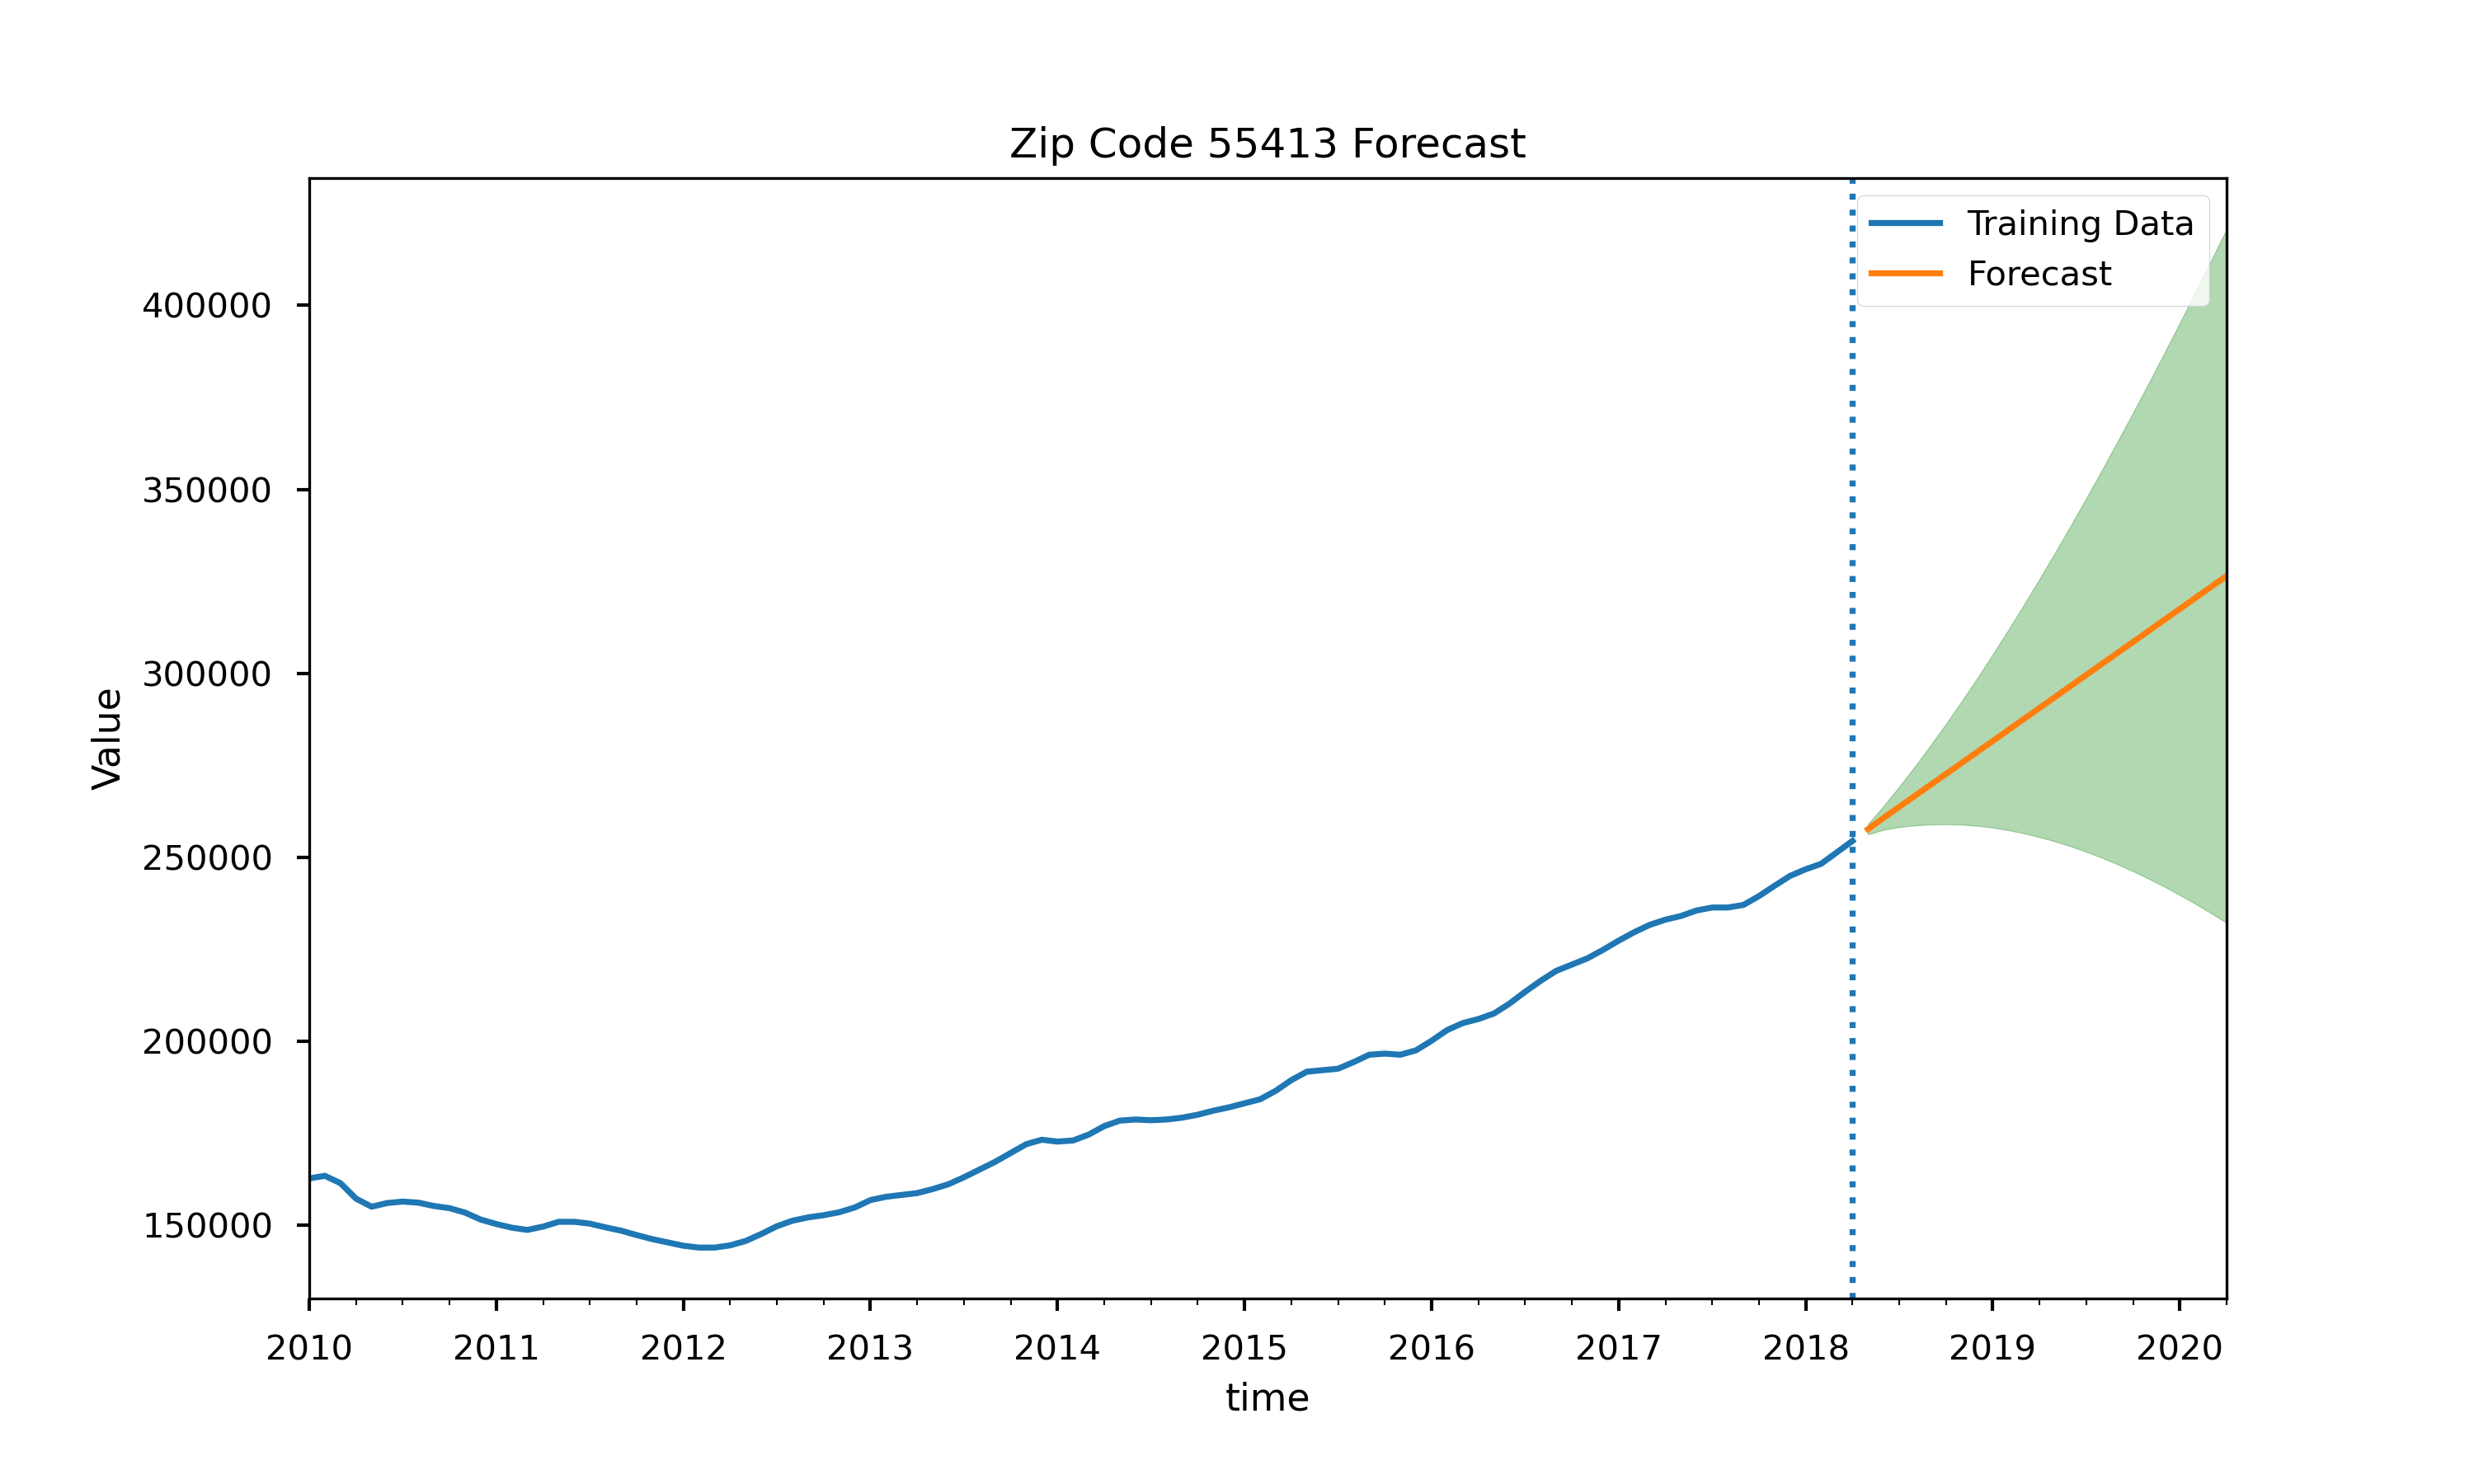
Zip Code 55413: 26.7% 24 month ROI
The figure above shows 24 month home value forecast and confidence interval
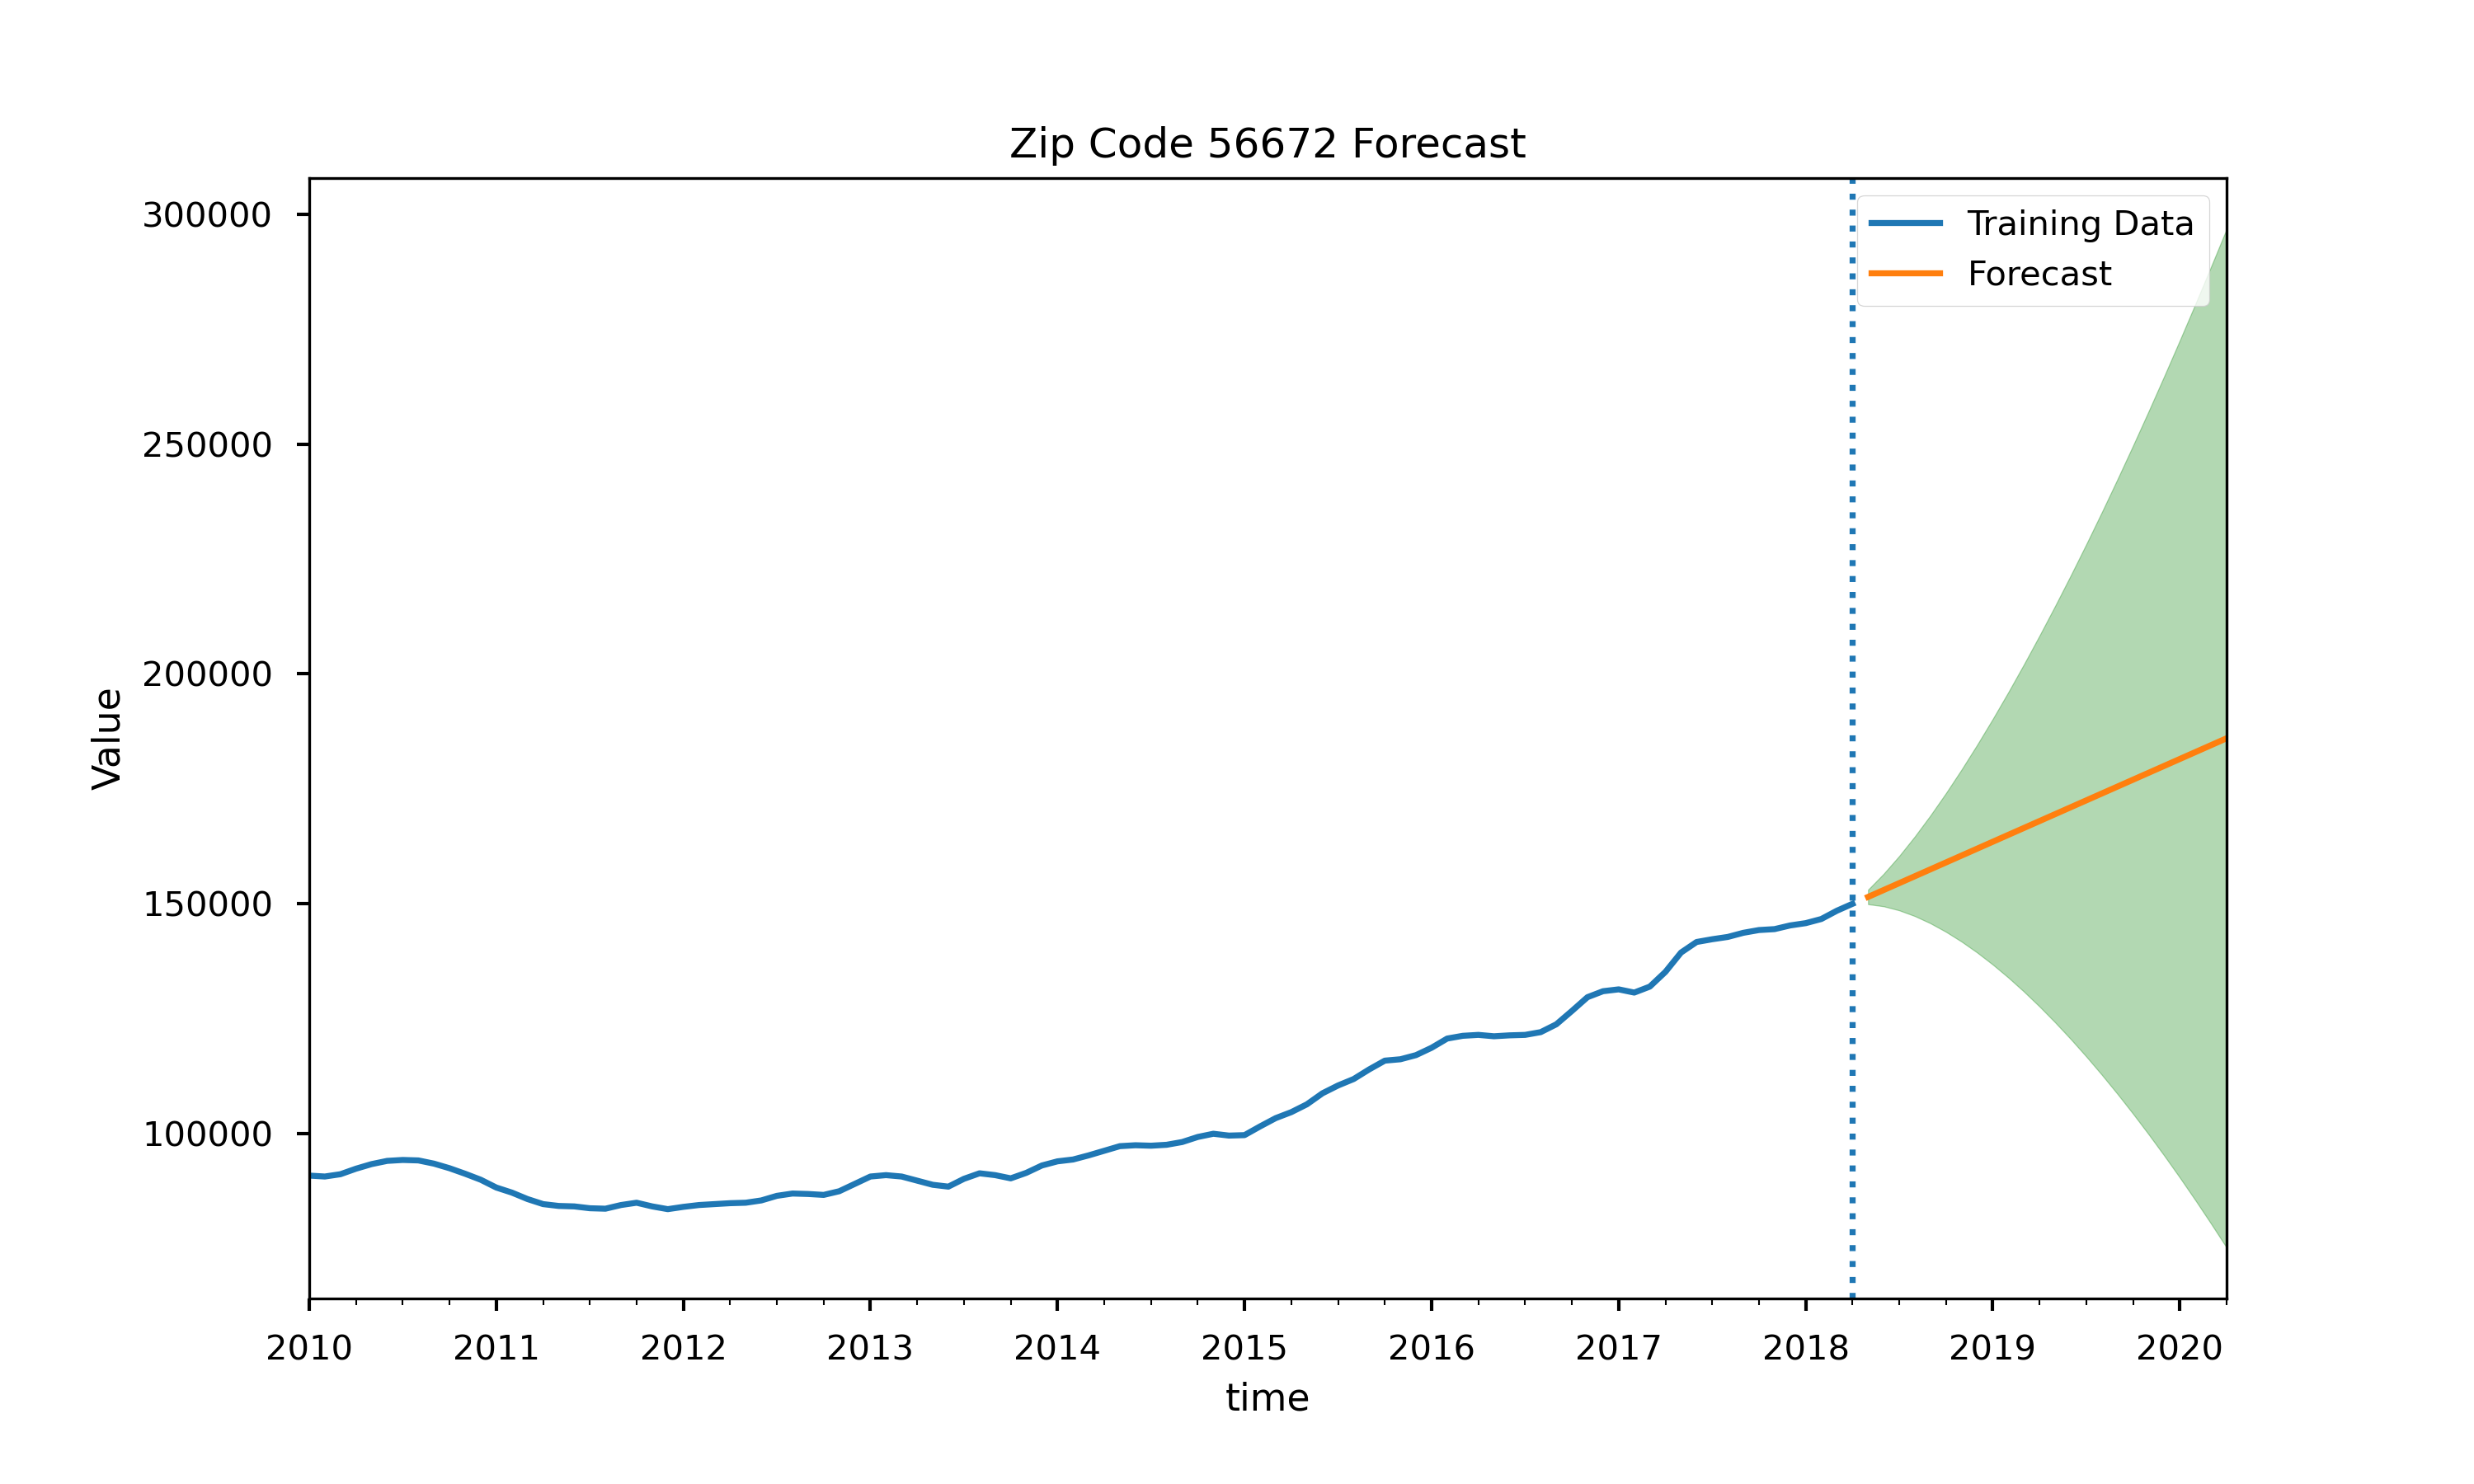
Zip Code 56672: 22.8% 24 month ROI
The figure above shows 24 month home value forecast and confidence interval
Based on the forecasted ROI percentages calculated from the SARIMA model forecasts, I would provide the following recommendations to the real estate investment firm as they look to invest in Minnesota:
-
Zip Code 55412 Zip code 55412 had a forecasted ROI of 35.6% after three years, with a lower confidence interval of -78% and an upper confidence interval of 149%. The firm should invest in this zip code.
-
Zip Code 55411 Zip code 55411 had a forecasted ROI of 34.6% after three years, with a lower confidence interval of -91% and an upper confidence interval of 160%. The firm should invest in this zip code.
-
Zip Code 55319 Zip code 55319 had a forecasted ROI of 32.4% after three years, with a lower confidence interval of -27.1% and an upper confidence interval of 92.1%. The firm should invest in this zip code.
-
Zip Code 55413 Zip code 55413 had a forecasted ROI of 26.7% after three years, with a lower confidence interval of -9.8% and an upper confidence interval of 63.3%. The firm should invest in this zip code.
-
Zip Code 56672 Zip code 55672 had a forecasted ROI of 22.8% after three years, with a lower confidence interval of -50% and an upper confidence interval of 96%. The firm should invest in this zip code.
However, the SARIMA models and analysis are not complete solutions, nor are they perfect. The time series struggle to perfectly meet the assumption of stationarity, and as such the models will not be completely accurate.
I could improve this analysis in the future by further transforming the data to achieve stationarity, further tweaking the hyperparameters of the models, or by experimenting with other models like recurrent neural networks, Prophet, and Greykite.
Please review the narrative of our analysis in my jupyter notebook or review our presentation
For any additional questions, please contact Peder Norr at norr.peder@gmail.com
├── README.md                         <- The top-level README for reviewers of this project.
├── minnesota_home_value_time_series_analysis.ipynb   <- narrative documentation of analysis in jupyter notebook
├── minnesota_home_value_time_series_analysis_deck.pdf   <- pdf version of project presentation
└── images
    └── images                        <- both sourced externally and generated from code
└── data
    └──
