Socioeconomic correlations of urban patterns inferred from aerial images: interpreting activation maps of Convolutional Neural Networks
This repository contains code related to the paper Socioeconomic correlations of urban patterns inferred from aerial images: interpreting activation maps of Convolutional Neural Networks (currently in submission).
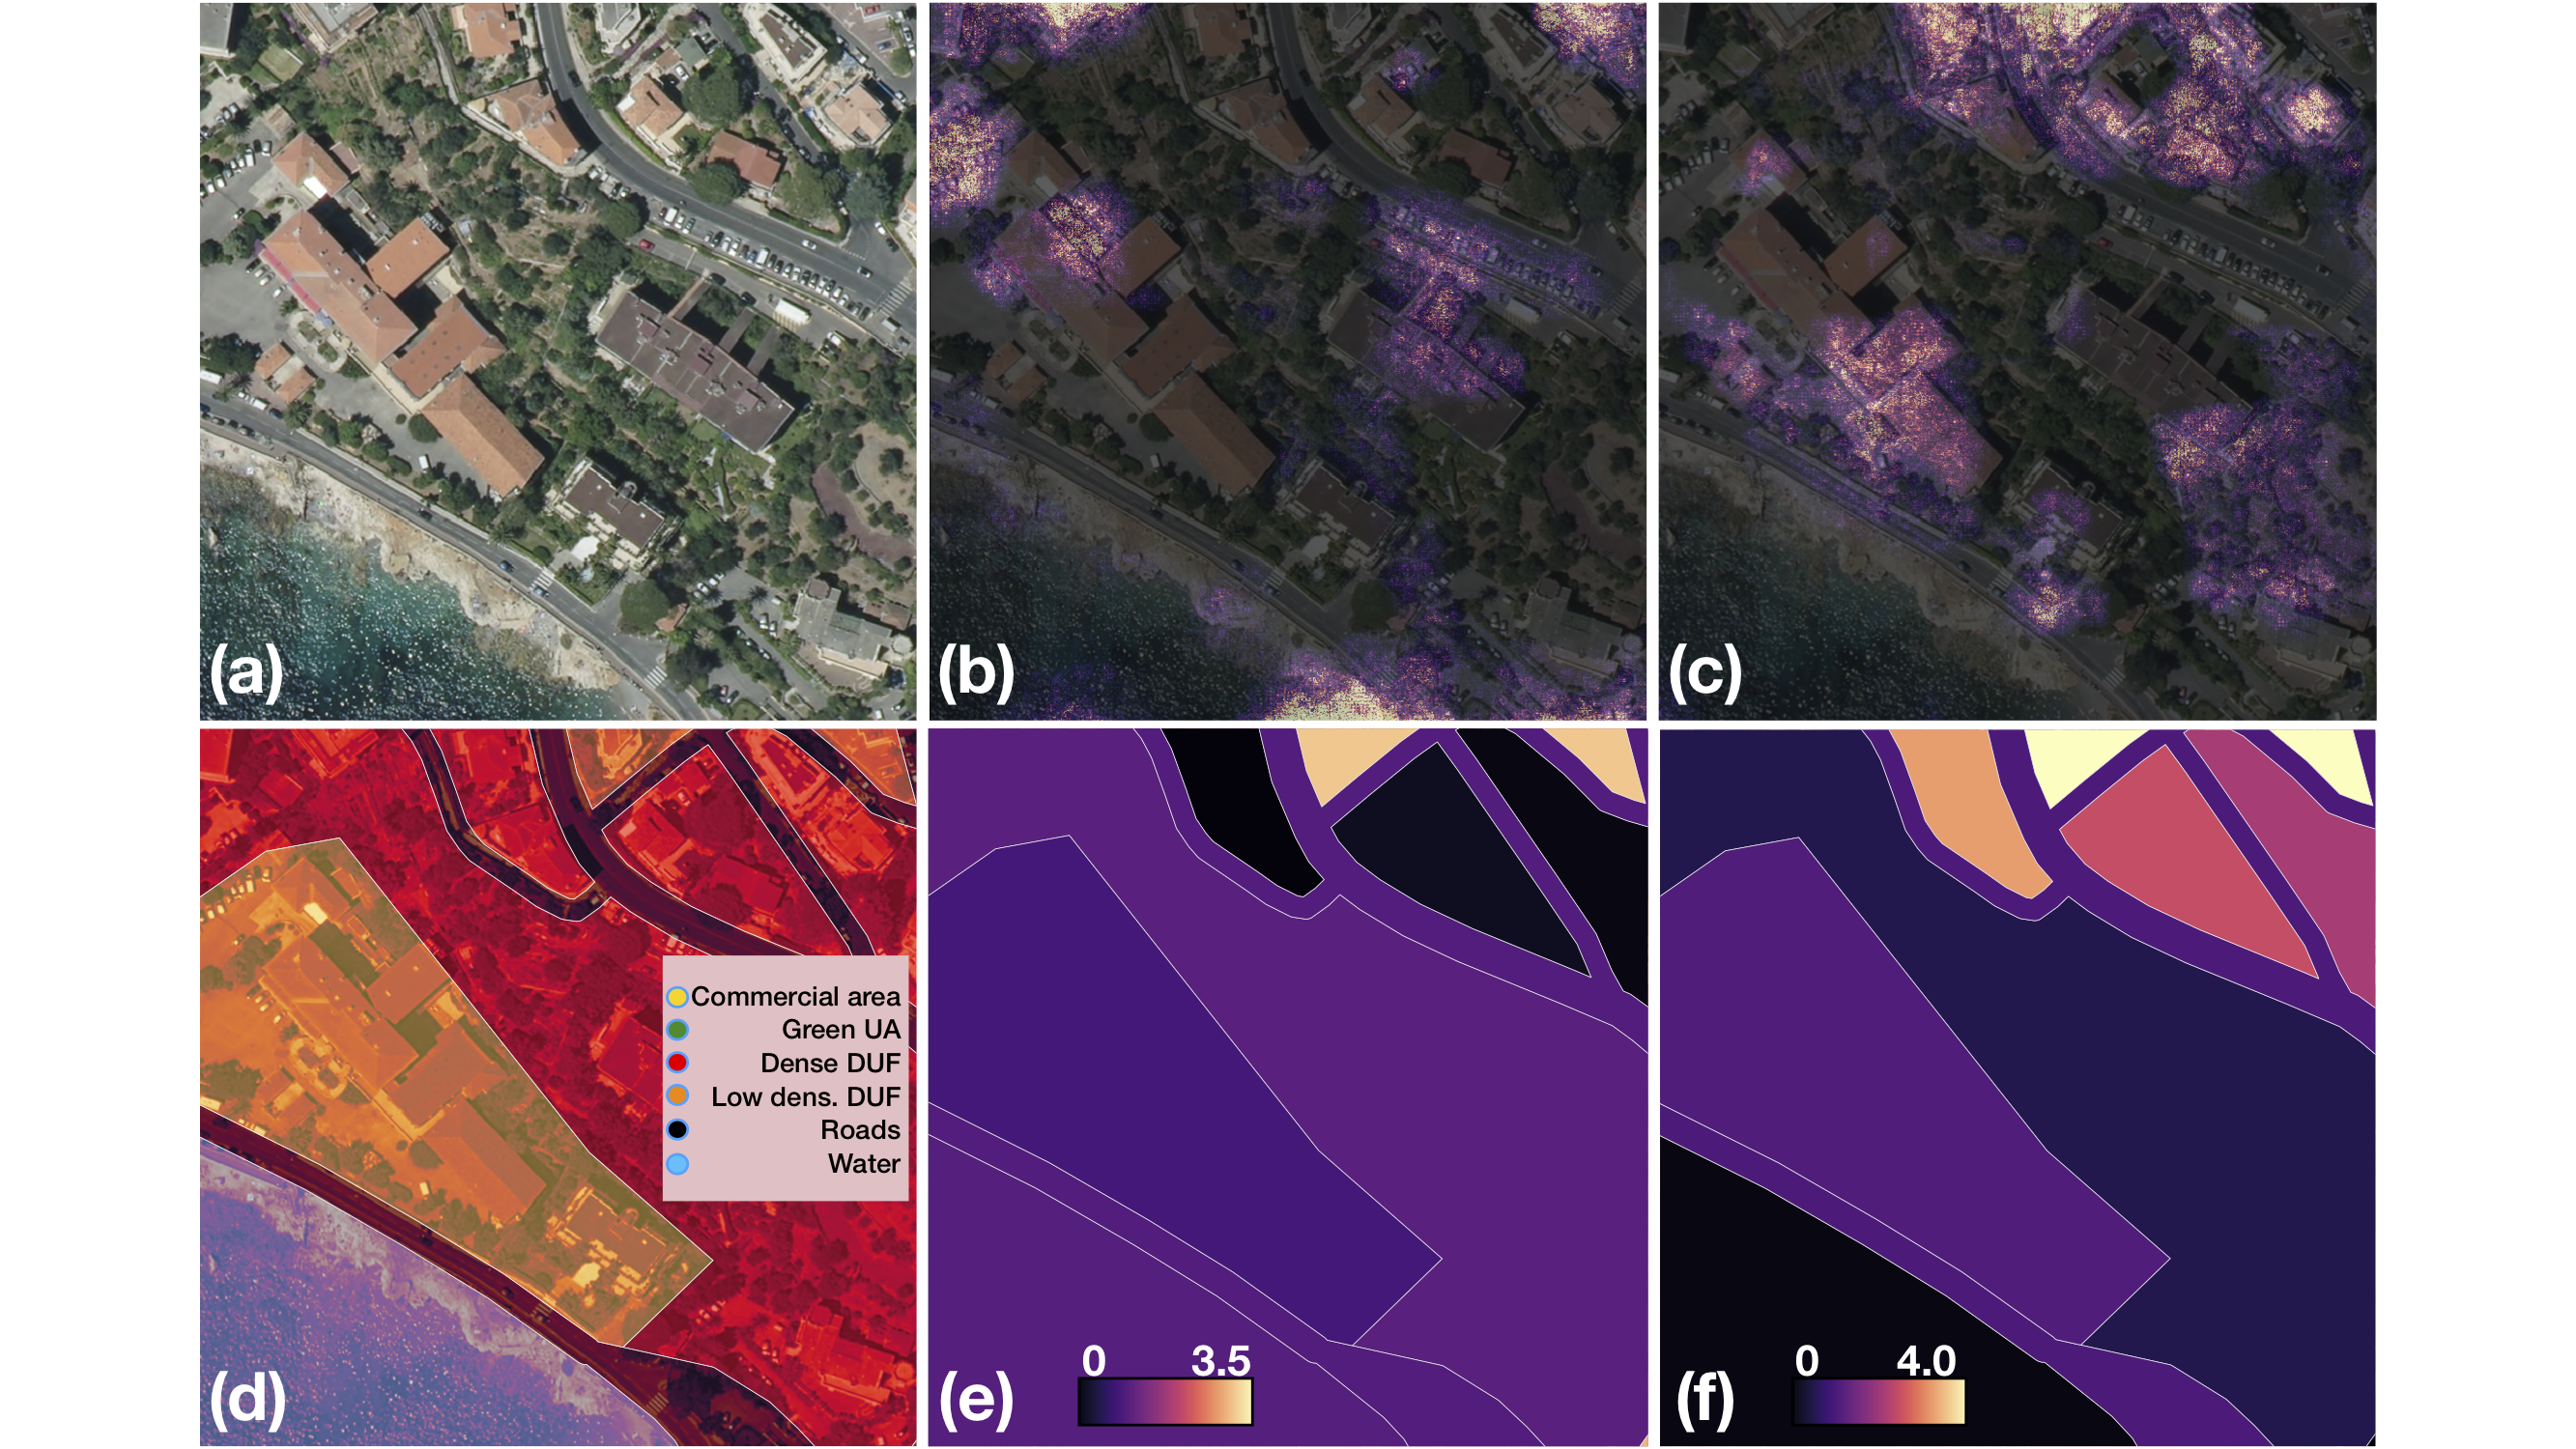
This repository contains the code needed to prepare the data, train the SES inference model and project the activation maps unto the land cover maps.
This project uses mostly Python . To replicate our results, using Anaconda, set up the environment with the provided with conda env create -f environment/environment.yml (this builds the Rust extensions in this package, and installs them locally).
This project relies upon three datasets:
-
2019 Socioeconomic Census: Automatically crawled in the provided
data_setup.shand containing the shapefiles tiling the whole country into individual cells with socioeconomic data. Requires to rundata_setup.sh. -
Urban Atlas Dataset: In order to collect this dataset, you'll need to create an account in the ESA Copernicus register and download the files corresponding to the 5 cities in our study, namely, Paris, Lyon, Nice, Marseille and Lille. These should all be placed in
./data/UA_data/and unzipped. -
Aerial Dataset: In order to collect this dataset, you'll need to create an account within the IGN register and then proceed to download the links provided in
aerial_links. These should be placed in./data/aerial_data/and unzipped with7z.
As a result, your dataset folder should look like the following:
data
├── census_data
├── aerial_data
├── UA_data

code
├── data_setup.sh                                   #Setup data
├── generate_fr_ua_aerial_data.py  #Extract images for training
├── aerial_training_utils.py  #Helper methods for data handling
├── efficientnet_training.py          #Train CNN for given city
├── gradcaming_urban_areas.py #Project GradCAM onto UA polygons
└── run.sh 							  #Run all methods together

results
├── imagery_out
├── model_data
└── tmp
Once the datasets are compiled, you are now able to run the whole pipeline, as follows:
-
Execute first
generate_fr_ua_aerial_data.py. This will extract all the images (png) corresponding to individual census cells into the results directory. -
Then, run
efficientnet_training.py. This will train by default the CNN proposed in the paper with the same parametrization for the city of Paris. Separate runs are needed for all other four cities. -
Finally, run
gradcaming_urban_areas.pyto compute the activation maps and the corresponding statistics for the city of Paris. Separate runs for other cities are needed as well.
If you use the code, data, or analysis results in this paper, we kindly ask that you cite the paper above as:
Socioeconomic correlations of urban patterns inferred from aerial images: interpreting activation maps of Convolutional Neural Networks , J. Levy Abitbol, M. Karsai, 2020, arxiv-preprint.
