This project is a KDAB R&D effort to create a standalone GUI for performance data. As the first goal, we want to provide a UI like KCachegrind around Linux perf. Looking ahead, we intend to support various other performance data formats under this umbrella.
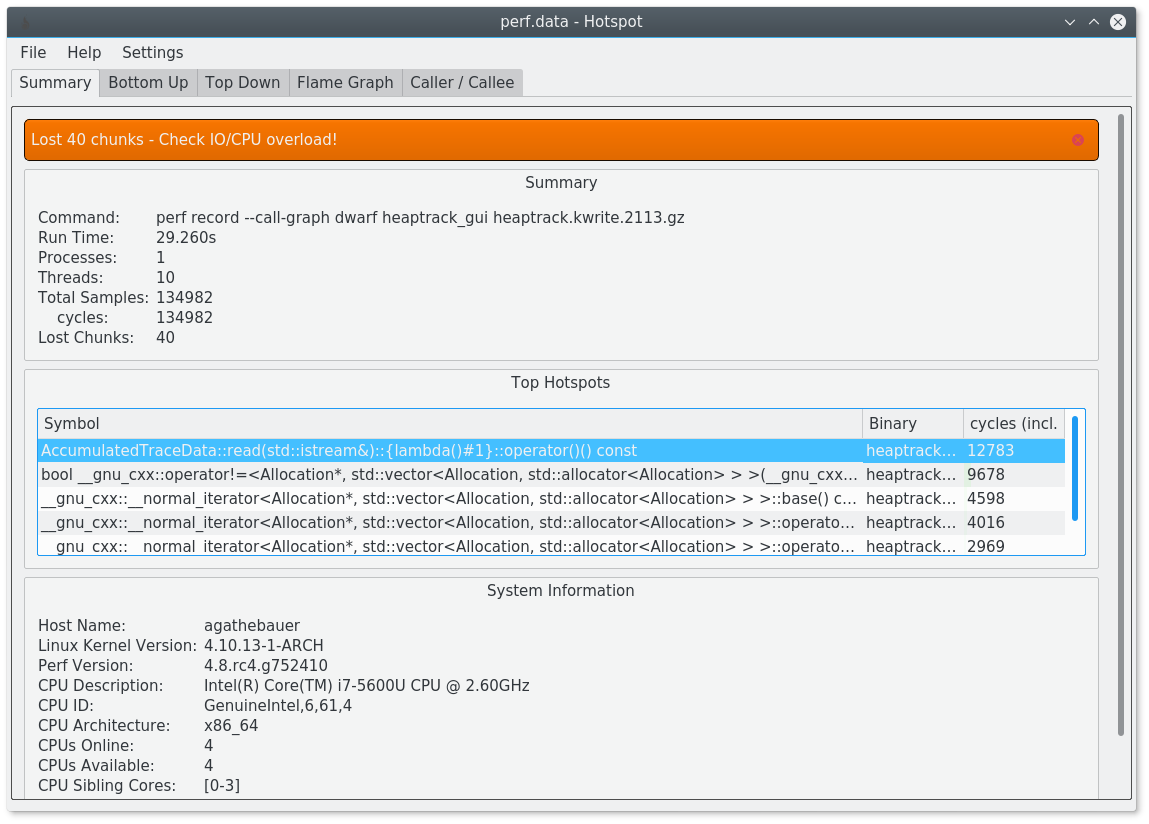
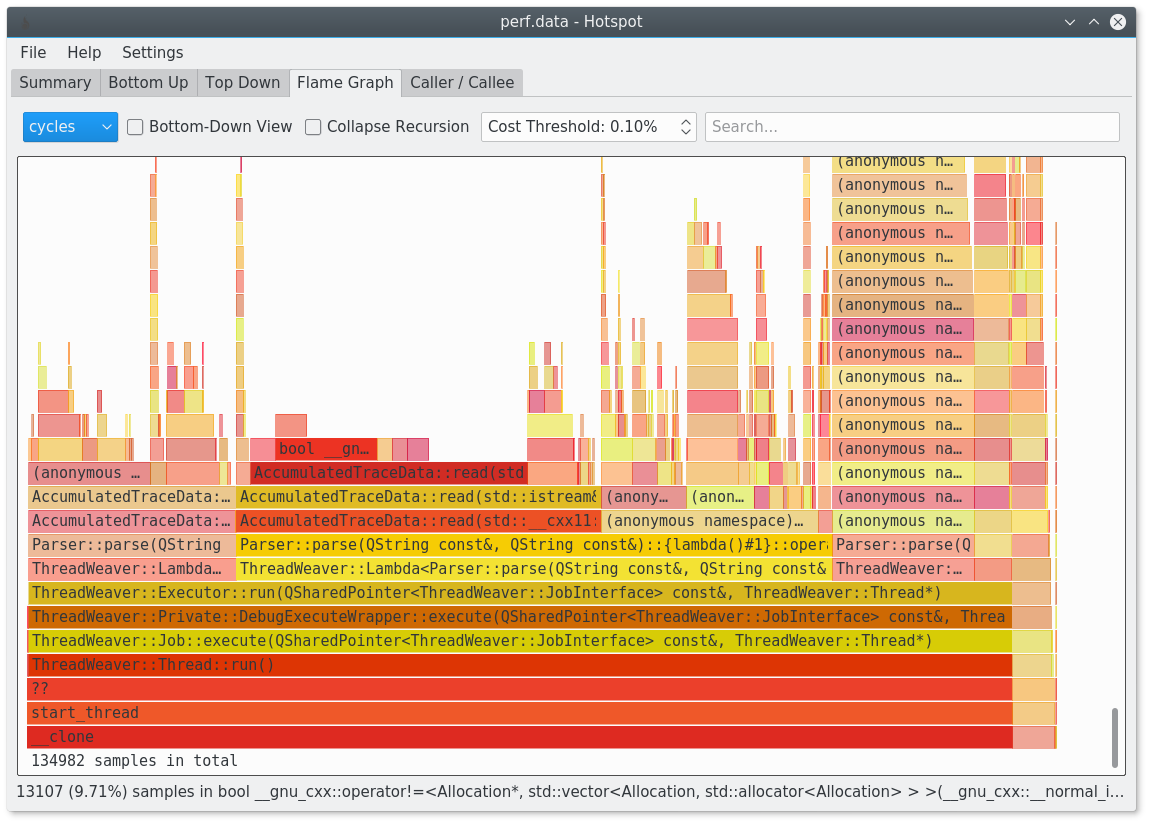
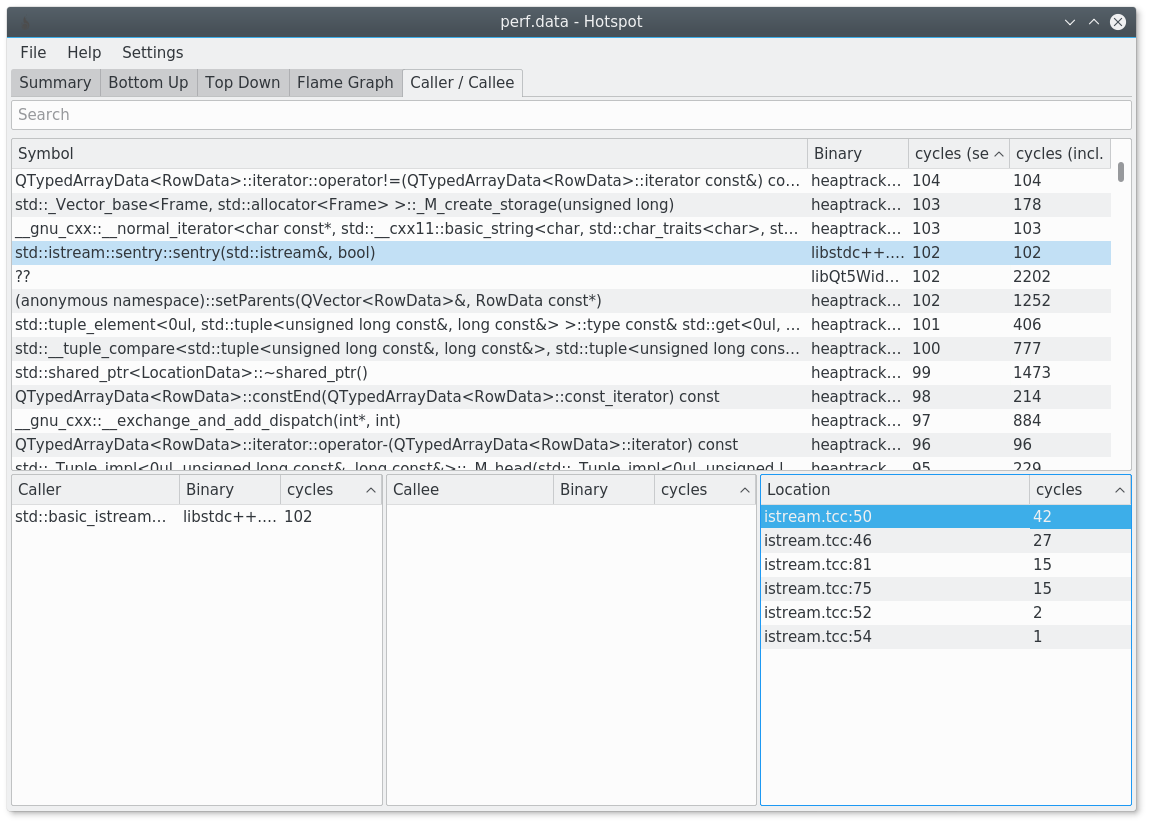
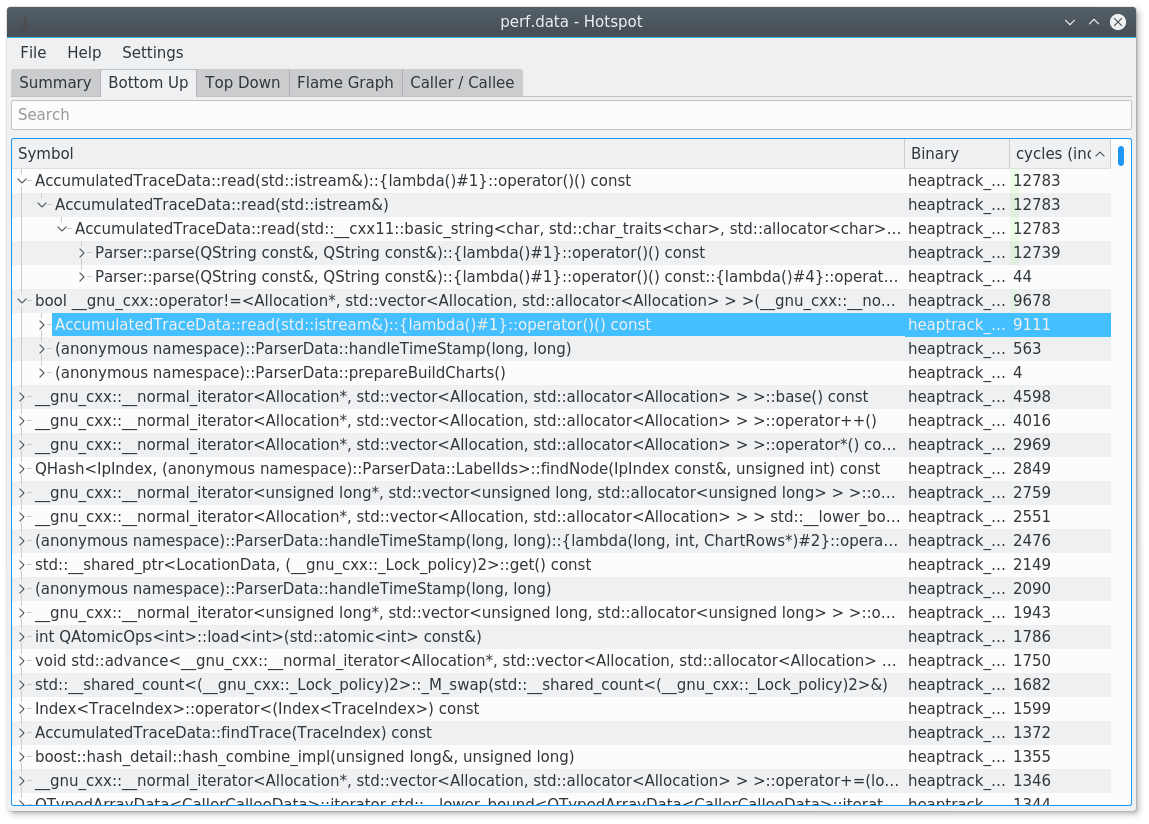
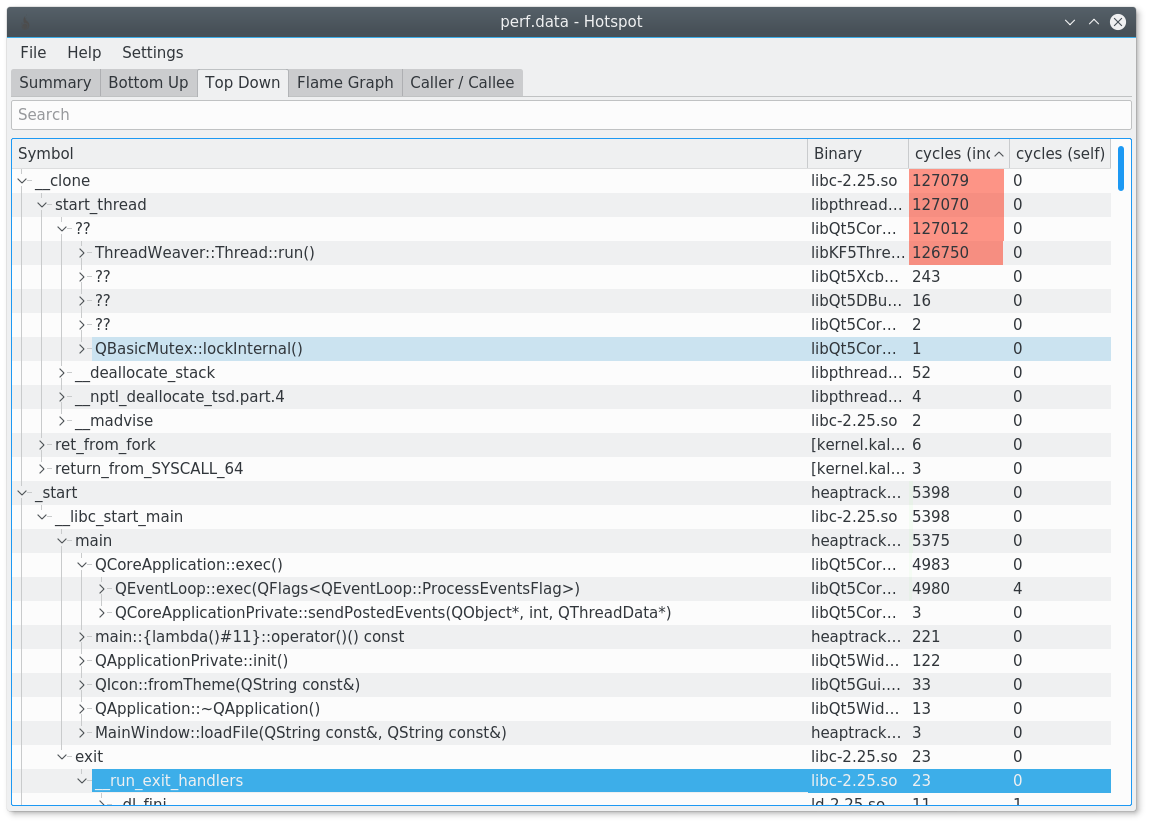
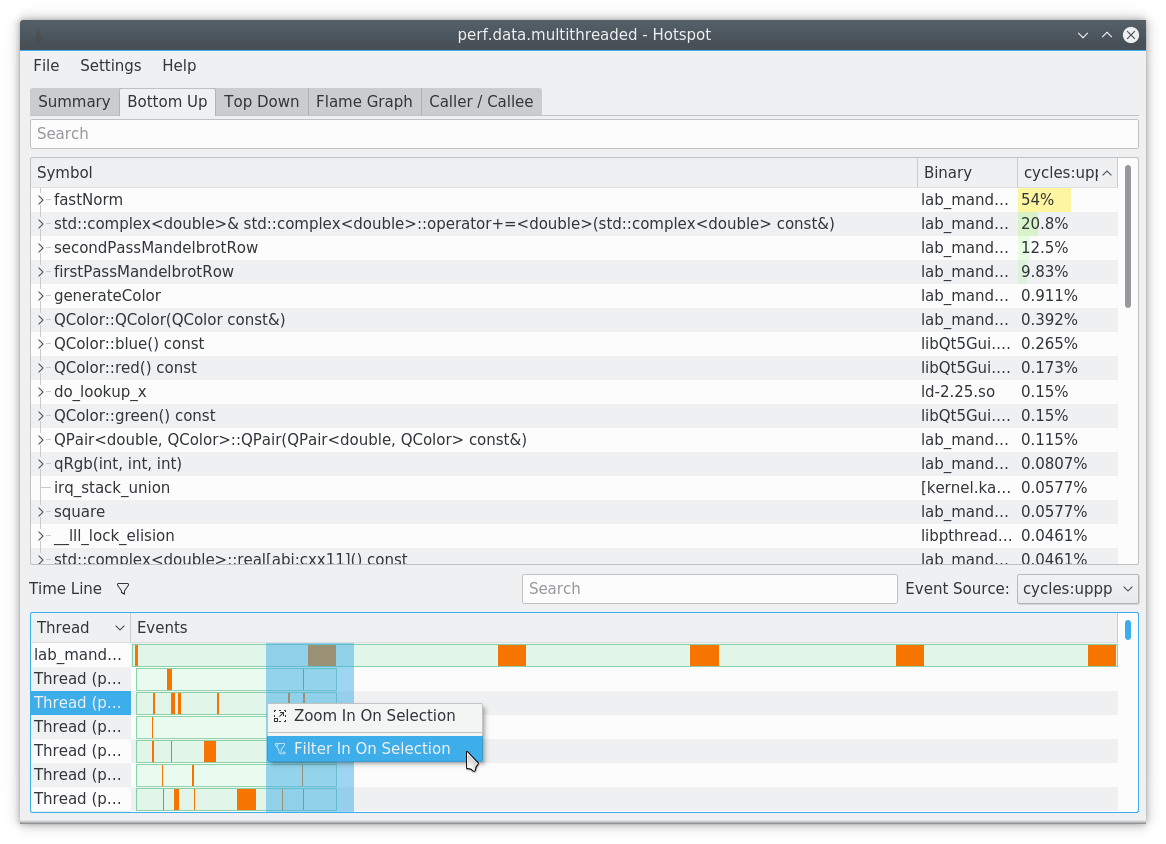
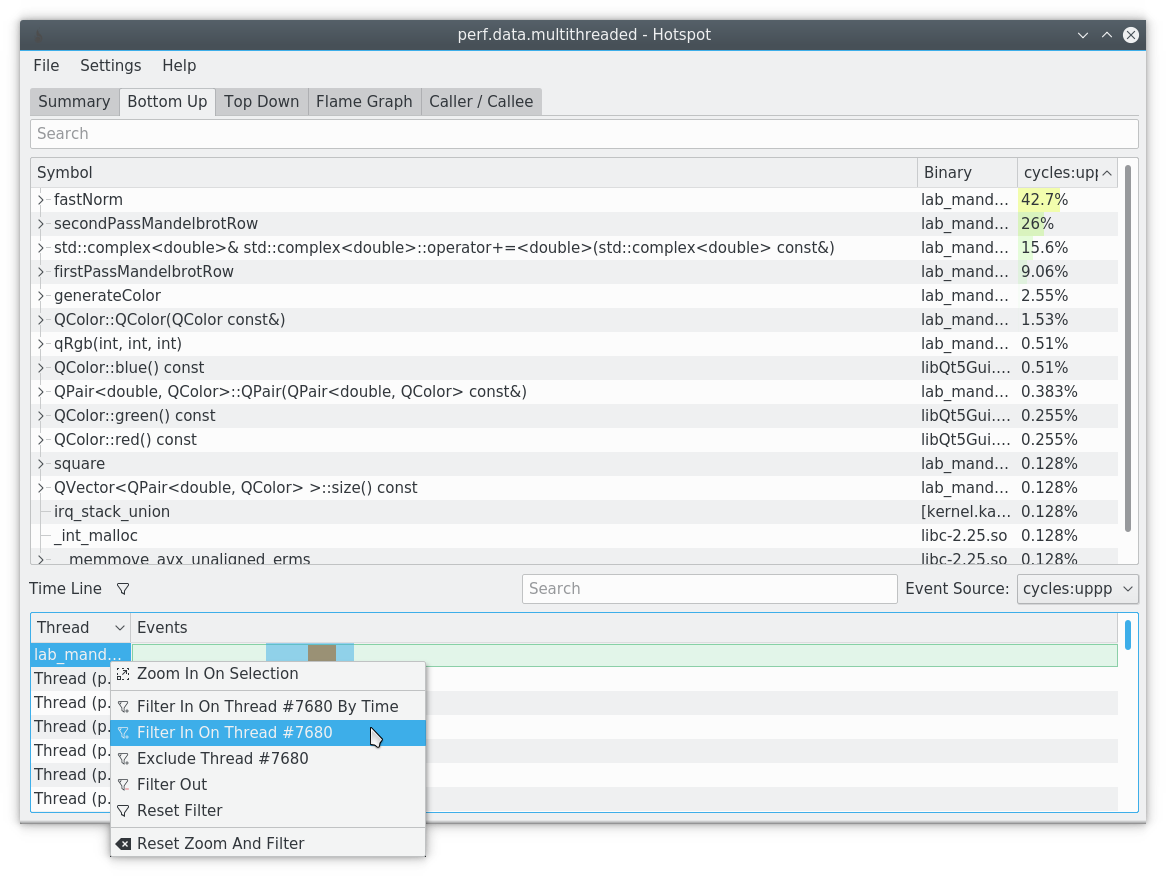
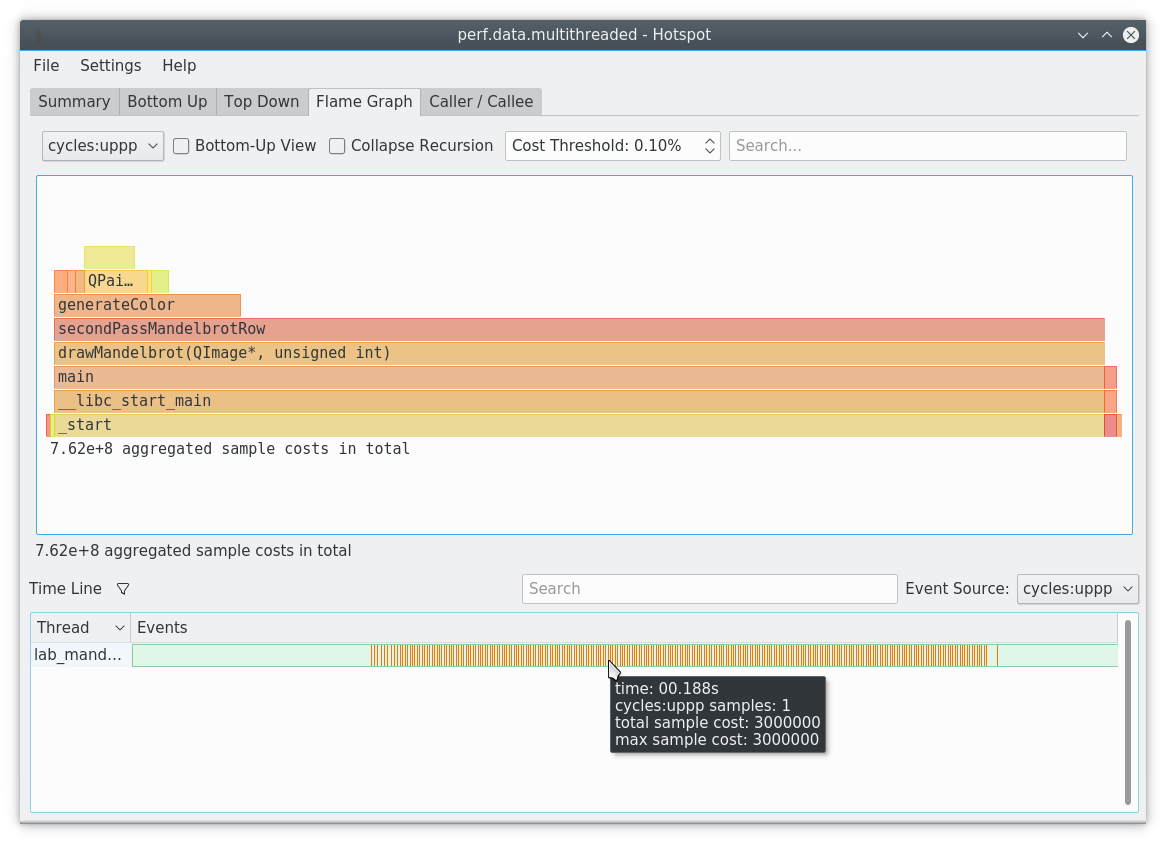
Here are some screenshots showing the most important features of hotspot in action:
The main feature of hotspot is visualizing a perf.data file graphically.
The time line allows filtering the results by time, process or thread. The data views will update accordingly.
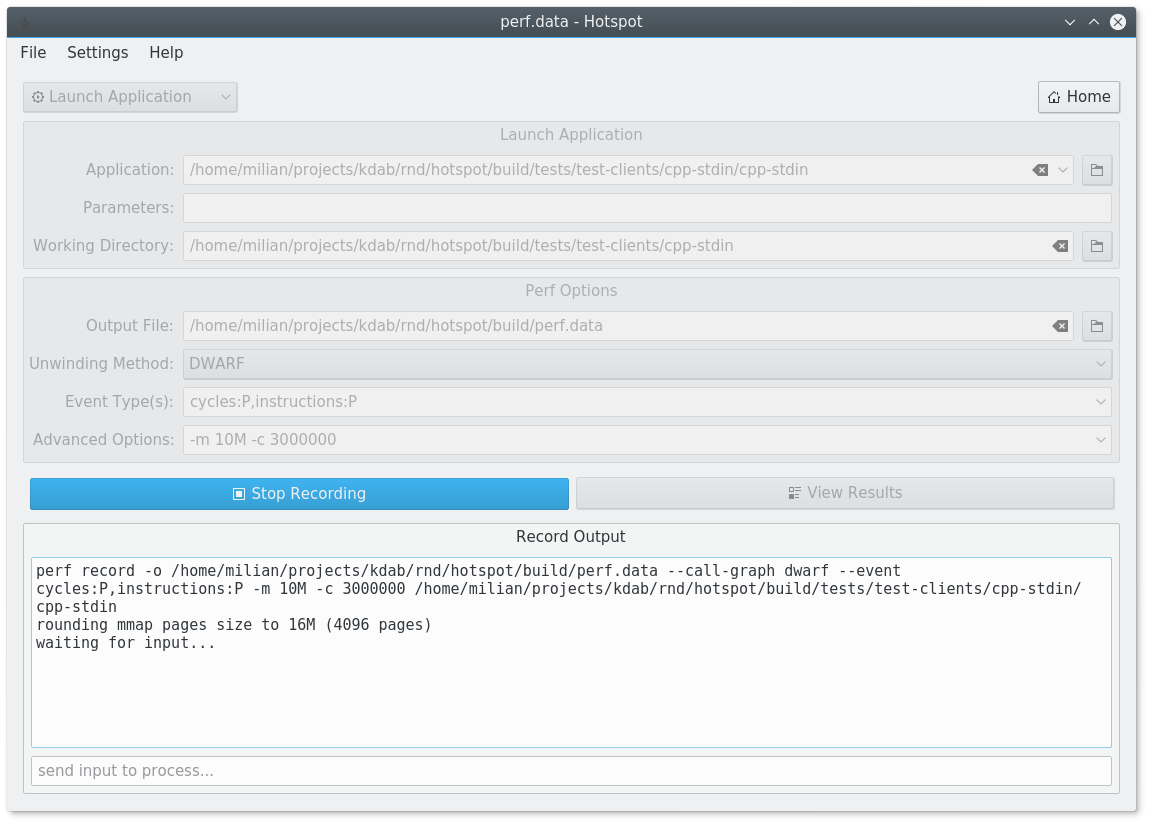
You can also launch perf from hotspot, to profile a newly started application
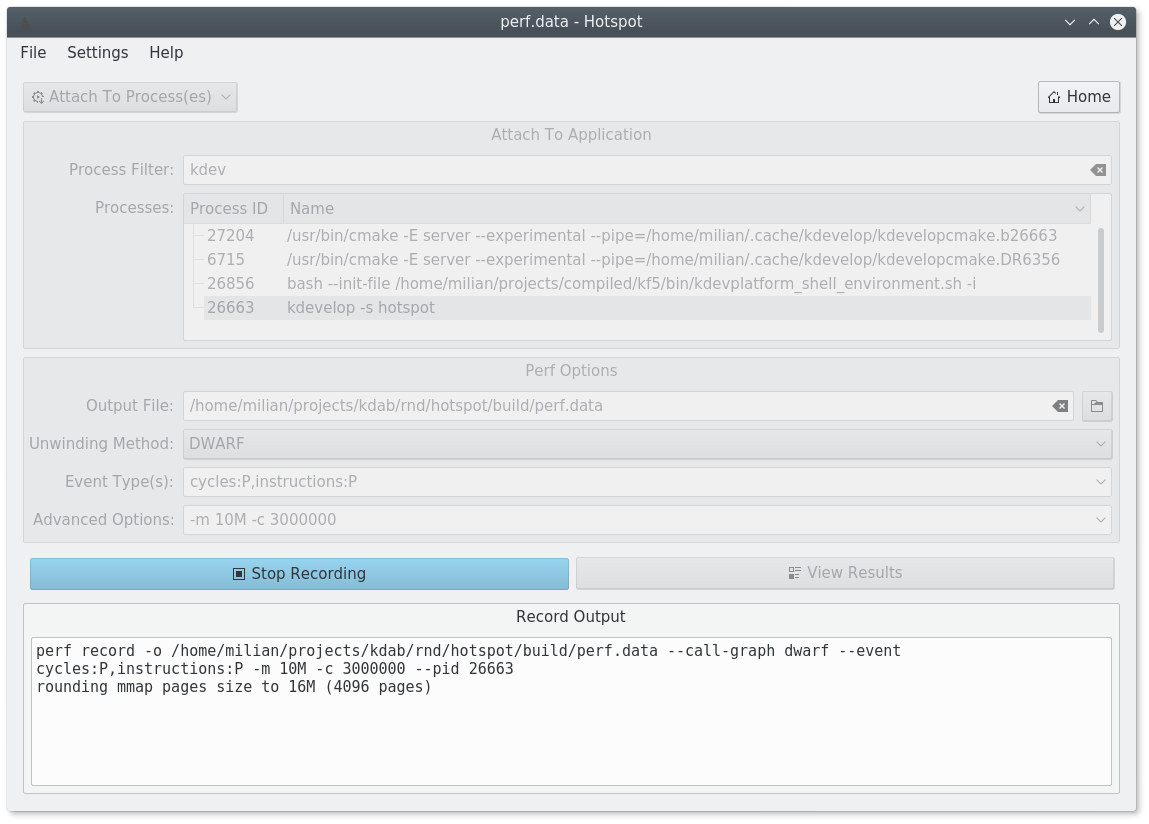
or to attach to already running process(es). Do take the caveats below
into account though.
As of now, you will need the following dependencies to build this project:
- CMake 3.1.0 or higher
- any C++11 enabled compiler
- Qt 5.6.0 or higher
- libelf
- libelfutils
- gettext
- extra-cmake-modules
- KDE Frameworks 5 (packages are usually called libkf5-*-devel):
- threadweaver
- i18n
- configwidgets
- coreaddons
- itemviews
- itemmodels
- kio
- solid
add-apt-repository ppa:kubuntu-ppa/backports
apt-get update
apt-get install libkf5threadweaver-dev libkf5i18n-dev libkf5configwidgets-dev \
    libkf5coreaddons-dev libkf5itemviews-dev libkf5itemmodels-dev libkf5kio-dev \
    libkf5solid-dev libelf-dev libdw-dev cmake extra-cmake-modules gettext
dnf install cmake gcc glibc-static gcc-c++ libstdc++-static qt5 qt5-devel \
    extra-cmake-modules elfutils-devel kf5-threadweaver-devel kf5-ki18n-devel \
    kf5-kconfigwidgets-devel kf5-kitemviews-devel kf5-kitemmodels-devel \
    kf5-kio-devel kf5-solid-devel kf5-kwindowsystem
pacman -Sy cmake gcc extra-cmake-modules threadweaver ki18n kconfigwidgets \
    kitemviews kitemmodels kio solid libelf gettext qt5-base
zypper in cmake gcc-c++ extra-cmake-modules threadweaver-devel ki18n-devel kio-devel \
    solid-devel kcoreaddons-devel threadweaver-devel kconfigwidgets-devel \
    kitemmodels-devel kitemviews-devel libqt5-qtbase-devel libelf-devel \
    libdw-devel gettext glibc-devel-static
git clone --recurse-submodules https://github.com/KDAB/hotspot.git
mkdir build-hotspot
cd build-hotspot
cmake ../hotspot
make
# now you can run hotspot from the build folder:
./bin/hotspot
# or `make install` it and launch it from your $PATH
If you need help building this project for your platform, contact us for help.
First of all, record some data with perf. To get backtraces, you will need to enable the dwarf callgraph mode:
perf record --call-graph dwarf <your application>
...
[ perf record: Woken up 58 times to write data ]
[ perf record: Captured and wrote 14.874 MB perf.data (1865 samples) ]
Now, if you have hotspot available on the same machine, all you need to do is launch it.
It will automatically open the perf.data file in the current directory (similar to perf report).
Alternatively, you can specify the path to the data file on the console:
hotspot /path/to/perf.data
If you are recording on an embedded system, you will want to analyze the data on your development machine with hotspot. To do so, make sure your sysroot contains the debug information required for unwinding (see below). Then record the data on your embedded system:
embedded$ perf record --call-graph dwarf <your application>
...
[ perf record: Woken up 58 times to write data ]
[ perf record: Captured and wrote 14.874 MB perf.data (1865 samples) ]
embedded$ cp /proc/kallsyms /tmp/kallsyms # make pseudo-file a real file
It's OK if your embedded machine is using a different platform than your host. On your host, do the following steps then to analyze the data:
host$ scp embedded:perf.data embedded:/tmp/kallsyms .
host$ hotspot --sysroot /path/to/sysroot --kallsyms kallsyms \
              perf.data
If you manually deployed an application from a path outside your sysroot, do this instead:
host$ hotspot --sysroot /path/to/sysroot --kallsyms kallsyms --appPath /path/to/app \
              perf.data
If your application is also using libraries outside your sysroot and the appPath, do this:
host$ hotspot --sysroot /path/to/sysroot --kallsyms kallsyms --appPath /path/to/app \
              --extraLibPaths /path/to/lib1:/path/to/lib2:... \
              perf.data
And, worst-case, if you also use split debug files in non-standard locations, do this:
host$ hotspot --sysroot /path/to/sysroot --kallsyms kallsyms --appPath /path/to/app \
              --extraLibPaths /path/to/lib1:/path/to/lib2:... \
              --debugPaths /path/to/debug1:/path/to/debug2:... \
              perf.data
If anything breaks in the above and the output is less usable than perf report, please report an issue on GitHub.
That said, there are some known issues that people may trip over:
Unwinding the stack to produce a backtrace is a dark art and can go wrong in many ways.
Hotspot relies on perfparser (see below), which in turn relies on libdw from elfutils
to unwind the stack. This works quite well most of the time, but still can go wrong. Most
notably, unwinding will fail when:
- an ELF file (i.e. executable or library) referenced by the
perf.datafile is missing- to fix this, try to use one of the following CLI arguments to let hotspot know where to look for the ELF files:
--debugPaths <paths>: Use this when you have split debug files in non-standard locations--extraLibPaths <paths>: Use this when you have moved libraries to some other location since recording--appPath <paths>: This is kind of a combination of the above two fields. The path is traversed recursively, looking for debug files and libraries.--sysroot <path>: Use this when you try to inspect a data file recorded on an embedded platform
- to fix this, try to use one of the following CLI arguments to let hotspot know where to look for the ELF files:
- an ELF file is missing debug information
- to fix this, install the debug package from your distro
- or compile the code in "release with debug" mode, i.e. ensure your compiler is invoked with something like
-O2 -g. You will have to repeat theperf recordstep - potentially both of the above is not an option for you, e.g. when the library is closed source and supplied by a thirdparty vendor. If that is the case, you may be lucky and the library contains frame pointers. If so, then try to build elfutils from current git master (you want commit a55df2c1, which should be part of 0.170). This version of elfutils will try to fallback to the frame pointer for unwinding, when the debug information is missing.
- your call stacks are too deep
-
by default,
perf recordonly copies a part of the stack to the data file. This can lead to issues with very deep call stacks, which will be cut off at some point. This issue will break the top-down call trees in hotspot, as visualized in the Top-Down view or the Flame Graph. To fix this, you can try to increase the stack dump size, i.e.:perf record --call-graph dwarf,32768Note that this can dramatically increase the size of the
perf.datafiles - use it with care. Also have a look atman perf record. -
For some scenarios, recursive function calls simply fail to be unwound. See also KDAB#93
-
Compared to perf report, hotspot misses a lot of features. Some of these are planned to be resolved
in the future. Others may potentially never get implemented. But be aware that the following features
are not available in hotspot currently:
- tracepoints: we only analyze and show samples. This means that it is currently impossible to do off-CPU profiling with hotspot.
- annotate: the caller/callee view shows cost attributed to individual source lines. But a proper annotation view like
perf annotate, esp. on the instruction level, is currently missing. - the columns in the tables are currently hardcoded, while potentially a user may want to change this to show e.g. cost per-process or thread and so forth
- many of the more advanced features, such as
--itrace,--mem-mode,--branch-stackand--branch-history, are unsupported
It is a good idea to launch hotspot with sudo or as root user. See e.g.
Editing Files As Root
for an article on that matter. Issue #83 is
also relevant in this contact.
But without superuser rights, you will probably see error messages such as the following when using hotspot's record feature:
You may not have permission to collect stats.
Consider tweaking /proc/sys/kernel/perf_event_paranoid:
  -1 - Not paranoid at all
   0 - Disallow raw tracepoint access for unpriv
   1 - Disallow cpu events for unpriv
   2 - Disallow kernel profiling for unpriv
If that is the case, follow these steps to temporarily elevate your capabilities. See also issue #90 for our plan to improve this situation in the future.
This project leverages the excellent perfparser utility created by The Qt Company
for their Qt Creator IDE. If you are already using Qt Creator, consider leveraging
its integrated CPU Usage Analyzer.
Hotspot is dual-licensed under the GPL v2+ or under a commercial KDAB license. See LICENSE.GPL.txt, LICENSE.txt and LICENSE.US.txt for more information, or contact info@kdab.com if any conditions of this licensing are not clear to you.

