Logary is a high performance, multi-target logging, metric, tracing and health-check library for mono and .Net.
Follow Logary at twitter: @logarylib
Chat and support and get support:

If you like the code, buy me a beer!
Logary v2.0 aims to be compatible with the latest Mono and .Net 4.0. It is compiled with open source F# 3.0. Logary is continously built on CentOS.
Install-Package Intelliplan.Logary -Pre- Why?
- API
- Targets
- Target: Logary.TextWriter builtin
- Target: Logary.Console builtin
- Target: Logary.Debugger builtin
- Target: Logary.Logstash builtin
- Target: Logary.Graphite builtin
- Target: Logary.ElmahIO
- Target: Logary.Logentries
- Target: Logary.Loggr
- Target: Logary.Riemann
- Target: Logary.DB
- Target: Logary.Nimrod builtin
- Target: Logary.Dash
- Target: Logary.Zipkin
- Adapters
- Services
- Target Maintainers Wanted!
- Building
- Contributing & Code Style
- License
Logary is the next generation logging framework. It observes some facts that it successfully builds its conceptual model from! It's written using functional programming in F# with only a single field 'global state' to facilitate logging with initialise-once static readonly fields. It never throws runtime exceptions if the configuration validates and never blocks the call-site.
This package works great with F#:
open System

open NodaTime

open Logary
open Logary.Configuration
open Logary.Targets
open Logary.Metrics

[<EntryPoint>]
let main argv =
  use logary =
    withLogary' "Riemann.Example" (
      withTargets [
        Riemann.create (Riemann.RiemannConf.Create(tags = ["riemann-health"])) "riemann"
        Console.create (Console.ConsoleConf.Default) "console"
      ] >>
      withMetrics (Duration.FromMilliseconds 5000L) [
        WinPerfCounters.create (WinPerfCounters.Common.cpuTime) "cpuTime" (Duration.FromMilliseconds 500L)
      ] >>
      withRules [
        Rule.forAny "riemann"
        Rule.forAny "console"
      ] >>
      withInternalTargets Info [
        Console.create (Console.ConsoleConf.Default) "console"
      ]
    )

  Console.ReadKey true |> ignore
0This facade is useful when you're using C#
Install-Package Intelliplan.Logary.CSharp -PreIt adds extension methods to the Logary namespace. Just import the namespace
to get access to the extension methods, while having the nuget/dll referenced.
using System;
using System.Data.SQLite;
using System.Text.RegularExpressions;
using FluentMigrator.Runner.Announcers;
using FluentMigrator.Runner.Generators.SQLite;
using FluentMigrator.Runner.Processors.Sqlite;
using Logary;
using Logary.Configuration;
using Logary.DB.Migrations;
using Logary.Target;
using Console = System.Console;

namespace Intelliplan.Logary.Specs.Examples
{
    public class When_using_fluent_API
    {
        public void UsageExample()
        {
            var x = LogaryFactory.New("Logary Specs",
                with => with.Target<TextWriter.Builder>(
                    "console1",
                    conf =>
                    conf.Target.WriteTo(Console.Out, Console.Error)
                        .MinLevel(LogLevel.Verbose)
                        .AcceptIf(line => true)
                        .SourceMatching(new Regex(".*"))
                    )
                    .Target<Graphite.Builder>(
                        "graphite",
                        conf => conf.Target.ConnectTo("127.0.0.1", 2131)
                    )
                    .Target<Debugger.Builder>("debugger")
                    .Target<Logstash.Builder>(
                        "ls",
                        conf => conf.Target
                            .Hostname("localhost")
                            .Port(1936)
                            .EventVersion(Logstash.EventVersion.One)
                            .Done())
                    .Target<DB.Builder>("db",
                        conf => conf.Target
                            .ConnectionFactory(() => new SQLiteConnection())
                            .DefaultSchema()
                            .MigrateUp(
                                conn => new SqliteProcessor(conn,
                                    new SqliteGenerator(),
                                    new ConsoleAnnouncer(),
                                    new MigrationOptions(false, "", 60),
                                    new SqliteDbFactory())))
                );

            var logger = x.GetLogger("Sample.Config");

            logger.Log("Hello world", LogLevel.Debug, new
                {
                    important = "yes"
                });

            logger.Log(LogLevel.Fatal, "Fatal application error on finaliser thread");

            logger.Verbose("immegawd immegawd immegawd!!", "tag1", "tag2");

            var val = logger.TimePath("sample.config.compute_answer_to_everything", () =>
                {
                    for (int i = 0; i < 100; i++)
                        System.Threading.Thread.Sleep(1);

                    return 32;
                });

            logger.LogFormat(LogLevel.Warn, "{0} is the answer to the universe and everything", val);

            logger.Time(() => logger.Debug("I wonder how long this takes", "introspection", "navel-gazing"));

            try
            {
                throw new ApplicationException("thing went haywire");
            }
            catch (Exception e)
            {
                logger.DebugException("expecting haywire, so we're telling with debug", e, "haywire", "external");
            }
        }
    }
}Health Checks are like probes, but know how to interpret the results into the
warning-levels of LogLevel.
Metrics: This is currently fairly well-working - have a look at the SQLHealthService for an example of a Probe.
Currently work in progress.
A configuration-file API for reading Tom's Obvious, Minimal Language into a configuration of Logary.
Install-Package Intelliplan.Logary.TOML -PreFor LogLines
Write to any text writer - such as one from System.IO.File.OpenWrite.
Part of the core assembly:
Install-Package Intelliplan.Logary -PreFor LogLines
Writes output messages to System.Console.Out and Error, and Fatal LogLines
to System.Console.Error.
Part of the core assembly:
Install-Package Intelliplan.Logary -PreFor LogLines
Writes all output to the Debugger-console of Visual Studio, Xamarin Studio or MonoDevelop.
Part of the core assembly:
Install-Package Intelliplan.Logary -PreFor LogLines
This is the most mature target that we use the most at Intelliplan. Logstash is a log router that can move your logs to the best location available.
Manage events and logs. Elasticsearch works seamlessly with Logstash to collect, parse, index, and search logs
Part of the core assembly:
Install-Package Intelliplan.Logary -Pre
For Measures
The graphite target is a mature target for sending Measures from your application.
Graphite - Scalable Realtime Graphing. Graphite is a highly scalable real-time graphing system. As a user, you write an application that collects numeric time-series data that you are interested in graphing, and send it to Graphite's processing backend, carbon, which stores the data in Graphite's specialized database. The data can then be visualized through graphite's web interfaces.
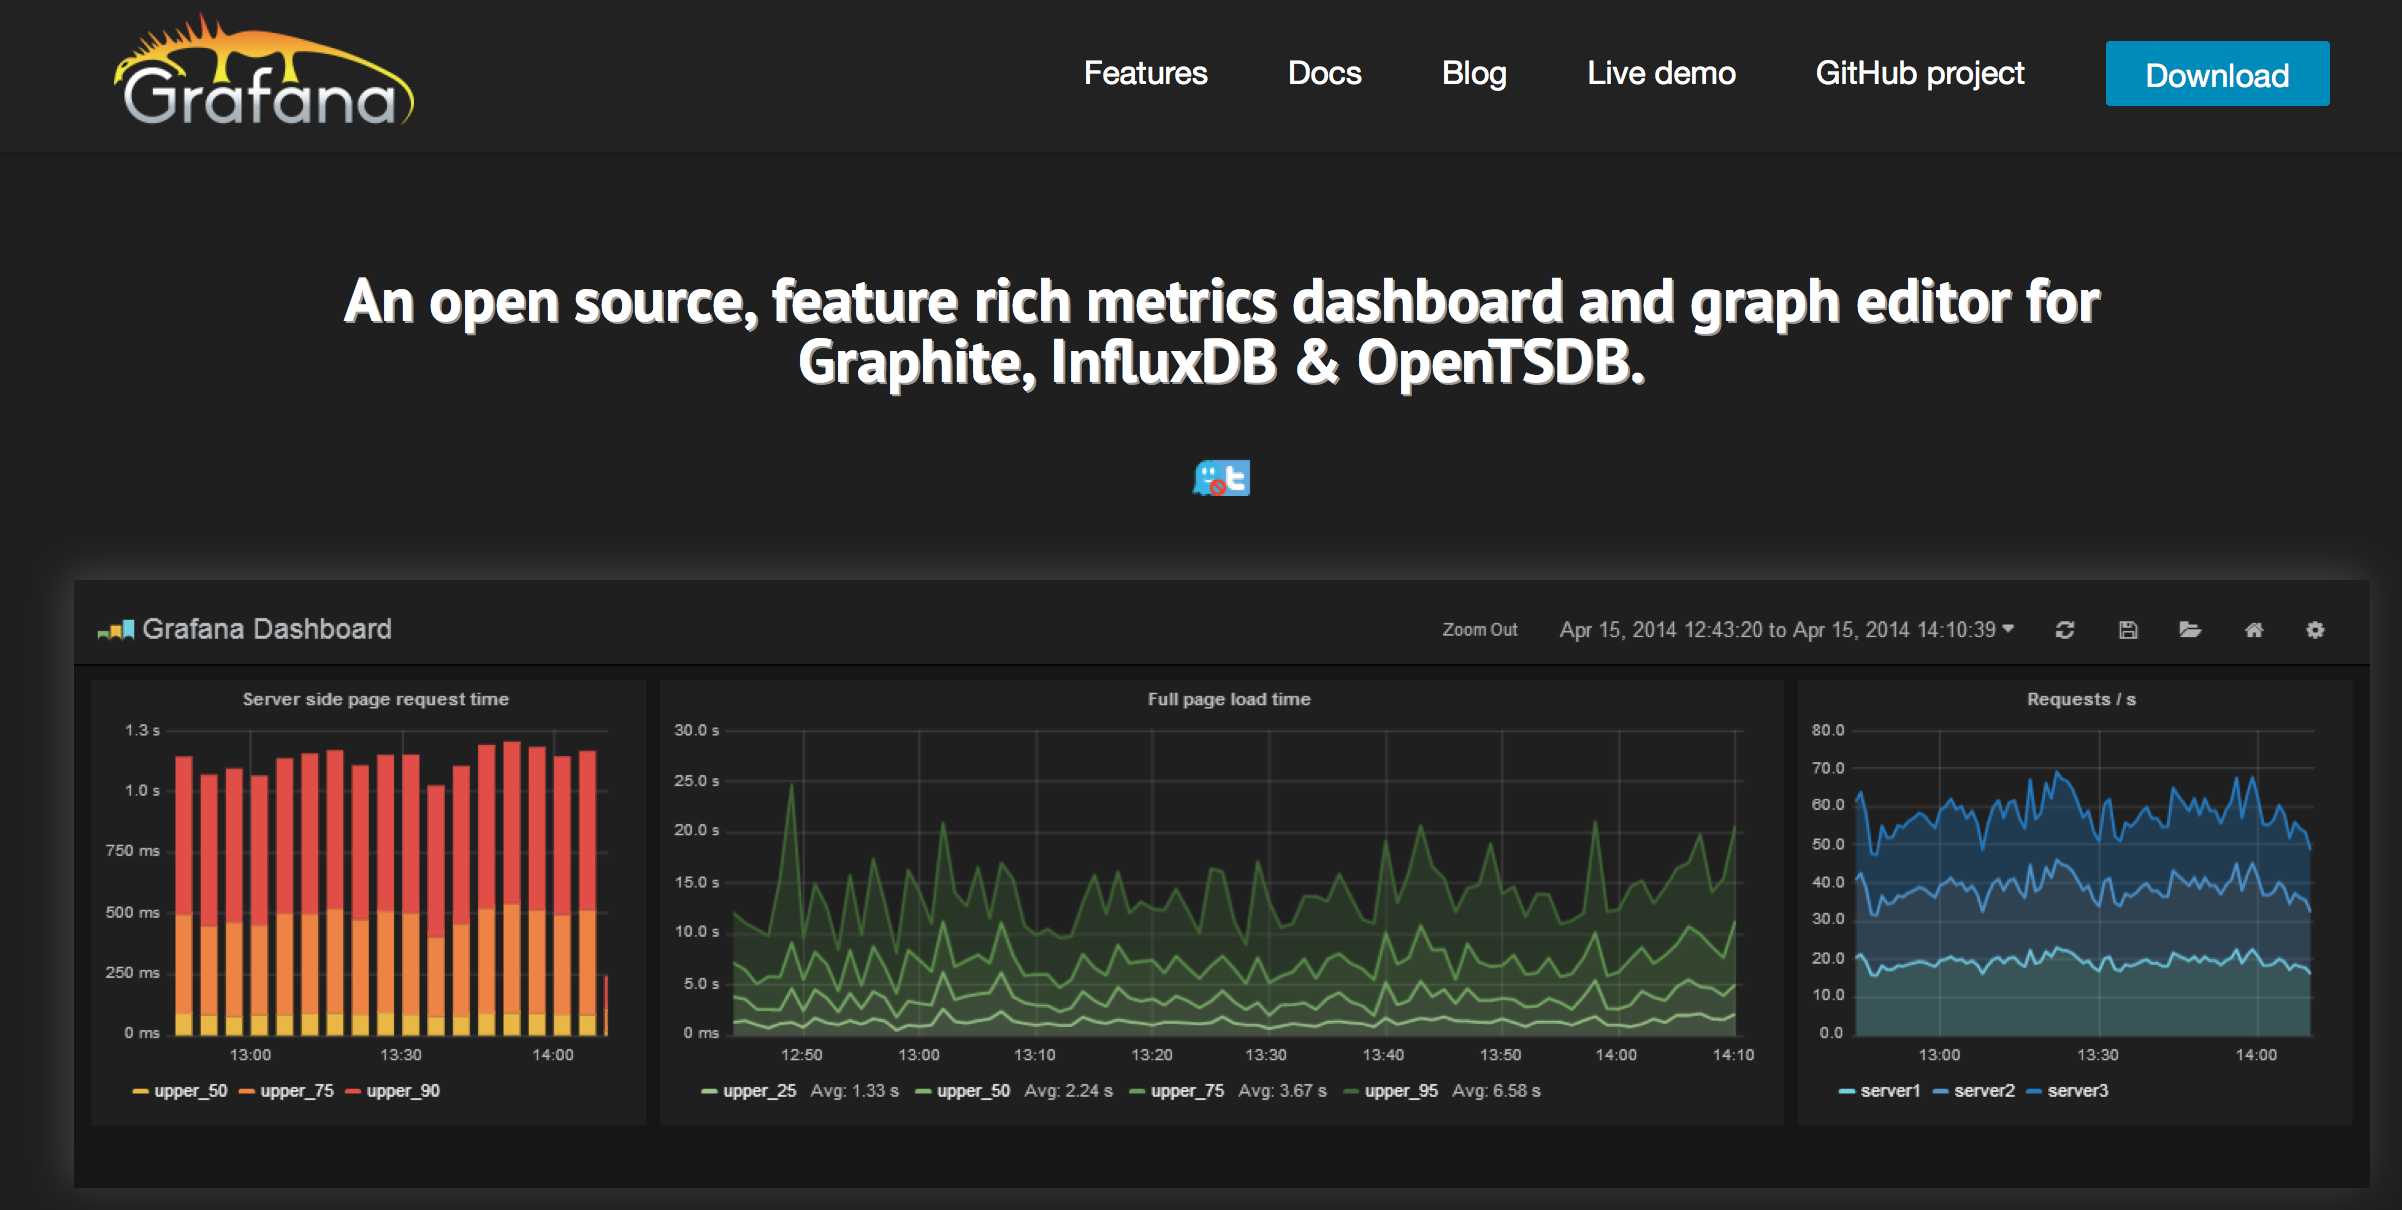
Best used in conjunction with Grafana (a web front-end):
An open source, feature rich metrics dashboard and graph editor for Graphite, InfluxDB & OpenTSDB. Rich graphing: Fast and flexible client side graphs with a multitude of options.
Part of the core assembly:
Install-Package Intelliplan.Logary -PreFor LogLines
Interop target if you are writing a web application and have Elmah.IO as your log dashboard. .Net developer friendly indeed.
Install-Package Intelliplan.Logary.ElmahIO -Pre
For LogLines and Measures
Fast Search & Real-time Log Processing - Centralized search, aggregation, and correlation. See query results in seconds.
Install-Package Intelliplan.Logary.Logentries -PreAll logging to Logentries is encrypted.
For LogLines
Monitor Your Web Apps in Realtime Get a control panel for your web app with event logging, user monitoring, analytics, notifications and more
Install-Package Intelliplan.Logary.Loggr -Pre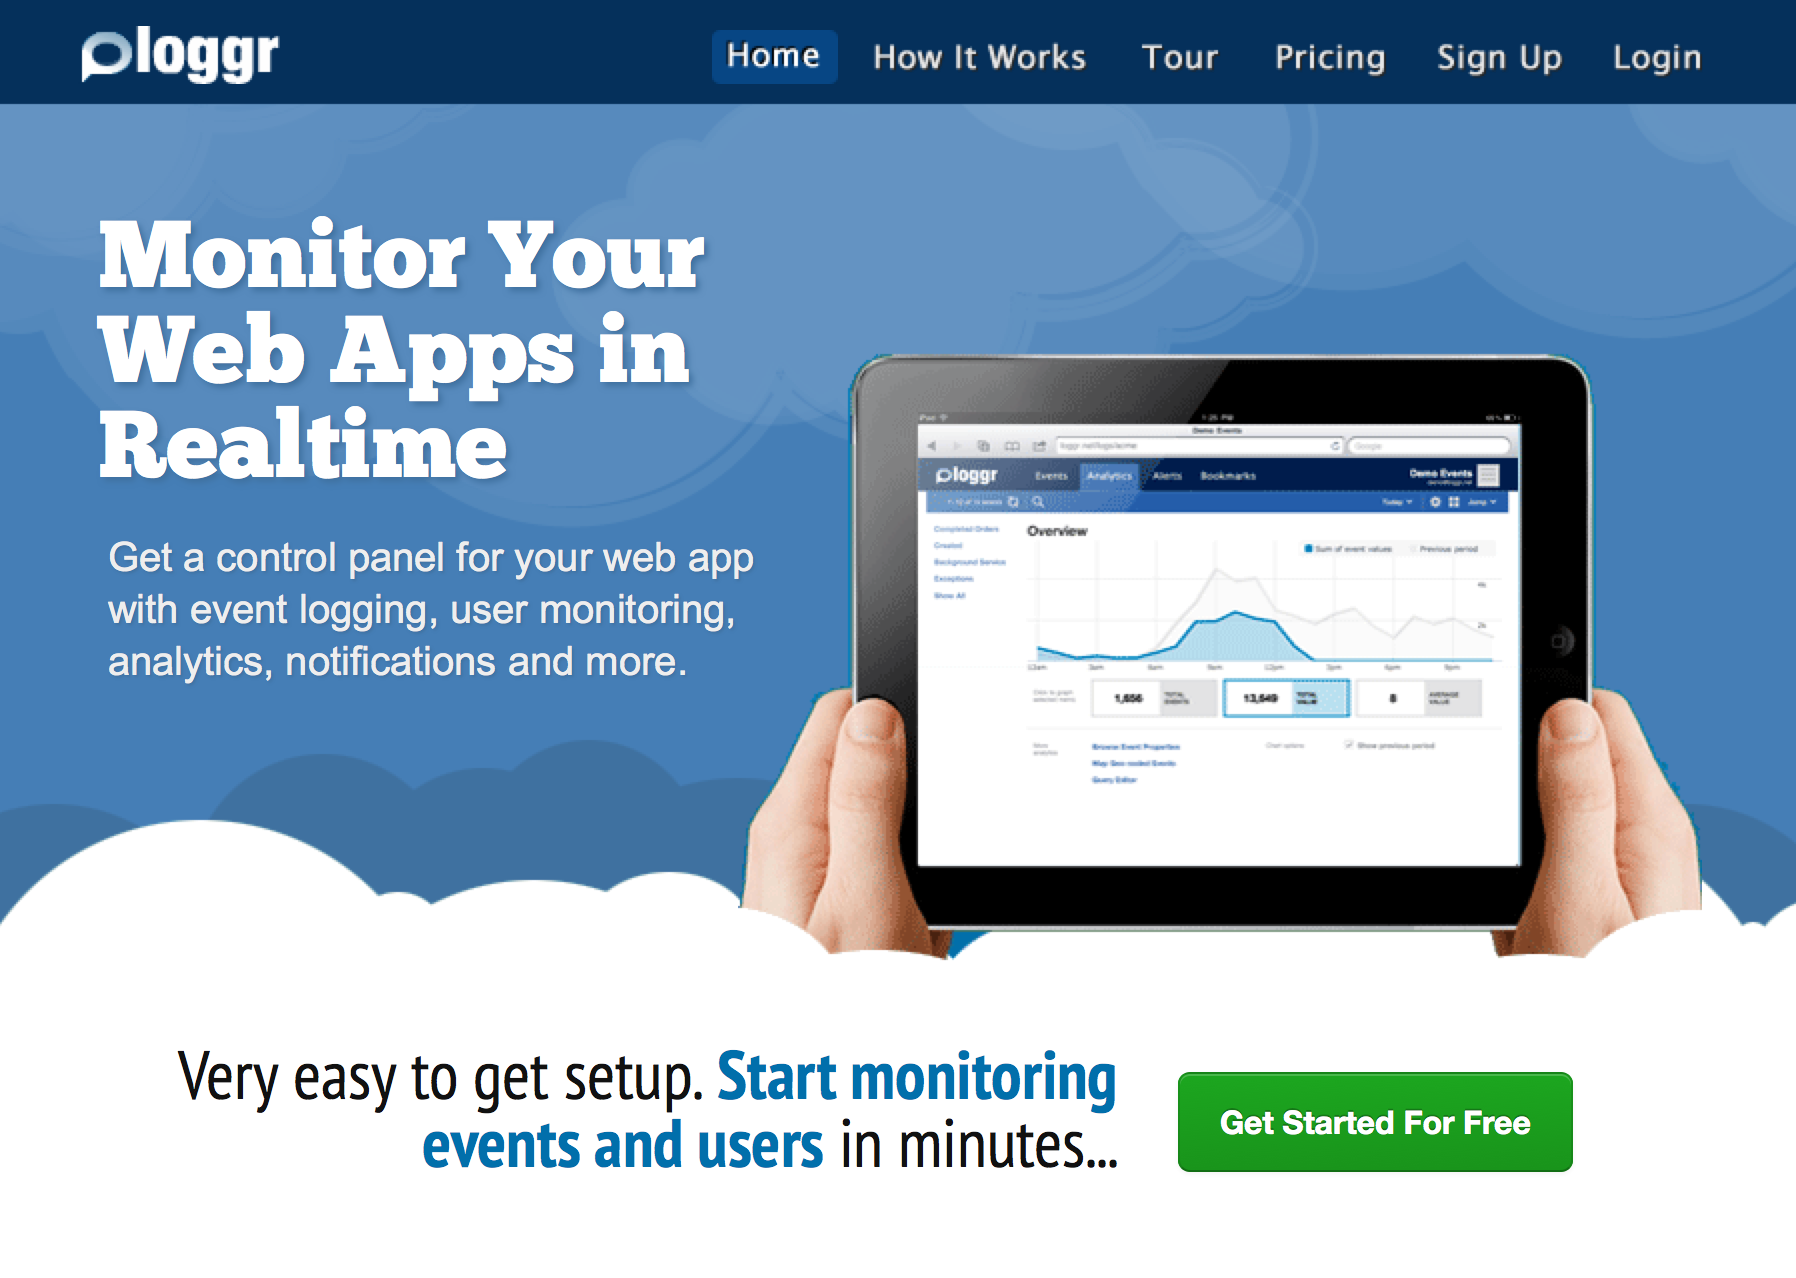
For Measures
This target writes Measures to Riemann and is being used for sending metrics from SQLServerHealth, for example. Sending them to riemann gives a platform to start acting on what goes on in your system and can be a way to provide auto-scaling to your deployments based off of application metrics.
Riemann is built in Clojure, and so is its config, so it gives you an opportunity to try something new and learn a nice language.
Riemann monitors distributed systems. Riemann aggregates events from your servers and applications with a powerful stream processing language.
Install-Package Intelliplan.Logary.Riemann -Pre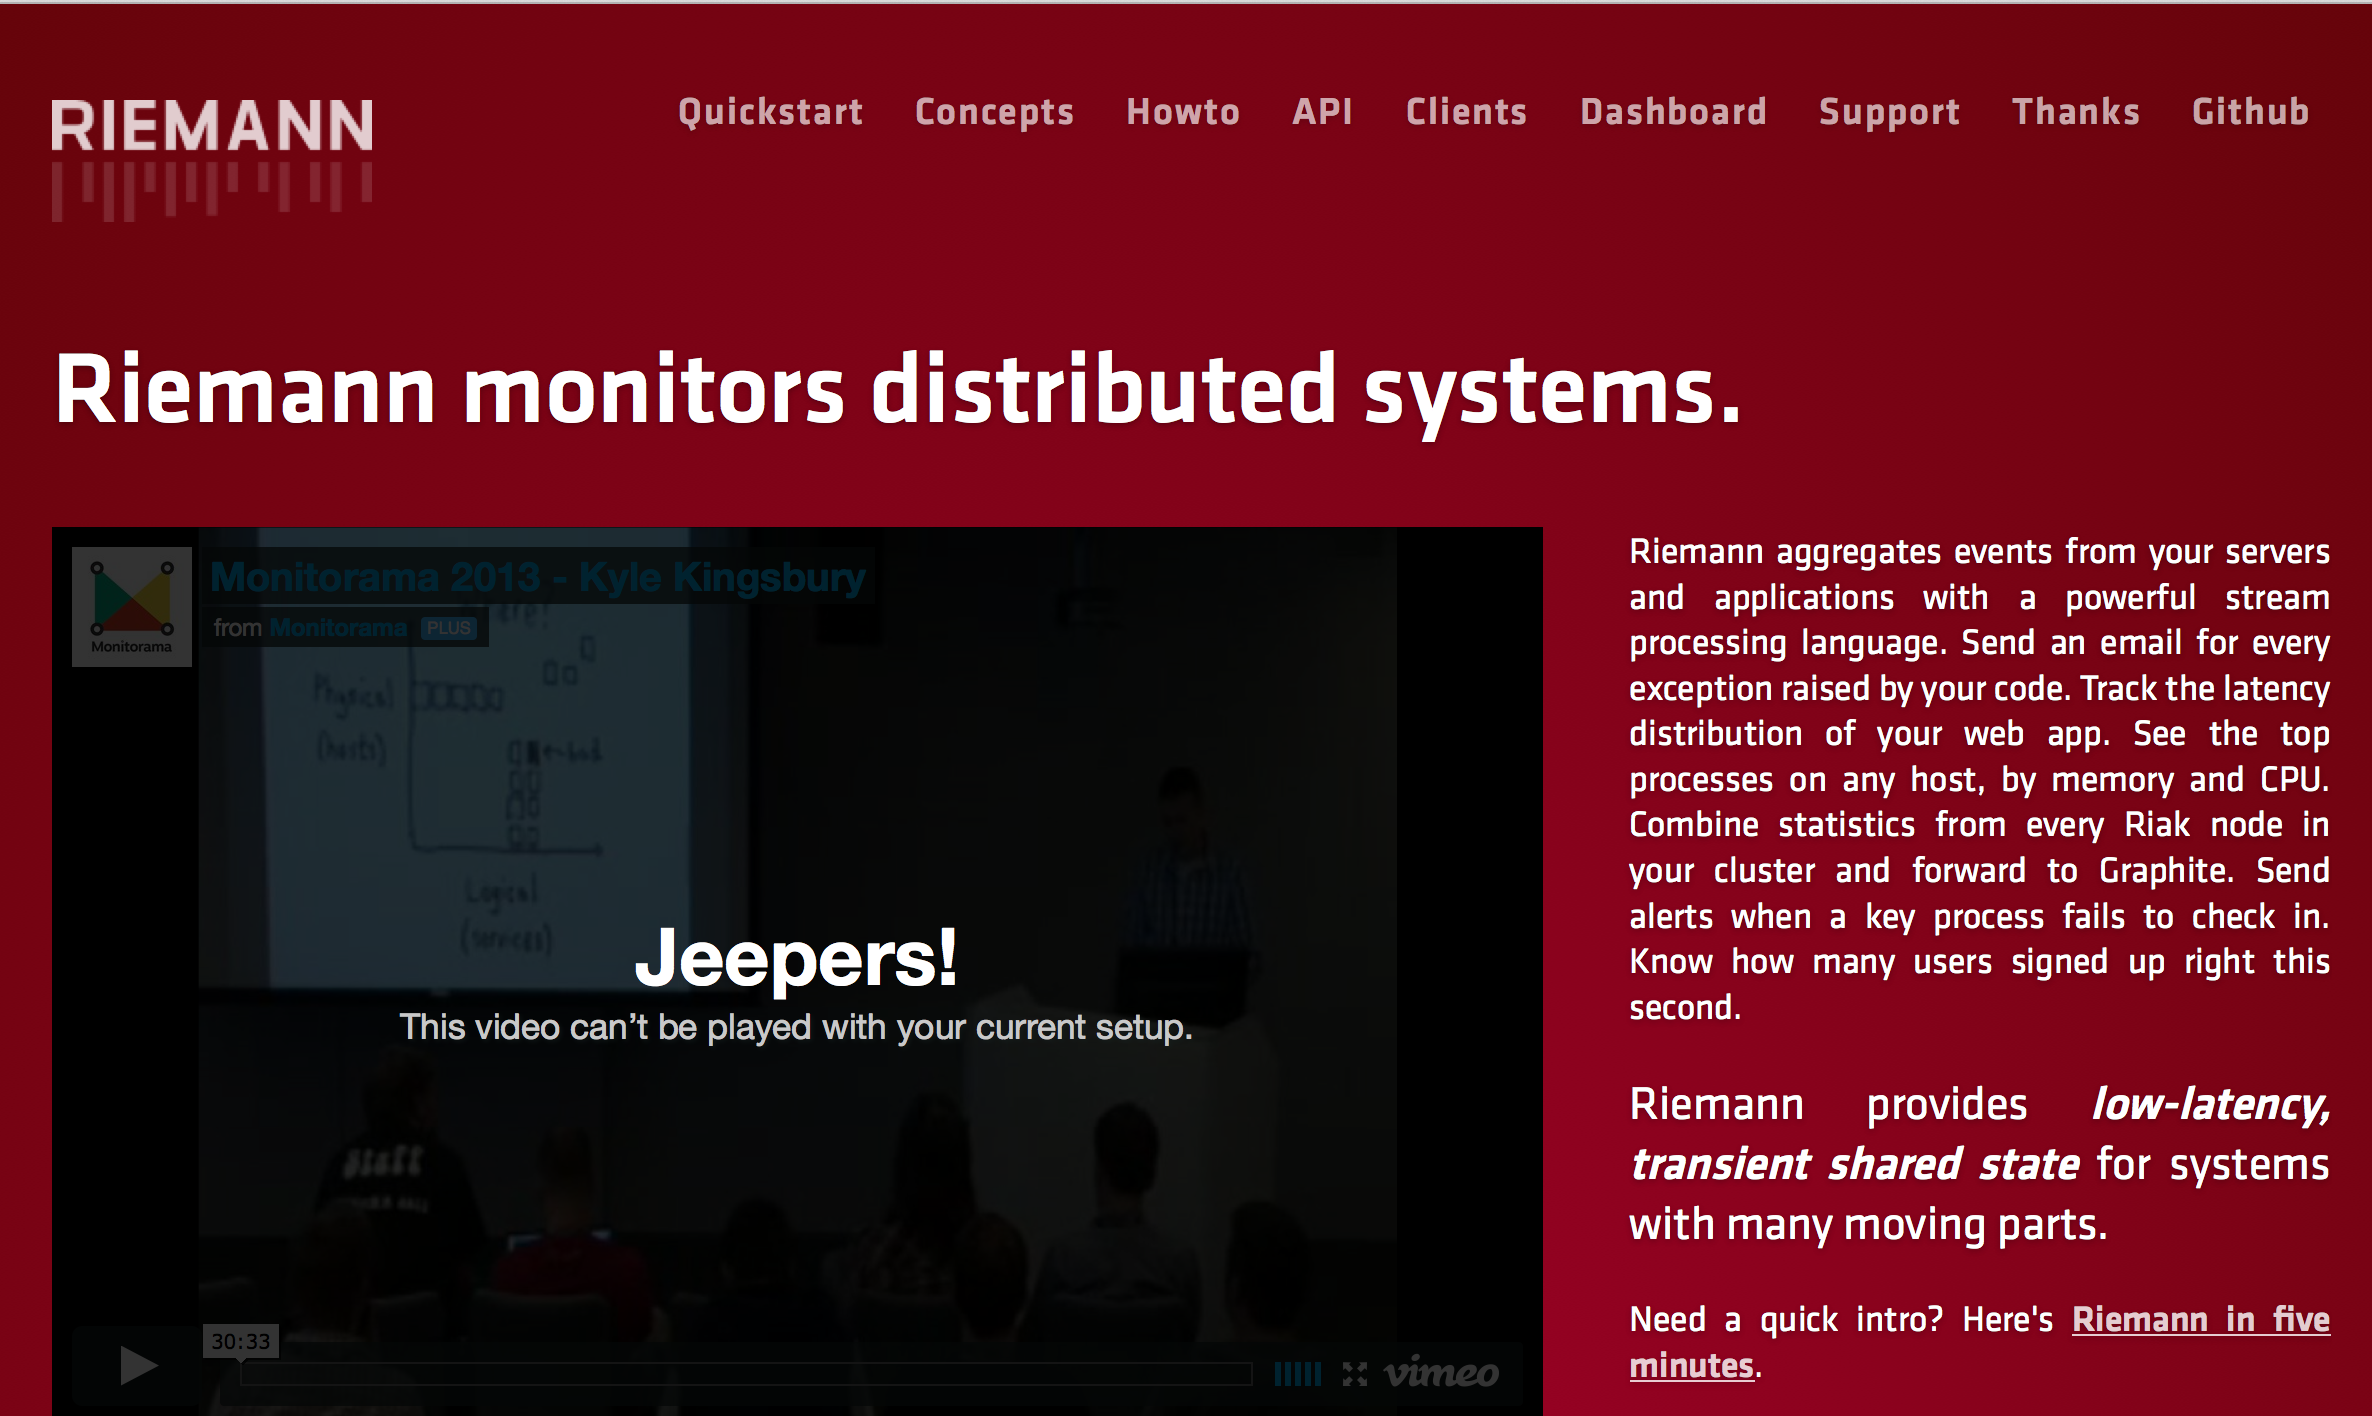
As a matter of fact, I have implemented a brand new .Net client for Riemann, to make it stable and to make it fit well with Logary's actor-based approach. More usage examples on this will follow.
For LogLines and Measures
This target logs asynchronously to a database, using ADO.Net. You can configure any connection factory through the target's configuration.
The target also comes with Logary.DB.Migrations that set up the database state for both logs and metrics on boot, if not already existent.
Install-Package Intelliplan.Logary.DB -Pre
Install-Package Intelliplan.Logary.DB.Migrations -PreFor LogLines and Measures
Nimrod is a metrics server based on log processing - as such it can handle both LogLines and Measures.
Nimrod is a metrics server purely based on log processing: hence, it doesn't affect the way you write your applications, nor has it any side effect on them.
Part of the core assembly:
Install-Package Intelliplan.Logary -Pre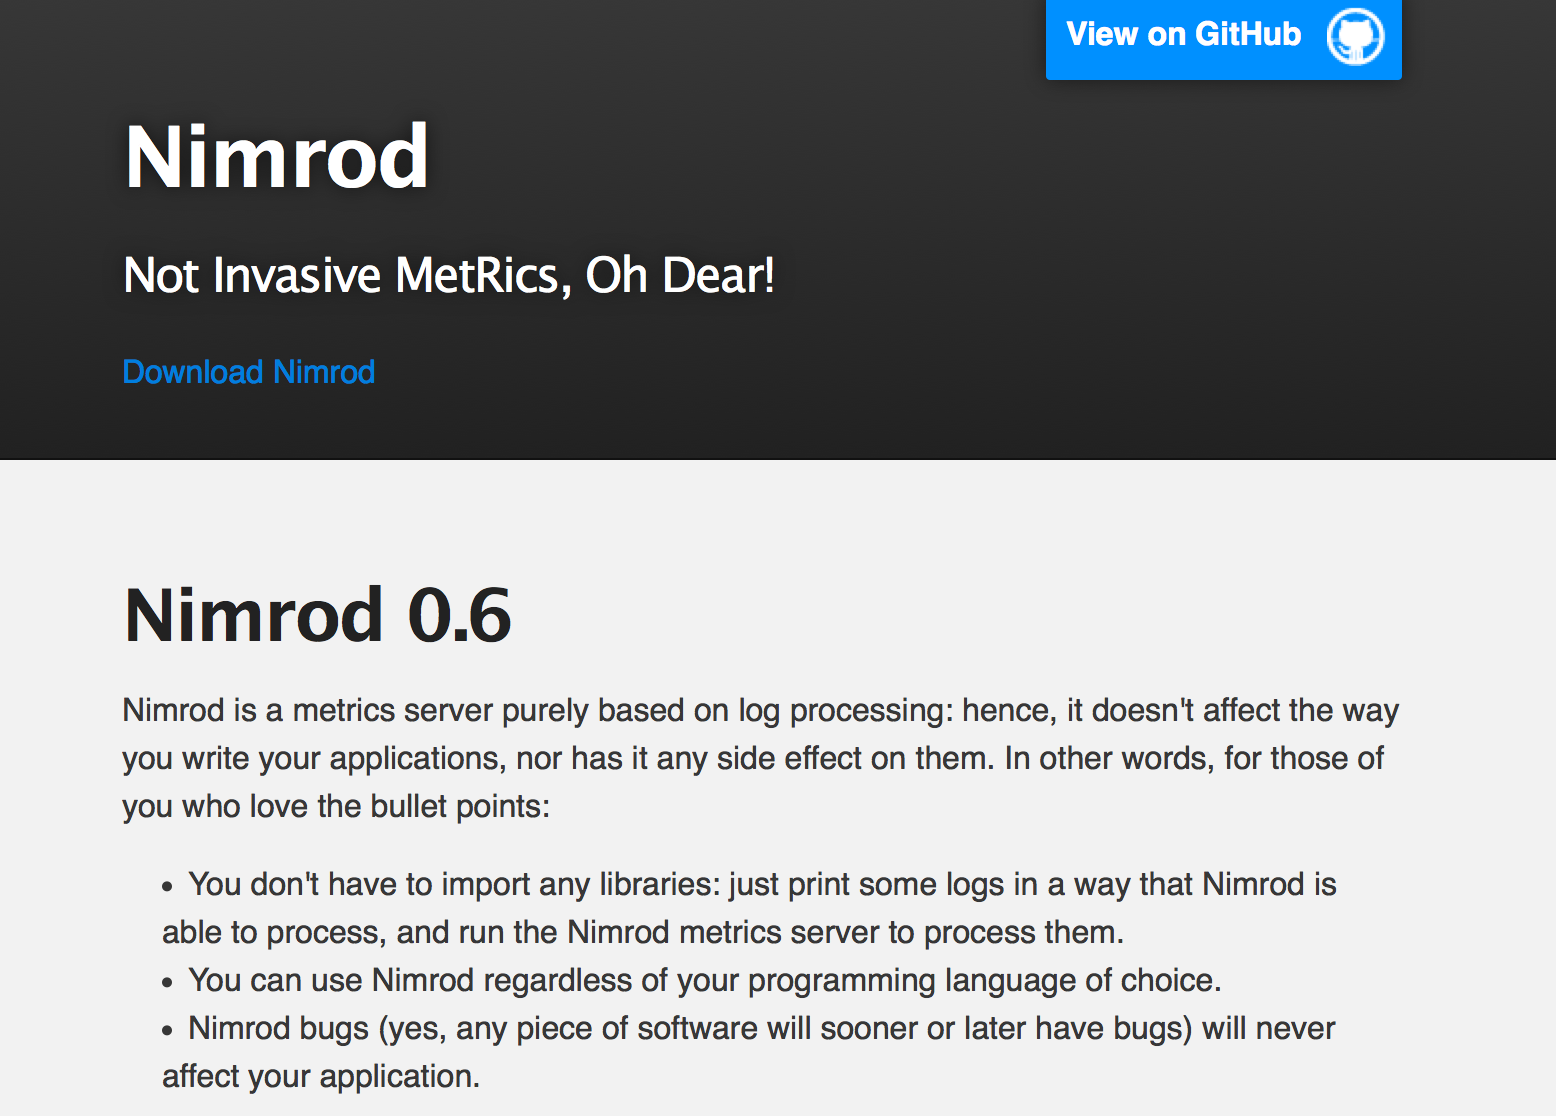
Work in progress - aims to provide the same dashboard as Metrics.Net, allowing you runtime insight into your programs.
Install-Package Intelliplan.Logary.Dash -PreThe dashboard uses the awesome F# web server suave.io.
For LogLines - and adds Spans
Currently work in progress: LogLines and Measures become annotations to Spans which are correlated in process and then sent through Thrift to the Zipkin server as Spans/traces.
Zipkin is a distributed tracing system that helps us gather timing data for all the disparate services at Twitter. It manages both the collection and lookup of this data through a Collector and a Query service. We closely modelled Zipkin after the Google Dapper paper. Follow @ZipkinProject for updates.
Install-Package Intelliplan.Logary.Zipkin -Pre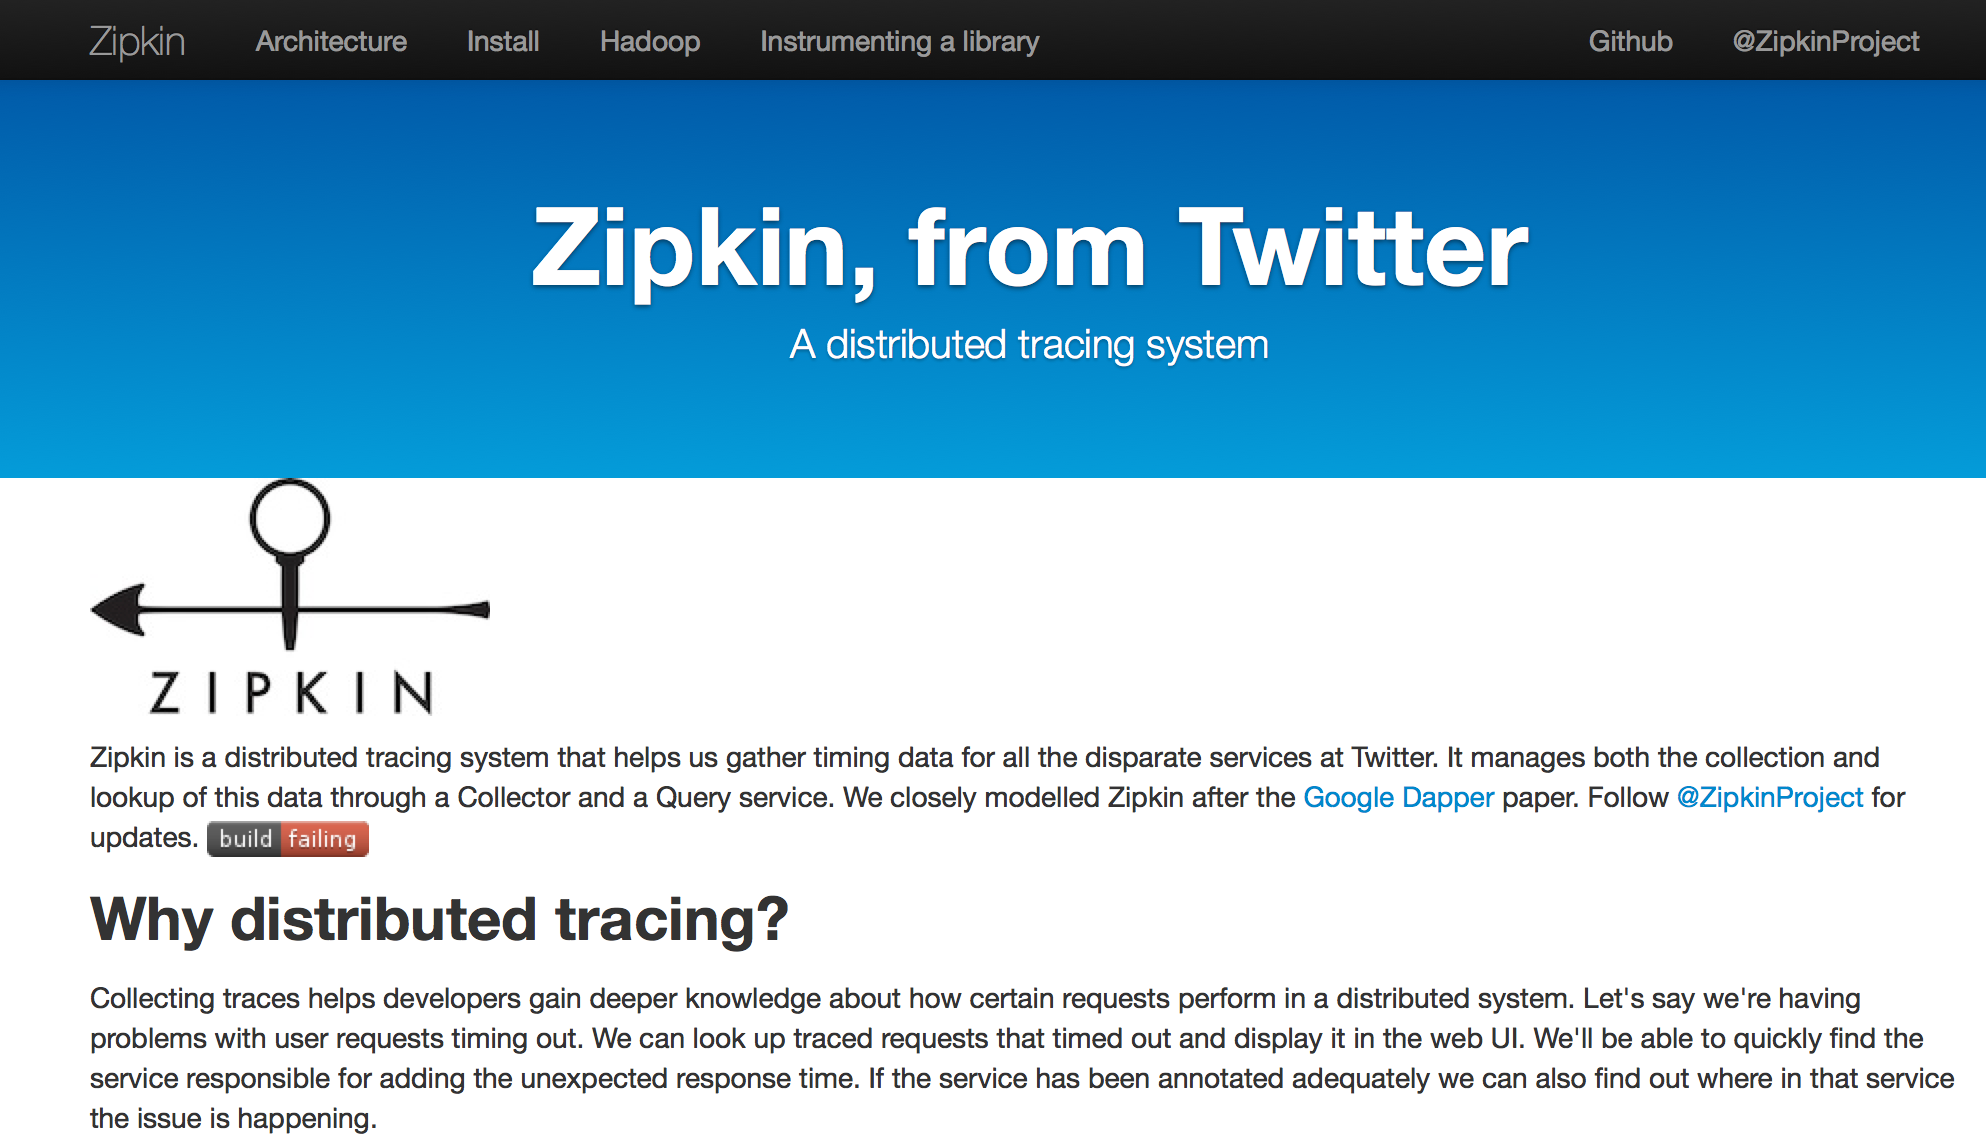
Adapter for getting logs from Suave.
Suave is inspired in the simplicity of Happstack and born out of the necessity of embedding web server capabilities in my own applications. Still in its early stages Suave supports HTTPS, multiple TCP/IP bindings, Basic Access Authentication, Keep-Alive and HTTP compression.
Suave also takes advantage of F# asynchronous workflows to perform non-blocking IO. In fact, Suave is written in a completely non-blocking fashion throughout. Suave runs on Linux, OS X and Windows flawlessly.
Install-Package Intelliplan.Logary.Suave -Pre
Adapter for getting logs from Topshelf.
Topshelf is a Windows Services adapter - useful if you're building cross-platform applications with albacore, because you can package the executable inside either a RPM or a Chocolatey package - then on Windows you install it and on unix you just run the exe with a service runner like Supervisord.
Install-Package Intelliplan.Logary.Topshelf -Pre
Adapter for getting logs from log4net into Logary.
Services are Windows or Linux services aimed to provide a persistent facility for you who are deploying your software and need to monitor it. Currently there is a single service: SQLServerHealth.
This service is responsible for connecting using SSPI/Integrated Security to the database server that it is running on, and query the master database for performance related data.
The queries are remembered and the timestamps of them used to send a stream of deltas - gauges if you want - to a target - currently Riemann - but configurable in code.
Are you interested in maintaining a target? Let me know or file a PR demonstrating your work.
Assuming you have Ruby 1.9.3 or later installed:
git clone git://github.com/logary/logary.git
cd logary
git submodule update --init
bundle && bundle exec rake
Coding style: pascalCase, 2 space intent. Use feature branches, PR against master. Use immutable data structures and tail recursion.
Use module Logary.MyModule or module Logary.SubNs.MyModule, not:
namespace Logary.SubNs

module MyModule =
  ...
If introducing a new type + corresponding module (see Measure.fs for example):
Two-phase configuration; first create immutable configuration, then compile it. Second step: create running instances of everything from the configuration. This ensures that a logary instance is correct by construction.
Moving towards a dashboard inside the service at hand.
Creating the infrastructure to hoise PerformanceCounter and /proc polling
and continuous running on SQL statements into a probe.
- Make metric an actor interface like probe
- Make probe similar to metric at first
- Create a scheduling actor that can run
sampleon the probes and metrics - A console text-writer target for the above sample
Handling of histograms as opposed to simple reservoirs of data?
Tying metrics, probes, health checks together with targets (reporters) and the registry (+ scheduler).
- Register and unregister sampled metric in
Registry - Register and unregister sampled probe in
Registry - Register and unregister sampled health check in
Registry - All three above are never sampled unless:
- Use a
Ruleto connect a metric to a target, by specifying what data point to use as a gauge. This just calls get_value on a metric above.
When the infrastructure is in place, we can create probes that solve common problems.
- Proof of concept probe that uses Göran's SQL for SQL Server to continuously report metrics.
- Document how metrics, probes and health checks work and how they differ
- Document order of initialisation
- Document how to create custom (metric|probe|health check)
- Document CLR perf counters, finish writing most common counters
- Create health check samples
- Create probe samples and handling failing external subsystems?
Colin doing work to freeze API
The above is useless without a nice way to report the values. Create an in-app dashboard that can be used to access the histograms, guages and timers.
Let's just use the Apache 2.0 licensed Metrics.Net dashboard.
Extend with JsonDiffPatch to avoid sending full state every time.
Instead of polling, open a Server-Sent Event socket and get all patches from there, continuously applying it to the in-memory rep.
Make sure we can report same data:
{
  "Timestamp":"2014-07-26T22:54:52.6894+02:00",
  "Gauges":{
      ".NET Mb in all Heaps":732.27,
      ".NET Time in GC":7.94,
      "Contention Rate / Sec":0.00,
      "Exceptions Thrown / Sec":0.00,
      "Logical Threads":28.00,
      "Mb in all Heaps":4.36,
      "Physical Threads":25.00,
      "Queue Length / sec":0.00,
      "SampleMetrics.DataValue":3628800.00,
      "System AvailableRAM":1245.00,
      "System CPU Usage":27.55,
      "System Disk Reads/sec":0.01,
      "System Disk Writes/sec":0.00,
      "Time in GC":0.06,
      "Total Exceptions":465.00
    },
  "Counters":{
      "NancyFx.ActiveRequests":0,
      "SampleMetrics.ConcurrentRequests":7,
      "SampleMetrics.Requests":730
    },
  "Meters":{
      "NancyFx.Errors":{
          "Count":0,
          "MeanRate":0.00,
          "OneMinuteRate":0.00,
          "FiveMinuteRate":0.00,
          "FifteenMinuteRate":0.00
        },
      "SampleMetrics.Requests":{
          "Count":730,
          "MeanRate":3.82,
          "OneMinuteRate":3.93,
          "FiveMinuteRate":4.98,
          "FifteenMinuteRate":5.59
        }
    },
  "Histograms":{
      "NancyFx.PostAndPutRequestsSize":{
          "Count":0,
          "LastValue":0.00,
          "Min":0.00,
          "Mean":0.00,
          "Max":0.00,
          "StdDev":0.00,
          "Median":0.00,
          "Percentile75":0.00,
          "Percentile95":0.00,
          "Percentile98":0.00,
          "Percentile99":0.00,
          "Percentile999":0.00,
          "SampleSize":0
        },
      "SampleMetrics.ResultsExample":{
          "Count":730,
          "LastValue":3471.00,
          "Min":-4942.00,
          "Mean":105.35,
          "Max":4995.00,
          "StdDev":2866.55,
          "Median":213.00,
          "Percentile75":2576.00,
          "Percentile95":4530.00,
          "Percentile98":4934.00,
          "Percentile99":4939.00,
          "Percentile999":4995.00,
          "SampleSize":730
        },
      "SampleModule.TestRequest.Size":{
          "Count":0,
          "LastValue":0.00,
          "Min":0.00,
          "Mean":0.00,
          "Max":0.00,
          "StdDev":0.00,
          "Median":0.00,
          "Percentile75":0.00,
          "Percentile95":0.00,
          "Percentile98":0.00,
          "Percentile99":0.00,
          "Percentile999":0.00,
          "SampleSize":0
        },
      "SampleModule.TestRequestSize":{
          "Count":0,
          "LastValue":0.00,
          "Min":0.00,
          "Mean":0.00,
          "Max":0.00,
          "StdDev":0.00,
          "Median":0.00,
          "Percentile75":0.00,
          "Percentile95":0.00,
          "Percentile98":0.00,
          "Percentile99":0.00,
          "Percentile999":0.00,
          "SampleSize":0
        }
    },
  "Timers":{
      "NancyFx.GET [/metrics/health]":{
          "Rate":{
              "Count":36,
              "MeanRate":0.19,
              "OneMinuteRate":0.21,
              "FiveMinuteRate":0.20,
              "FifteenMinuteRate":0.20
            },
          "Histogram":{
              "Count":36,
              "LastValue":425.69,
              "Min":330.85,
              "Mean":382.34,
              "Max":435.18,
              "StdDev":26.54,
              "Median":381.06,
              "Percentile75":403.76,
              "Percentile95":427.11,
              "Percentile98":435.18,
              "Percentile99":435.18,
              "Percentile999":435.18,
              "SampleSize":36
            }
        },
      "NancyFx.GET [/metrics/json]":{
          "Rate":{
              "Count":732,
              "MeanRate":3.94,
              "OneMinuteRate":4.32,
              "FiveMinuteRate":2.44,
              "FifteenMinuteRate":1.56
            },
          "Histogram":{
              "Count":732,
              "LastValue":3.79,
              "Min":2.31,
              "Mean":7.55,
              "Max":408.84,
              "StdDev":19.57,
              "Median":3.31,
              "Percentile75":3.92,
              "Percentile95":39.78,
              "Percentile98":61.07,
              "Percentile99":71.70,
              "Percentile999":408.84,
              "SampleSize":732
            }
        },
      "NancyFx.GET [/metrics]":{
          "Rate":{
              "Count":3,
              "MeanRate":0.02,
              "OneMinuteRate":0.02,
              "FiveMinuteRate":0.11,
              "FifteenMinuteRate":0.16
            },
          "Histogram":{
              "Count":3,
              "LastValue":0.13,
              "Min":0.13,
              "Mean":26.05,
              "Max":77.86,
              "StdDev":44.87,
              "Median":0.16,
              "Percentile75":77.86,
              "Percentile95":77.86,
              "Percentile98":77.86,
              "Percentile99":77.86,
              "Percentile999":77.86,
              "SampleSize":3
            }
        },
      "NancyFx.Requests":{
          "Rate":{
              "Count":771,
              "MeanRate":4.03,
              "OneMinuteRate":4.56,
              "FiveMinuteRate":2.11,
              "FifteenMinuteRate":0.95
            },
          "Histogram":{
              "Count":771,
              "LastValue":3.78,
              "Min":0.11,
              "Mean":25.10,
              "Max":435.15,
              "StdDev":81.60,
              "Median":3.33,
              "Percentile75":4.15,
              "Percentile95":79.62,
              "Percentile98":388.93,
              "Percentile99":408.69,
              "Percentile999":435.15,
              "SampleSize":771
            }
        },
      "SampleMetrics.Requests":{
          "Rate":{
              "Count":723,
              "MeanRate":3.78,
              "OneMinuteRate":3.83,
              "FiveMinuteRate":4.64,
              "FifteenMinuteRate":5.09
            },
          "Histogram":{
              "Count":723,
              "LastValue":472.59,
              "Min":10.99,
              "Mean":1393.96,
              "Max":2998.03,
              "StdDev":875.90,
              "Median":1282.13,
              "Percentile75":2145.02,
              "Percentile95":2892.10,
              "Percentile98":2949.10,
              "Percentile99":2994.81,
              "Percentile999":2998.03,
              "SampleSize":217
            }
        },
      "SampleModule.TestRequest.Time":{
          "Rate":{
              "Count":0,
              "MeanRate":0.00,
              "OneMinuteRate":0.00,
              "FiveMinuteRate":0.00,
              "FifteenMinuteRate":0.00
            },
          "Histogram":{
              "Count":0,
              "LastValue":0.00,
              "Min":0.00,
              "Mean":0.00,
              "Max":0.00,
              "StdDev":0.00,
              "Median":0.00,
              "Percentile75":0.00,
              "Percentile95":0.00,
              "Percentile98":0.00,
              "Percentile99":0.00,
              "Percentile999":0.00,
              "SampleSize":0
            }
        }
    },
  "Units":{
      "Gauges":{
          ".NET Mb in all Heaps":"Mb",
          ".NET Time in GC":"%",
          "Contention Rate / Sec":"Attempts/s",
          "Exceptions Thrown / Sec":"Exceptions/s",
          "Logical Threads":"Threads",
          "Mb in all Heaps":"Mb",
          "Physical Threads":"Threads",
          "Queue Length / sec":"Threads/s",
          "SampleMetrics.DataValue":"$",
          "System AvailableRAM":"Mb",
          "System CPU Usage":"%",
          "System Disk Reads/sec":"kb/s",
          "System Disk Writes/sec":"kb/s",
          "Time in GC":"%",
          "Total Exceptions":"Exceptions"
        },
      "Counters":{
          "NancyFx.ActiveRequests":"ActiveRequests",
          "SampleMetrics.ConcurrentRequests":"Requests",
          "SampleMetrics.Requests":"Requests"
        },
      "Meters":{
          "NancyFx.Errors":"Errors/s",
          "SampleMetrics.Requests":"Requests/s"
        },
      "Histograms":{
          "NancyFx.PostAndPutRequestsSize":"bytes",
          "SampleMetrics.ResultsExample":"Items",
          "SampleModule.TestRequest.Size":"bytes",
          "SampleModule.TestRequestSize":"bytes"
        },
      "Timers":{
          "NancyFx.GET [/metrics/health]":{
              "Rate":"Requests/s",
              "Duration":"ms"
            },
          "NancyFx.GET [/metrics/json]":{
              "Rate":"Requests/s",
              "Duration":"ms"
            },
          "NancyFx.GET [/metrics]":{
              "Rate":"Requests/s",
              "Duration":"ms"
            },
          "NancyFx.Requests":{
              "Rate":"Requests/s",
              "Duration":"ms"
            },
          "SampleMetrics.Requests":{
              "Rate":"Requests/s",
              "Duration":"ms"
            },
          "SampleModule.TestRequest.Time":{
              "Rate":"Requests/s",
              "Duration":"ms"
            }
        }
    }
}
The first observation is that almost all metrics stem from individual events which have a path, value and unit. The path is what they are named and where the event occurred. The value is often 'one', meaning that it's a singular event that occurred. Sometimes, more than one unit is the value, e.g. when a user 'ordered two books' - a single event but with a non-zero value. The unit can be things like 'a unit of something' such as a 'request' or a 'click', or it can be a duration like 'it took 2ms to call the db and get a response' -- however, it can also be observed that a duration is really two individual events of a unit value; 'created connection to db' and 'closed connection to db after reading', both of which are instantaneous first-order events.
Secondary-order events are therefore things that something else has analysed, such as the 'mean duration of sql statement execution' as read from a 'resource', such as a service's database. It's a measure of interest to the service that you are writing, as you depend on the database's performance to make your service work. However, you don't have the first-order instant-events that go into creating the second-order event that you observe, because those two events are not being broadcast back to your service (sql statement execution started, sql statement execution ended) and possibly doing that would cause too much data to be sent. We'll get back to second-order events soon, but keep in mind that they are already processed first-order events that most often don't originate from our own service.
An event is either a Measure or a LogLine. A Metric is a single or many processed measures, but a metric is also an event when the value of the metric is one.
Your service depends on other services to work; they are 'attached resources' (12factor app). You have both required resources and optional resources. Required resources you need to have your service running, but optional resources you can live without by providing 'dumbed down' data as output to queries and requests.
You can yourself be an attached resource of other (upstream) services, or in other words you can build 'servers' that service 'clients'.
When you make a request a resource from your service you often expect to get a response back, or at the very least, an ACK that your request was successfully received and parsed. The logging of such interactions between services is called distributed tracing.
When you start sending a request you can produce an event with a corresponding tag, and when you receive the response in full (or in part if it's a streaming response) you produce another event. It's up to Logary to coalesce these two events into a Span (see Dapper/ZipKin) and generate the expected request/span id.
By tracking these two events as a Span, we can get an idea about what CodaHaleMetrics talks about as a 'Timer'. In CodeHaleMetrics' vocabulary it is the 'rate that a particular piece of code is called and the distribution of its duration'. In order to understand what that means, we have to introduce two more concepts besides the Span and events that we have already discussed.
The Meter is a derived statistic from more than one Measure/event; the rate of events over time, e.g. 'requests per second'. In Logary we have two options for dealing with Meters: either ship the raw Measures as data to Riemann or Graphite and let those single-purpose services/resources deal with the roll-up calculation (monoidal in nature!), or alternatively do the calculation in process based off of a Reservoir, like CodaHaleMetrics does it. However, we don't want to expose any 'object' or 'interface' that is a 'Meter' because it's not a value that is given from user code (i.e. the code that you, dear reader, write as a part of using Logary). Instead, you can register actors in the Registry that calculate the Meter function that gives you averages and time-decaying moving averages.
The second concept we need to look at to understand Spans and how they can be used to track rates (Meters) and distributations; is Histograms. A histogram is also a calculated value that measures the statistical distribution of values in a stream of data. A Histogram function places values it observes into buckets while allocating those buckets on the fly; or in other words, it allows you to see the distribution of Measures in a frequency diagram.
So to get back to the Span abstraction; with the two input events, with their corresponding Instants (discrete points on the time line as seen by the computing node or CPU), lets us use the Meter and Histogram function to get more insight into our code as it is executing.
On top of allowing this insight based on only their underlying events, the tagging that must happen in client-server software allows Logary to figure our enough to attach LogLines/Annotations to the span, as well as to create a SpanTree that gives insight into points of possible parallelism and contention in a distributed system. (again, see the Dapper paper and ZipKin from Twitter).
As you read in the previous paragraph, spans can have attached annotations; that in logary are simple LogLines. A log line is a way to move meta-data about a context to a location where a programmer can inspect that meta-data to understand how his/her program is behaving in production. It's also simply called logging. However, what Logary gives you is a the conjunction of the above concepts in a single library. It allows you to use only a few concepts from your own code, but extract a wealth of data.
When building a modern distributes system you need to move the data off the computing nodes, or you will surely suffer the wrath of bad data locality, filled up disks and angry operations people. Not to mention problems of data correlation and obtruse RDP/SSH-ing into production nodes, which all-in-all is well worth avoiding. Logary is here to help, and it has implemented a whole range of targets to do exactly that.
The idea is that you should always be using the best tool for the job. For logging you should be using Logstash - send Logstash your logs and forget about them on the computing node.
For metrics you should be using Graphite - it allows you to use statistical functions on your data points, allows you to degrade the granularity of your data points over time to save space while still getting the jest of the long-term trends and finally allows you to browse the data/metrics in a nice GUI (even nicer if you put Grafana on top!).
For decisions and health of your services you should be using Riemann; it's a great Complex Event Processing (CEP) engine which allows you to do the similar statistical calculations on your data as Graphite does, except that it also can trigger events and send messages based on those calculations. That means that you don't have to write custom code to read and understand the Graphite graphs, but can implement that in sweet-Jesus-clojure on the Riemann side.
For example, if you have a continuous deployment pipeline set up, you may want to send events to Riemann any time you have an exception, let Riemann calculate the exception rate as a baseline and then compare that baseline to the exception rate of a newly deployed version; rolling the deploy back if the exception rate goes outside of, say, two standard deviations of the baseline. At least, this is what we're using Riemann for at Intelliplan.
That's three targets and counting. To help those of you who still want log output on your dev machine (who doesn't?), there are also TextWriter targets for e.g. the console and debugger, so you can use Logary for development.
Targets can react on the two things they are sent; either LogLines or Measures. How a targets acts it up to it, and there are Rules that decide whether a target should be sent a given LogLine or Measure, and those Rules are given to the configuration API at service startup, when you start Logary. Those rules are the only performance-optimisation that Logary does (but boy, is that a great optimisation!).
Targets are implemented as asynchronous F# actors and they are registered in the Registry and watched over by the Supervisor actor that is spawed when Logary is spawned. They have a OneByOne supervision policy attached to themselves, so that e.g. a TCP socket exception will trigger an actor restart.
In general, the idea is that targets should be super-simple to implement; a full implementation takes a senior developer about half an hour to write and comes ready with a config API and the above supervision, out of the box. More time can then be spent to test it or implement optimisations such as exception handling (actors are otherwise following the dogma; 'let it crash', so you don't necessarily have to handle exceptions). Time is also then spent on furthering the test suite coverage and writing a nice fluent API for C# (aka. FactoryApi).