Full-blown traffic monitoring of Cisco UCS servers using Grafana, InfluxDB and Telegraf.
Locations Dashboard

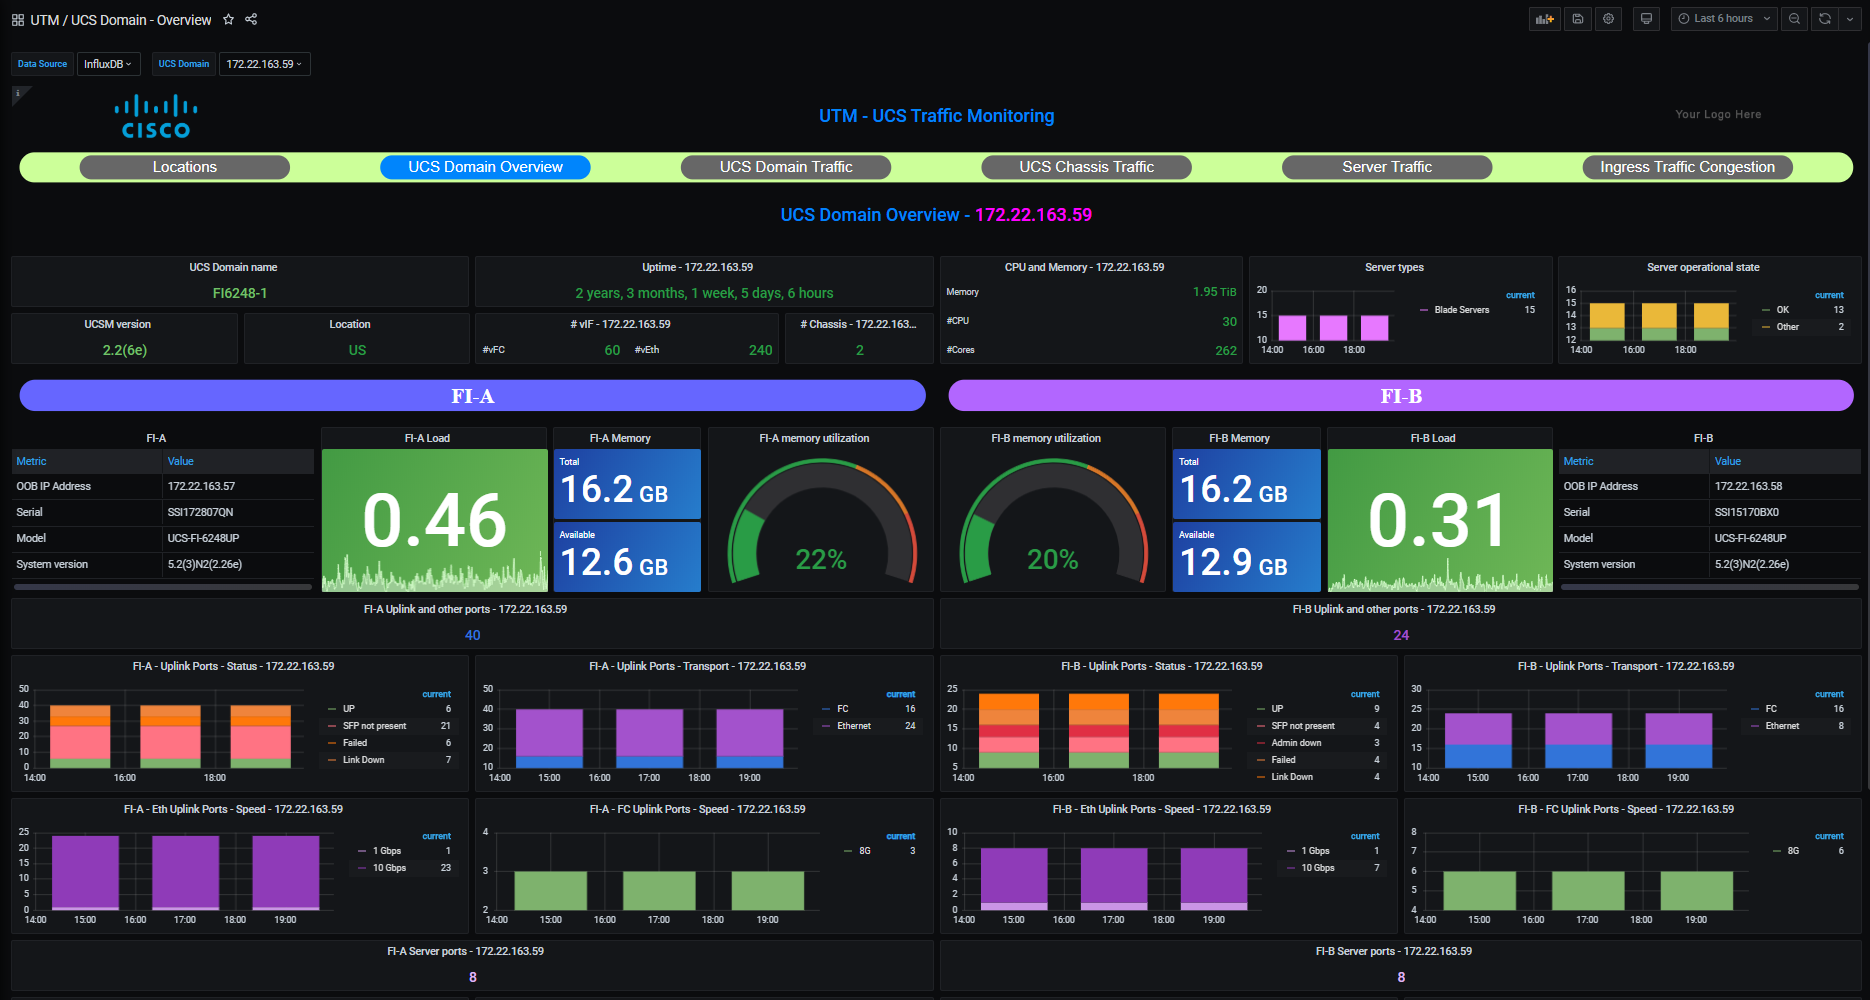
UCS Domains Overview
Top 10 ports, service profiles, etc.

Load Balance verification and root cause

Congestion Monitoring and detection

End-to-end mapping from vHBA/vNIC to FI uplink Port
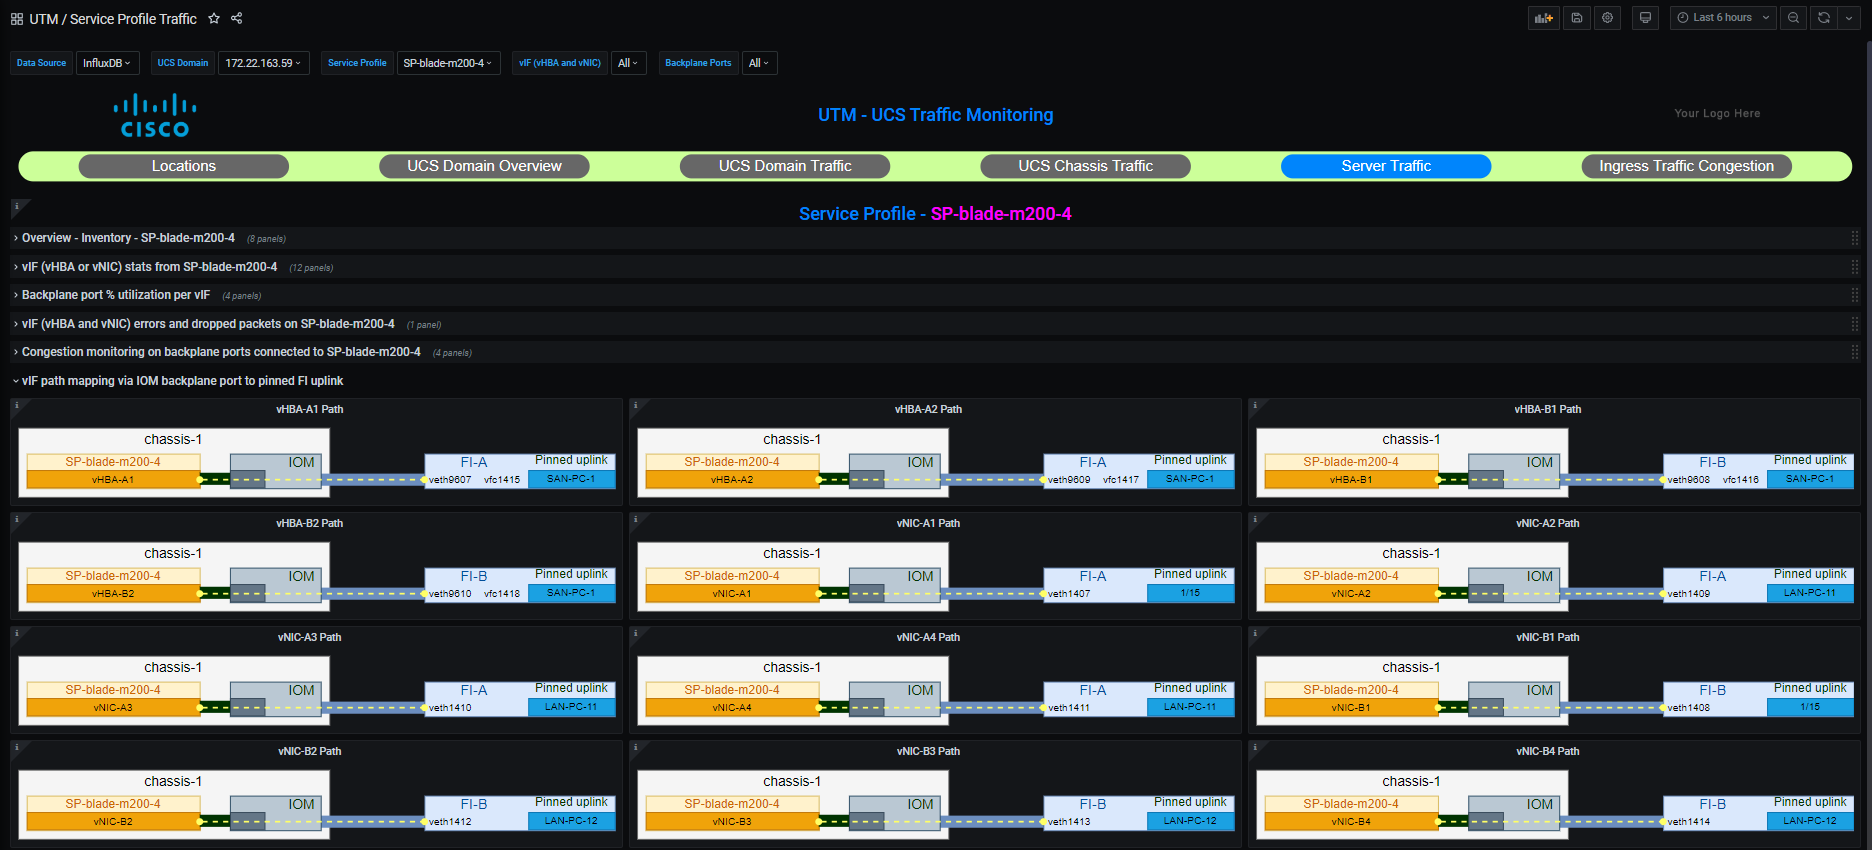
Integrated documentation with conceptual drawing and detailed explanations

Link utilization and errors

and much more...
- Data source: Cisco UCS Manager (UCSM), read-only account is enough
- Data receiver: Telegraf
- Data storage: InfluxDB, a time-series database
- Visualization: Grafana
- Tested OS: CentOS 7.x. Should work on other OS also.
- Python version: Version 3 only. Should be able to work on Python 2 also with minor modification.
Two options:
- DIY Installation: Self install the required packages (or take a look to ansible-install folder where you could let the machine work for you)
- OVA - Required packages are pre-installed on CentOS 7.6 OVA
- Install Telegraf
- Install InfluxDB
- Install Grafana. Install following plugins:
- Flowchart
- Pie Chart (using Pie chart v2 starting UTM v0.6)
- ePict panel (Not needed starting UTM v0.6)
- multistat (Not needed starting UTM v0.6)
- Install following Python modules
- Cisco UCSM Python SDK
- netmiko library
Download OVA from releases page. This is a CentOS 7.6 based OVA. Deployment is same as any other OVA that you have deployed before. Click here for detailed installation instructions of the UTM OVA. The OVA is based on v0.3. Upgrading to the latest must be your first step.
You are responsible to upgrade Grafana, InfluxDB, Telegraf, Python and other packages. Upgrading UTM is simple with one or two commands and doesn't take more than a few minutes. Please refer to respective packages for upgrade process. Please keep a watch on the security vulnerabilities and fixes.
ucs_traffic_monitor.py fetches metrics from Cisco UCS and stitches them. This file is invoked by telegraf exec input plugin every 60 seconds. Login credentials of UCS should be available in ucs_domains_group*.txt.
Try
$ python3 /usr/local/telegraf/ucs_traffic_monitor.py -hif you are running this for the first time.
Change/Add to your telegraf.conf file as below
[[inputs.exec]]
   interval = "60s"
   commands = [
       "python3 /usr/local/telegraf/ucs_traffic_monitor.py /usr/local/telegraf/ucs_domains.txt influxdb-lp -vv",
   ]
   timeout = "50s"
   data_format = "influx"
also update the global values like
  logfile = "/var/log/telegraf/telegraf.log"
  logfile_rotation_max_size = "10MB"
  logfile_rotation_max_archives = 5
This should be able to
- Pull metrics from UCS every 60 seconds
- Stitch them end-to-end between FI uplink ports and vNIC/vHBA on blade servers
- Write the data to InfluxDB
Import the dashboards into Grafana. That's all. UTM should be fully functional.
For detailed steps-by-step instructions, especially if you do not have prior experience with Grafana, InfluxDB and Telegraf, check out: Cisco UCS monitoring using Grafana, InfluxDB, Telegraf – UTM Installation
Click here to check out Cisco MDS Traffic Monitoring (MTM)
- My wife (Dimple) and kids (Manan and Kiara) while I took away precious weekend hours from you and invested in the development of UTM.
- Folks in the Cisco UCS business unit and TAC, who knowingly or unknowingly helped me to build UTM and also for awesome content on ciscolive.com.
- Colleagues and friends in Cisco (Art, Craig, Eugene, Mark and a long list of people) for the inspiration.
- End-users/customers: Philipe, Jason, Shawn, Ryan, Ian, and others for your great feedback.