This repo is forked from calendar-heatmap, with a few additional features and modificaitons:
- Support custom mouseover and mouseout event handlers
- Support custom date range (using start and end dates)
- UI and color scheme changes
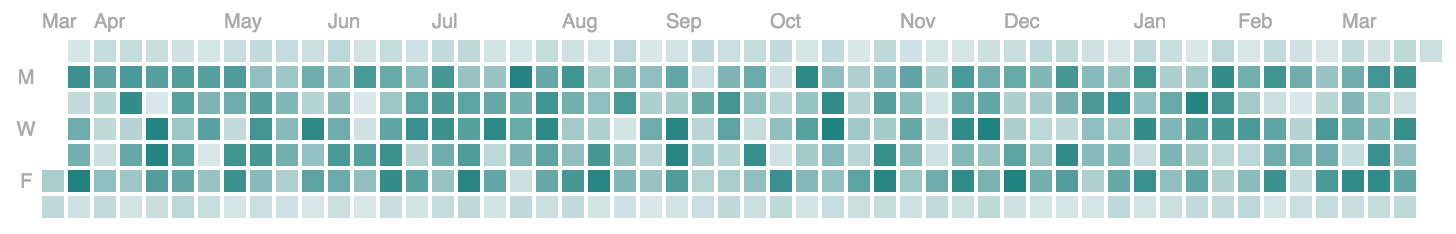
A d3.js heatmap representing time series data. Inspired by Github's contribution chart
Enable/disable tooltipEditing of tooltip textEditing of the cell gradient coloursConfiguration of the start/end datesAdd optional callback for click events on the day cellsAdd project to bower- Remove example and vendor folders to separate
gh-pagesbranch
| Property | Usage | Default | Required |
|---|---|---|---|
| data | Chart data | none | yes |
| dateRange | Array of continuous dates from start to end (see example below) | a year ago to now | no |
| selector | DOM selector to attach the chart to | body | no |
| colorRange | Minimum and maximum chart gradient colors | ['#D8E6E7', '#218380'] | no |
| tooltipEnabled | Option to render a tooltip | true | no |
| legendEnabled | Option to render a legend | true | no |
| onClick | callback function on day click events (see example below) | null | no |
| onMouseOver | callback function on day mouseover events (see example below) | null | no |
| onMouseOut | callback function on day mouseout events (see example below) | null | no |
1: Add d3.js and moment.js
2: Include calendar-heatmap.js and calendar-heatmap.css
<link rel="stylesheet" type="text/css" href="path/tocalendar-heatmap.css">
<script src="path/to/calendar-heatmap.js"></script>
3: Format the data so each array item has a date and count property.
As long as new Date() can parse the date string it's ok. Note - there all data should be rolled up into daily bucket granularity.
4: Configure the chart and render it
// chart data example
var chartData = [{
  date: valid Javascript date object,
  count: Number
}];
var chart1 = calendarHeatmap()
  .data(chartData)
  .dateRange(d3.time.days(new Date(2016, 0, 1), new Date(2017, 0, 1)))
  .selector('#chart-one')
  .colorRange(['#D8E6E7', '#218380'])
  .tooltipEnabled(true)
  .onClick(function (data) {
    console.log('onClick callback. Data:', data);
  })
  .onMouseOver(function(data) {
    // you can access the element via this
    console.log('onMouseOver callback. Data:', data);
  })
  .onMouseOut(function(data) {
    // you can access the element via this
    console.log('onMouseOut callback. Data:', data);
  });
chart1(); // render the chart...are very welcome!