Super basic monitoring suite with Influx and Grafana. Packaged with docker-compose.
This tool lets you track just about anything. Examples include:
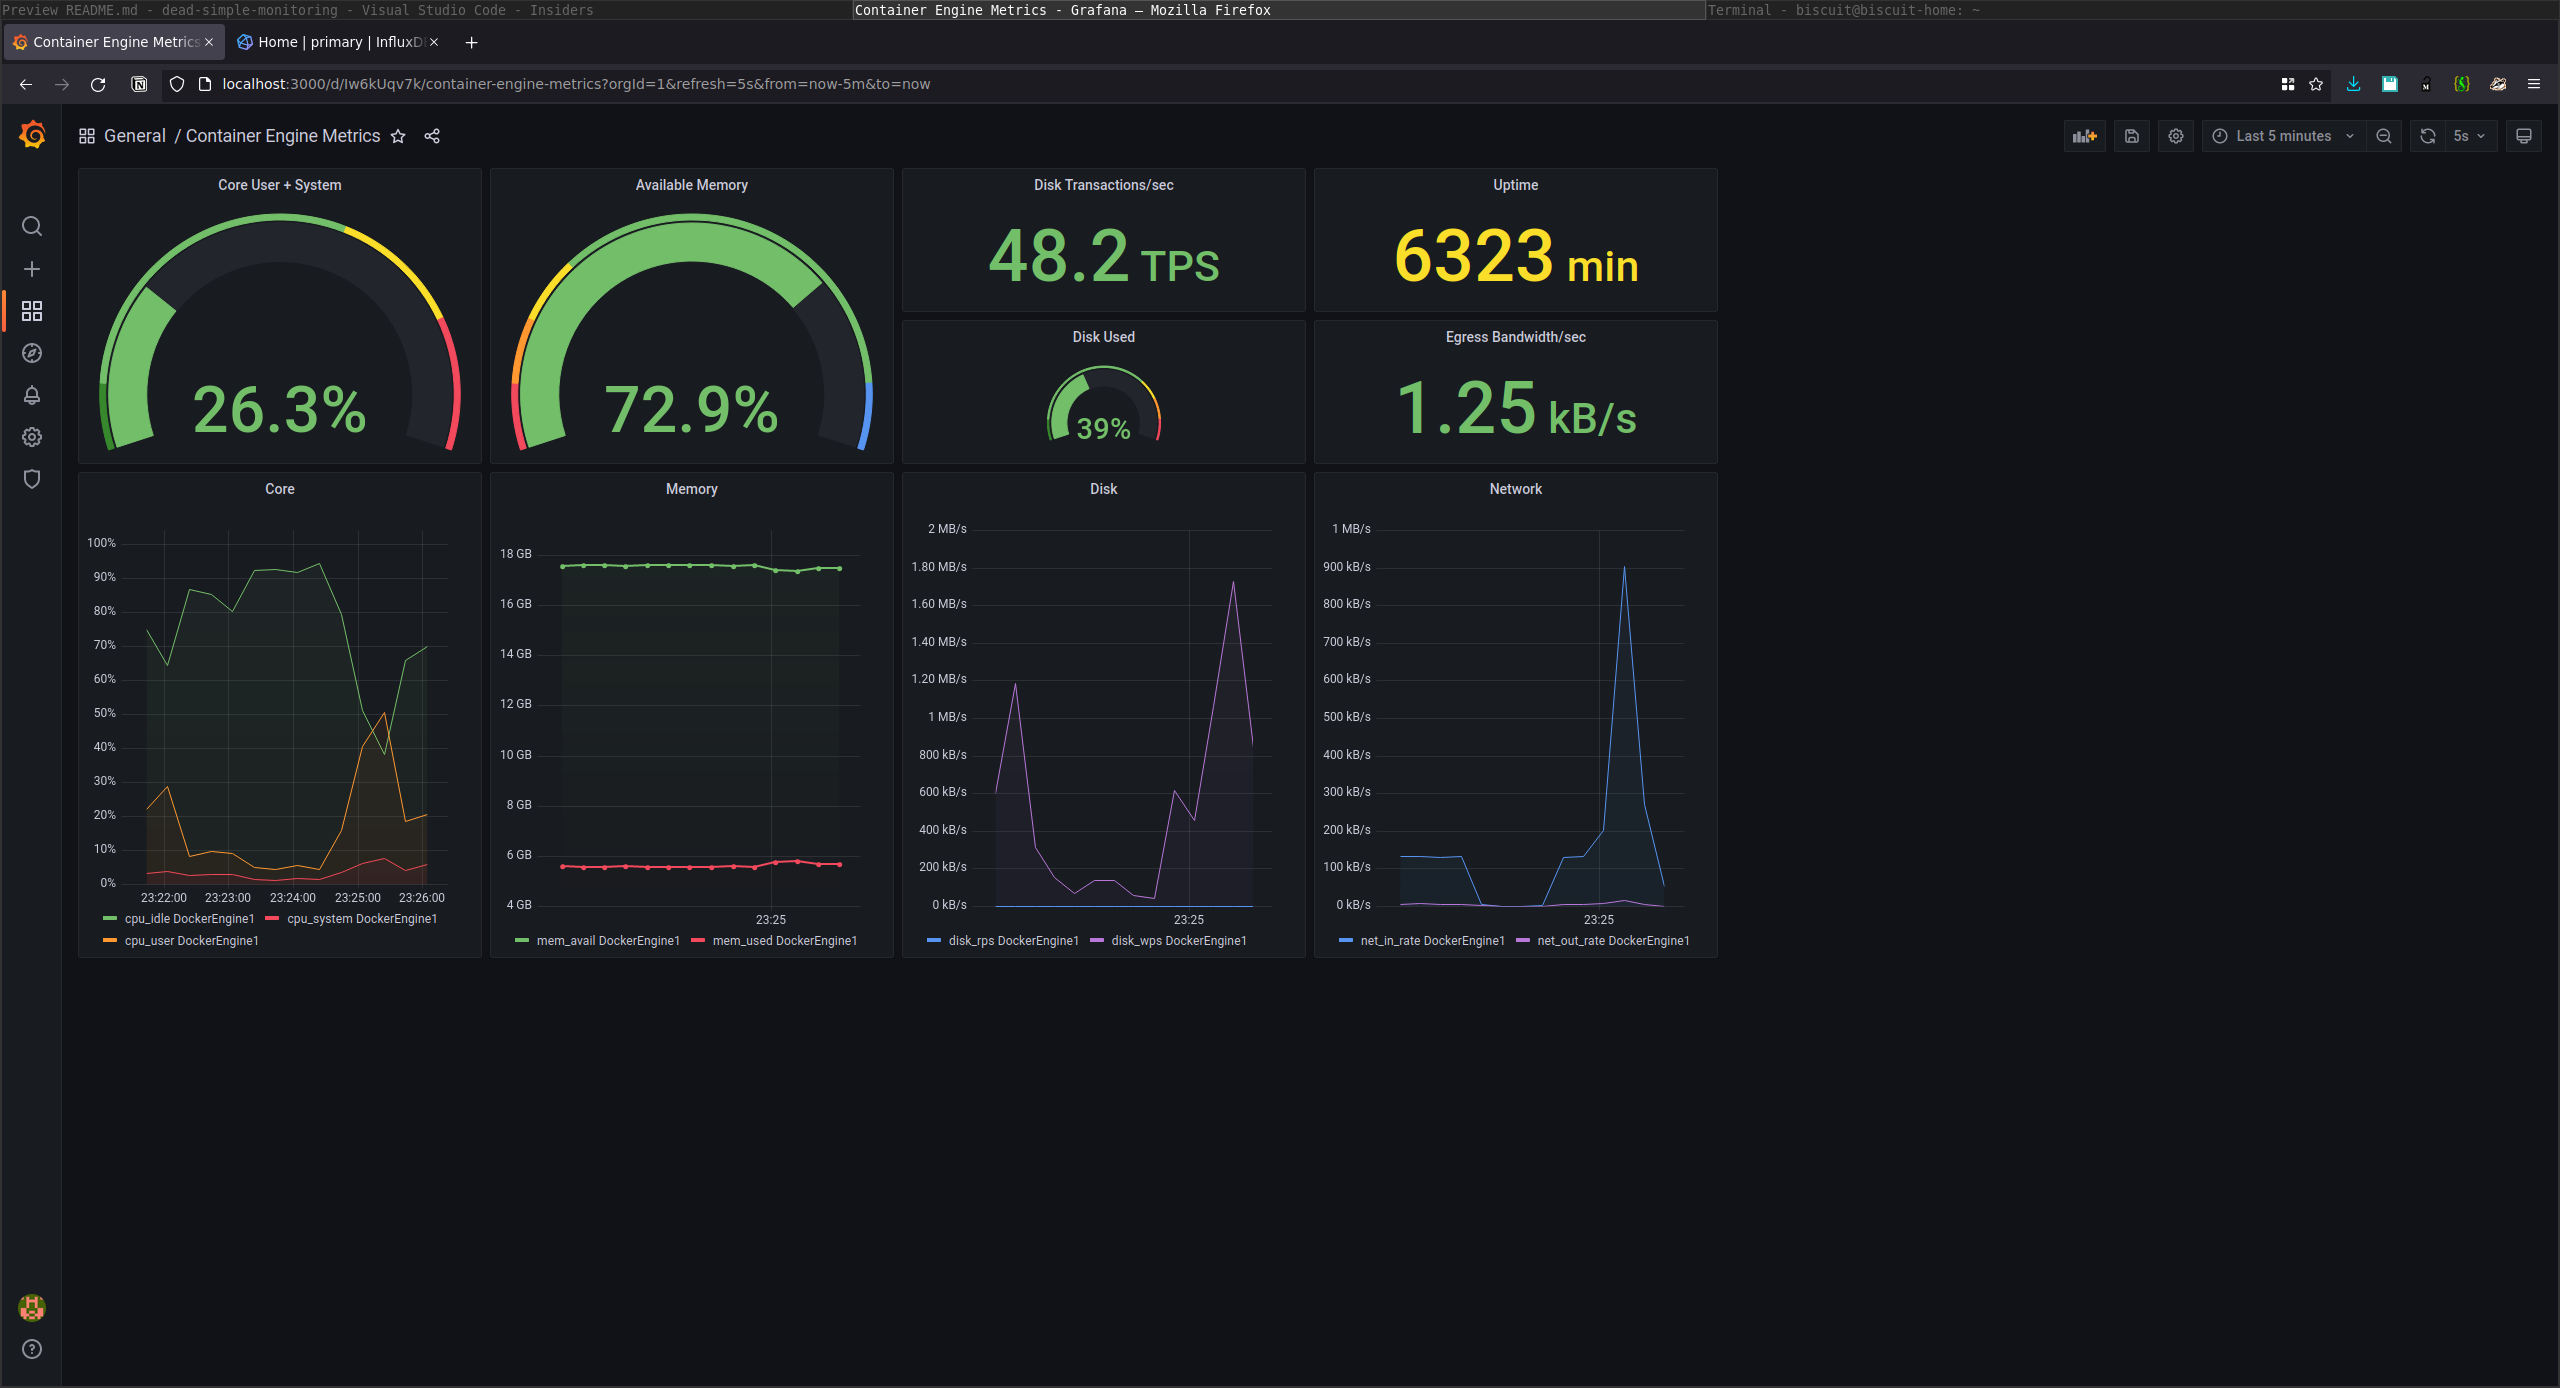
- Application / cloud infra load metrics.
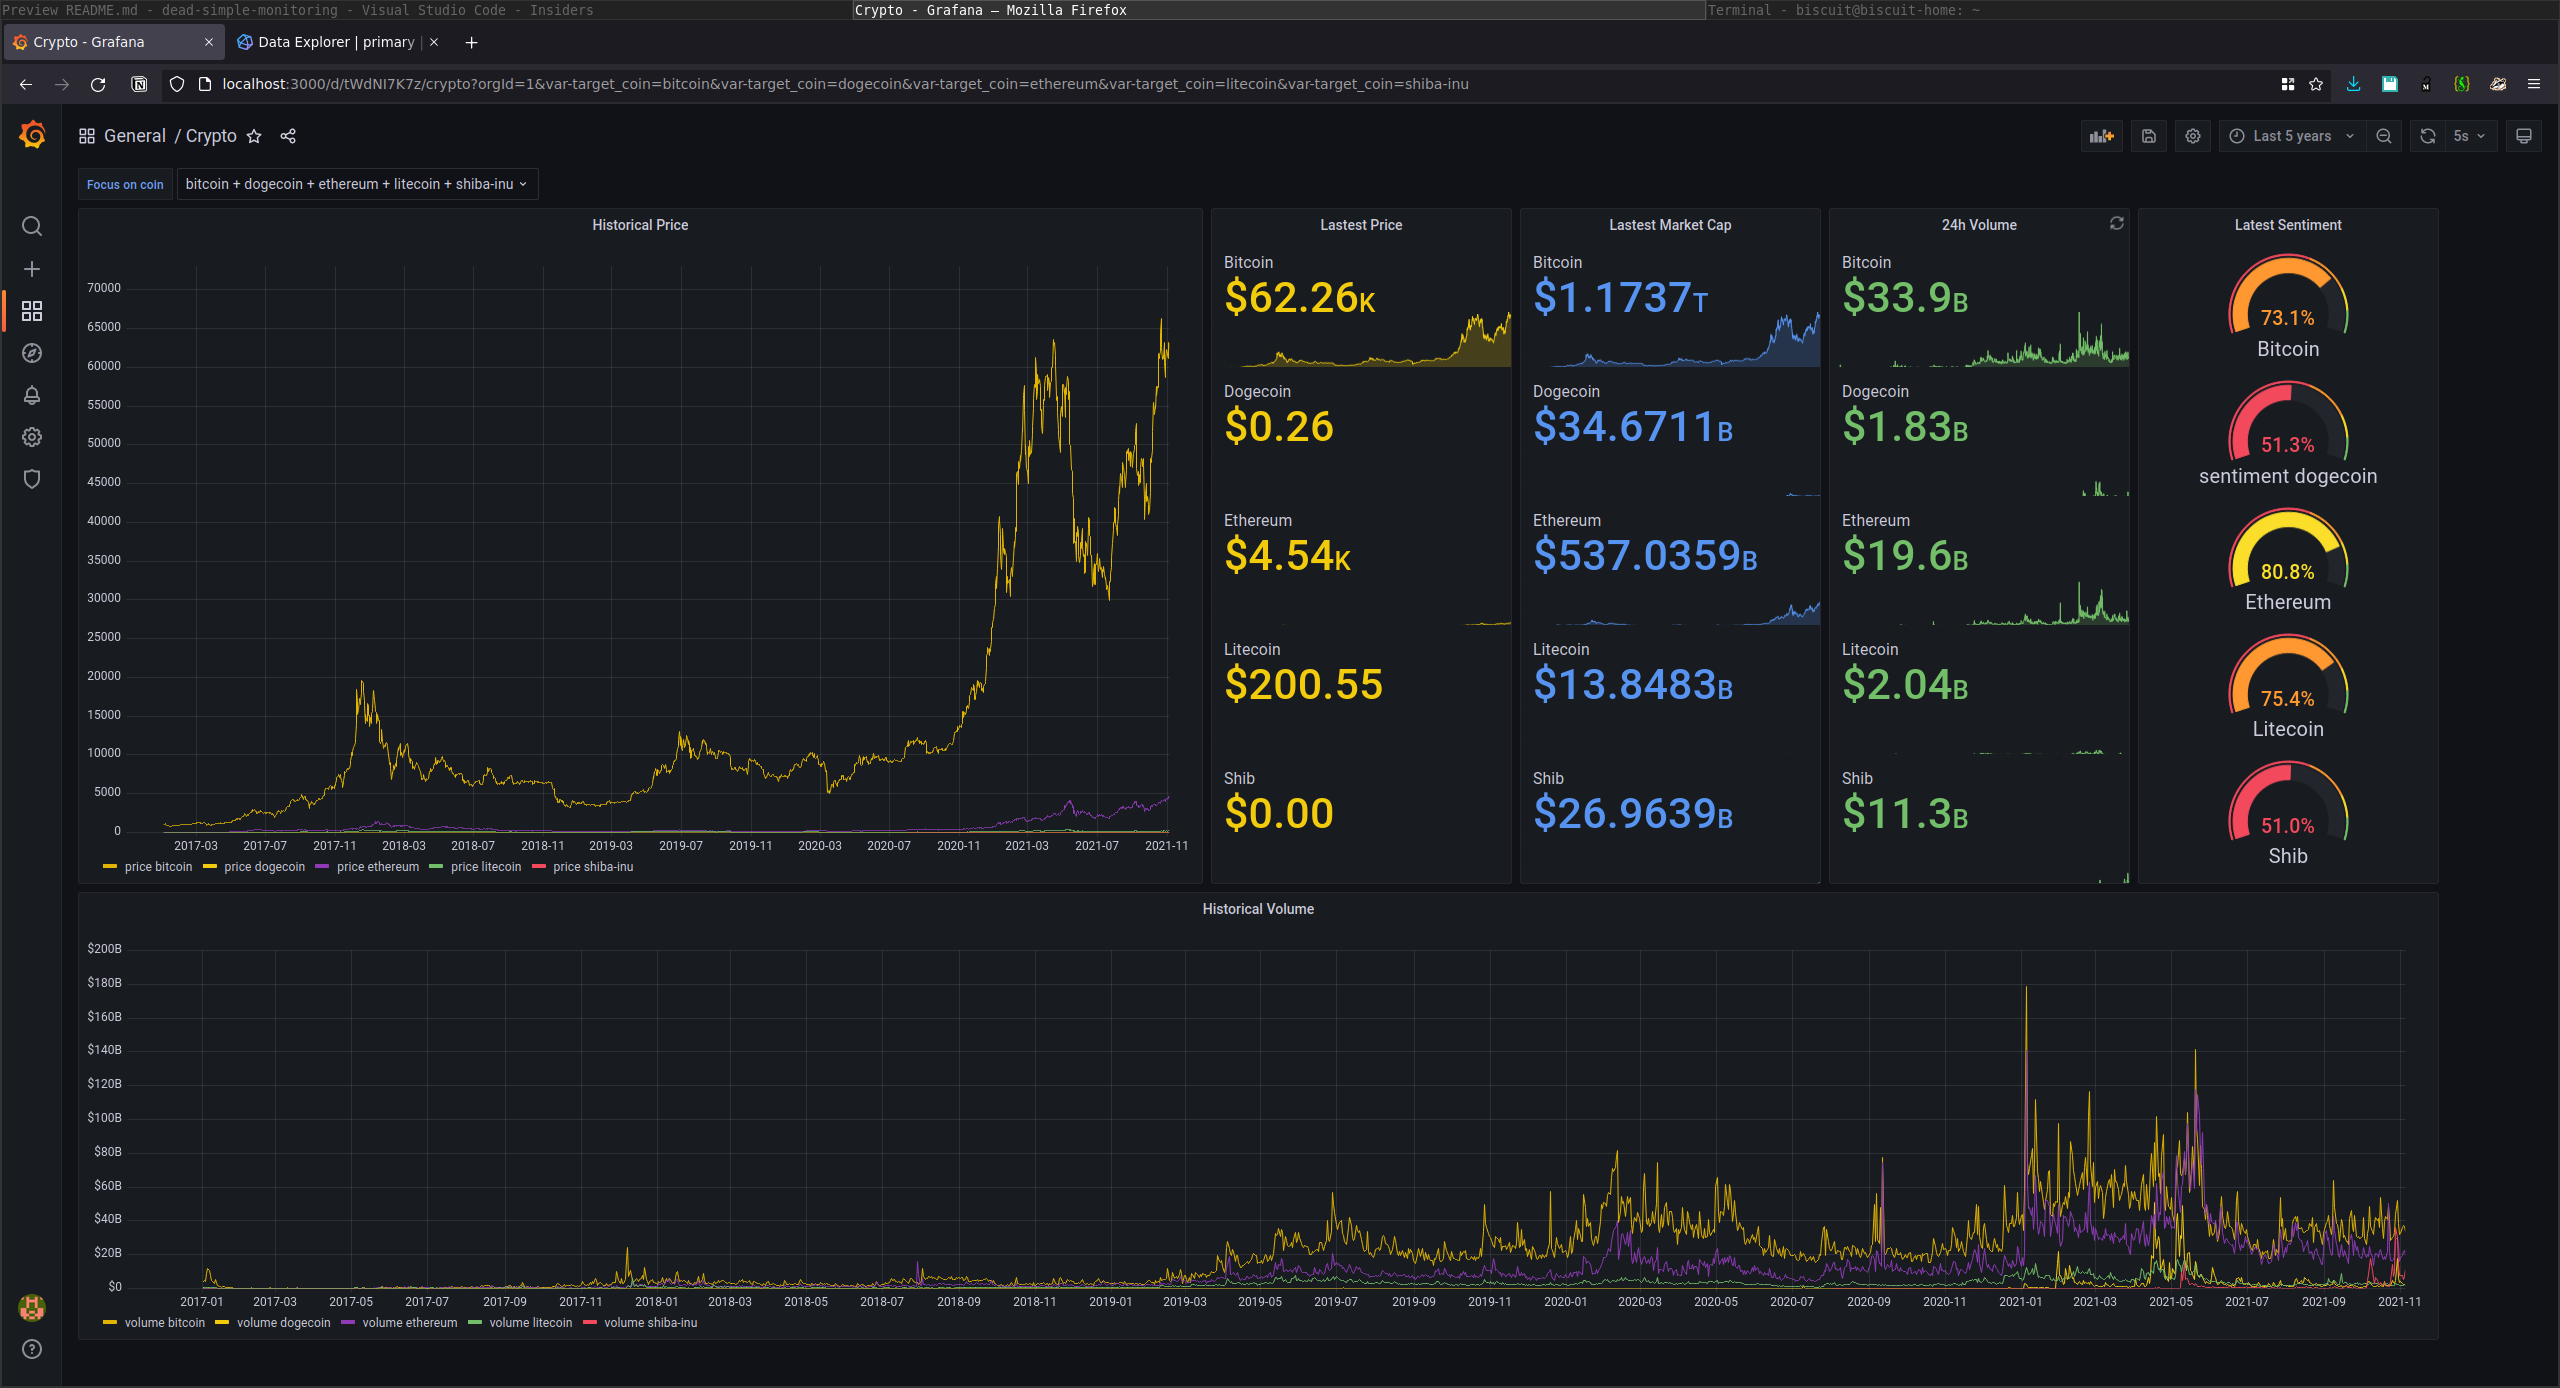
- Cryptocurrency, stock markets, IoT, sensors.
- Anything that fits into influx, it tracks!
To run the comprehensive example (warning: may slow your cpu for 5 mins), Clone or download this project, install Docker Desktop, navigate to this folder (in terminal), and run:
./scripts/demo.sh
The demo consists of
- Influx
- Grafana
- Crypto exporter writing to influx
- Sysinfo exporter writing to influx
Dashboards are provisioned under deploy/compose-[env]/grafana/provisioning
To see the dashboard in action, navigate to http://localhost:3000. The logins are:
User: admin
Pass: deadsimple
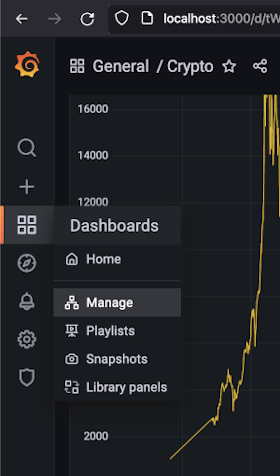
Select Dashboards > Manage to see your dashboards
To learn how to add coins to the crypto dashboard, click here.
If you find this useful, feel free to tip a few DogElon Mars (ELON) to 0x4a865b322bf9f243b59957ff0930259beccdc6c8
Tested on Linux and macOS. Known Issues:
- macOS names its drives
vda. Will fix in future.


