Annie Cheng (400298037)
Kenzie Dorgelo (400374596)
Sam Fanaki (400297172)
Iris Huang (400295138)
Jefferson Lam (400272316)
Yiyao Li (400258214)
William Russell (400199227)
Julian Vella (400408707)
Final project for ENVSOCTY 4GA3 Applied Spatial Statistics (McMaster University)
This paper reports our analysis of crime data in Toronto, Ontario, Canada, and its relationship with income and unemployment rate at the level of census tracts. Data were obtained from the Toronto Police Services and the Canadian Census.
Police-reported crimes in Canada have demonstrated an unsettling increase for two consecutive years (Government of Canada, 2023). This concerning trend is particularly acute in urban areas like Toronto, where the confluence of socioeconomic disparities and crime rates presents complex challenges. As Canada’s largest metropolitan city, with a population nearing 3 million (OECD, 2024), Toronto represents the future of other Canadian metropolitan areas. However, the persistent upward trajectory, notably in property crimes, including theft, constitutes approximately 15% of total crime occurrences between 2014 and 2022. This raises the question of what factors are causing this trend. This report aims to explore the relationships between income and unemployment and how they may lead to theft-related crimes in Toronto. To assess any possible relationships, previous studies have been analysed, and correlations between both income and unemployment have been identified as having possible connections to criminal activity.
Crime rates are influenced by a variety of factors, with unemployment and income playing a significant role in shaping criminal activities. Research has shown that these two factors have a positive correlation with crime rates (Dizman, 2020). Those with lower economic status can resort to crime, highlighting the impacts of economic factors on criminal behaviour (Rehaman, 2022). Moreover, the effects of income on crime have been a subject of interest, with studies suggesting that economic welfare plays a crucial role in crime reduction (Bianchi & Chen, 2021).
From 2021 to 2023, auto theft in Toronto has seen a notable rise, with a nearly 85% increase within this time range, with 6,642 reported auto thefts in 2021 and 12,262 in 2023 (Toronto Police Service, 2024). To put that into perspective, roughly 34 vehicles are stolen daily, or every 40 minutes (Fanfair, 2024). The neighborhood with the most auto theft took place in West Humber Clairville, with 833 cases (Toronto Police Service, 2024). This neighborhood is located on the outer border of Toronto, and in 2020, 12.9% of the population was considered low-income, and roughly 10% were unemployed (City of Toronto, 2023). The high volume of auto theft in the outer regions of Toronto makes them more susceptible to the effects of the changing economic landscape caused by the pandemic. This indicates that this portion of the population is more likely to resort to criminal activity. As the chief of police has noted, vehicle theft is a lucrative business right now because of the high demand, and with that, criminals are migrating towards an easy payday (Fanfair, 2024).
In terms of bike thefts, there was a small spike in Toronto from 2022 to 2024, as according to the Toronto Police Service Public Safety data, bike thefts total rose from 323 to 424. About 40% of these took place in residential areas (Toronto Police Services, 2024). The rise of bike thefts over the years is caused by a similar reason to auto thefts, as for thieves and criminals they are a way to mitigate their own economic challenges and status. Bicycle thieves see the reward as being far greater than the risk of stealing vehicles, as stealing bikes is easier and the chances of getting caught are rare (SoCalcycling, 2022). The Toronto Police Service suggests that the use of a proper bicycle rack and bike lock are the best measures to discourage or slow down bike thieves (Toronto Police Service, 2024). But less privileged neighborhoods across Toronto aren’t as fortunate, as proper bicycle racks aren’t as widely available compared to places like the downtown core.
For the purposes of this study, four types of crime were taken into consideration. These crimes are robbery, auto theft, break and enter, and theft over $5000, standardized as rates per 1000 people. The two most recent years a Canadian census was collected were 2021 and 2016. Given that COVID-19 was still heavily affecting global behaviour due to lockdowns and remote work in the year 2021, 2016 was chosen for analysis. This should reflect relatively recent typical trends of the economy as well as criminal activity while being unhindered by drastic global crises.
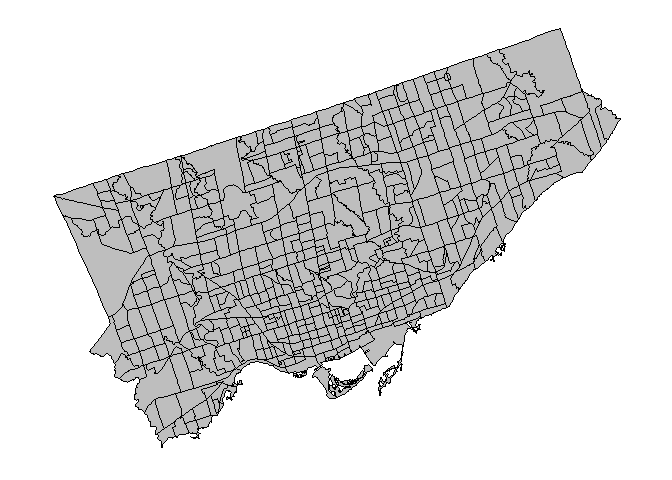
Crime data was studied at the census tract level for the City of Toronto (see Figure ). There are 572 census tracts in the City of Toronto, and 569 of these had sufficient income and unemployment data available for analysis. Toronto was chosen as it is the largest city in Canada with one of the most diverse populations, resulting in an interesting case study for analyzing socio-economic trend correlation with crime data. Census tracts were chosen for this study as opposed to wards, neighbourhoods, or dissemination areas because they are the finest possible resolution to show trends in crime data across the city, with minimal regions containing no data.
Census Tracts in Toronto, Ontario, CanadaA shapefile of Toronto Census Tracts was created with crime and census data associated. To access the census tracts shapefile and census data, the cancensus package for R was used. 2016 Canadian Census data was accessed in a simple features format for CSD #3520005 (The City of Toronto). The following vectors were accessed: (1) Median Total Household Income ($) (vector code: v_CA16_2397), (2) Unemployment (%) (vector code: v_CA16_5618), and (3) Total Population (vector code: v_CA16_401). Using the sf package for R, the census data was exported as a shapefile.
Crime data was accessed in a point shapefile format from the Toronto Police Service Open Data website. Using the Esri ArcPy package for Python, crimes committed in 2016 and which were part of one of the following categories were selected and all other records were removed: (1) Robbery, (2) Auto Theft, (3) Break and Enter, or (4) Theft Over.
In order to resolve instances of crime points being located at the intersection of multiple census tracts, it was decided that their counts would be divided among all census tracts they intersected with. The ArcPy Buffer Analysis tool was used to create a five meter buffer around each crime point. In the attribute table for these buffers, columns were created for each crime category, and dummy variables were added which acted as a count of which crime type occurred for each buffer (i.e, a value of 1 in the corresponding column.)
Using the ArcPy Apportion Polygon tool, the count of each buffer was distributed among all intersecting CTs. The output shapefile, which now contained both census and crime data, was then exported for further analysis in R.
In R, the shapefile was read and projected to NAD 1983 UTM Zone 17N (EPSG: 32617) using the sf package. This was necessary to allow nearest neighbour functions in this study to take values in metres as arguments. Crime rates were calculated from the absolute values of crimes committed per census tract divided by the population of the census tract, and multiplied by 1000 to standardize it as rates per 1000 people. Three census tracts contained zero data for income due to privacy concerns, which were filtered out from the dataset using the filter function from the dplyr package (part of the tidyverse collection), to allow the following data processing to work with complete data points only.
This study uses RStudio to conduct a series of data processes to visualize and find correlations between socio-economic variables and crime rates for census tracts in Toronto, Ontario, Canada. The independent socio-economic variables used in this study are median income and unemployment rate, and the dependent variables, the four types of crime analyzed are robbery, auto theft, break and enter, and theft over $5000, standardized as rates per 1000 people.
The analysis used several R packages, including sf, ggplot2, ggpubr, scales, spdep, tidyverse, and spatialreg. For the initial visualization and analysis of the area data, choropleth maps and Moran’s I tests and plots were used to identify patterns and spatial autocorrelation in the data. Then, Kendall’s tau correlation tests and regression analysis was used to gain insight on the processes behind these spatial patterns, as well as any relationship between the independent and dependent variables. Finally, spatial lag models were created using insights gained from the Moran’s I tests, Kendall’s tau correlation and regression analysis models, to predict where each type of crime is most likely to occur given median income and unemployment data.
This document was also written and exported through R-Markdown with minimal adaptation from Steven V. Miller’s template for academic manuscripts. See: http://svmiller.com/blog/2016/02/svm-r-markdown-manuscript/%5Bhttps://github.com/svmiller/svm-r-markdown-templates/blob/master/svm-latex-ms.tex] and (https://github.com/svmiller/svm-r-markdown-templates/blob/master/svm-latex-ms.tex)
The data and code used in this project can be found on Github: https://github.com/jujujames/4GA3_Group1_FinalReport. This document is also available as an RMarkdown file, which includes both the code and the text used to create this report.
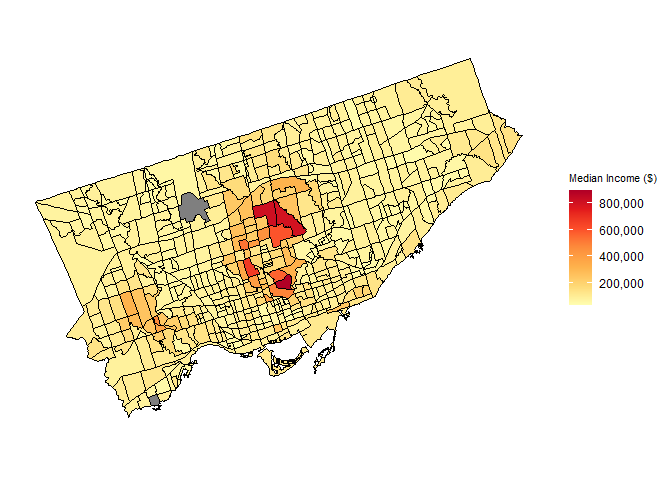
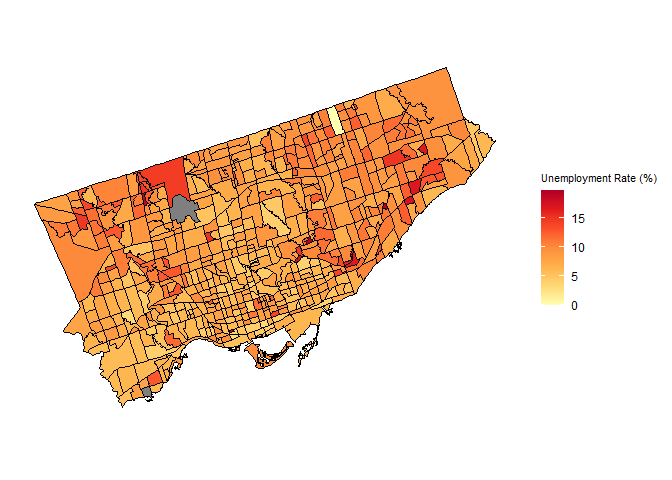
First, choropleth maps were created to display the distribution of data and explore the relationship between income (Figure ), unemployment (Figure ) and theft rate by classification (Figures 4-7) in Toronto in 2016.
Median Income of Toronto Census TractsIn Figure , it can be seen that the neighbourhoods with above-average income are concentrated in the centre (Northern Old Toronto) and southwest (Etobicoke) regions of Toronto. The cluster of neighbourhoods in Northern Old Toronto are characterized by much higher incomes (above $600,000) than the median income across the whole city, while the cluster in Etobicoke is another high-income area (approximately $400,000).
Unemployment Rate of Toronto Census TractsFigure shows the unemployment rate does not appear to represent a particular spatial pattern throughout the city. Northern Old Toronto, Downtown Toronto, and Southern Etobicoke display relatively lower unemployment rates compared to the northernmost parts of North York and Etobicoke, and Scarborough regions.
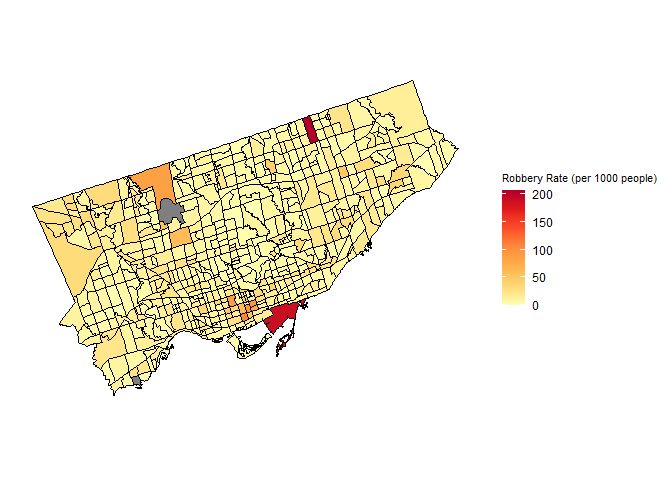
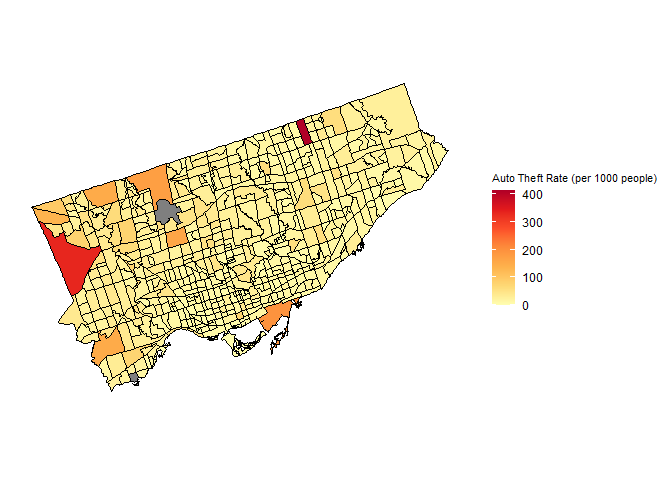
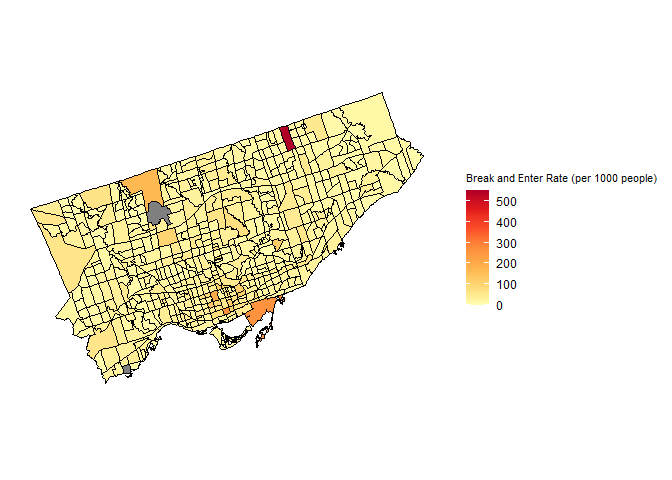
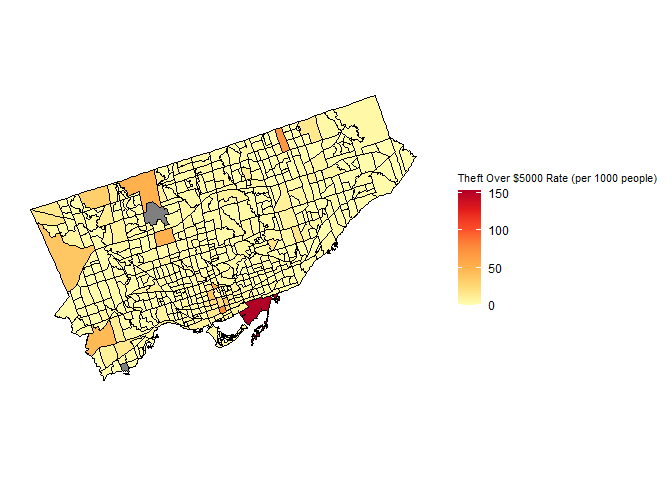
Figures 4-7 depict information on theft rate in Toronto calculated in rates per 1000 people, classified by robbery rate (Figure ), auto theft rate (Figure ), break and enter rate (Figure ), and the rate of theft over $5000 (Figure ).
Robbery Rate (per 1000 people) of Toronto Census TractsFrom Figure , the robbery rate tends to occur in the downtown core, one tract in Northern Scarborough, and a couple of tracts in northernmost North York. In particular, the highest robbery rates occur in a census tract adjacent to Lake Ontario in the south and a census tract in northern Scarborough.
Auto Theft Rate (per 1000 people) of Toronto Census TractsThe auto theft rate in Figure follows a different trend compared to the robbery rate, which is concentrated primarily in northwest Etobicoke. Etobicoke as a whole tends to have a higher auto theft crime rate, particularly a cluster of census tracts in northern Etobicoke, as well as one census tract in northern Scarborough.
Break and Enter Rate (per 1000 people) of Toronto Census TractsFrom Figure , the break and enter rate shows similar spatial trends as the robbery rate. The census tracts with higher rates are concentrated in the downtown core, one tract in Northern Scarborough, and a couple of tracts in northernmost North York. In particular, the highest break and enter rates occur in a census tract adjacent to Lake Ontario in downtown Toronto, and a census tract in northern Scarborough.
Theft Over $5000 Rate (per 1000 people) of Toronto Census TractsThe rate of theft over $5000 is relatively consistent with the pattern observed in the cases of robbery and break and enter theft rates. Scarborough has a few census tracts with moderately higher rates than most of the city. The tract in the downtown core adjacent to Lake Ontario exhibits a significantly higher rate of theft over $5000, while other tracts in the downtown core, northern Scarborough, and northernmost North York also show relatively high rates of theft over $5000.
Spatial autocorrelation is an essential factor to consider in the analysis of crime rates within Toronto before engaging in regression analysis to understand the impact of socioeconomic variables on the rate of crime. The non-random patterns of crime distribution are key to using regression analysis to yield more informative insights into the factors driving these patterns.
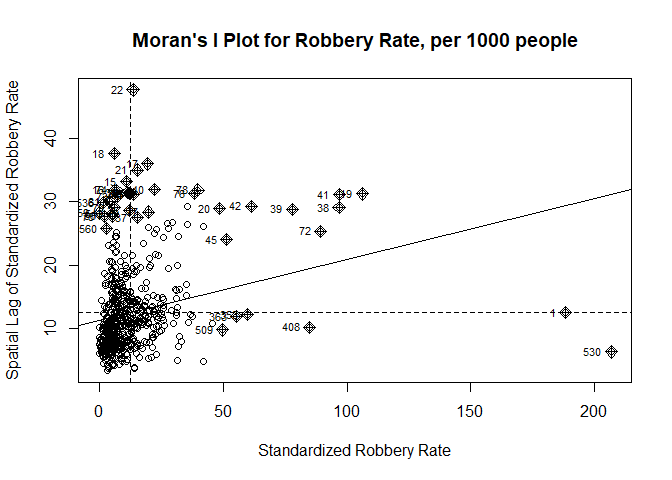
Using a measure of spatial autocorrelation, Moran’s I helps determine whether the spatial distribution of crime rates is inherently random or if there is a pattern of spatial dependence. By testing the null hypothesis that the spatial pattern is random, we can ascertain the significance of the observed patterns. For each of the Moran’s I tests, a nearest neighbour threshold of 2222 meters was defined, as the minimum value to assign at least one neighbour to every census tract.
Tables 1-4: Results of Moran I Spatial Autocorrelation Test for Various Crime Rates in Toronto As seen in the results in Tables 1-4, all four tests indicate significant positive spatial autocorrelation. This means that areas with high crime rates tend to be clustered together for each type of crime. This finding can be important for law enforcement and urban planning, as it suggests that interventions in high-crime areas might not only affect those specific areas, but also their surrounding regions. The consistency of negative expectations and very low p-values across all tests strengthens the evidence that these spatial patterns are not random but rather a significant characteristic of the dataset.
Moran’s I Plot for Robbery Rate in TorontoIn the case of the robbery rate within Toronto, Moran’s I statistic is positive, and the associated p-value is very low (p-value = 3.983×10⁻¹⁰), rejecting the null hypothesis that the spatial pattern is random. This significant positive Moran’s I statistic indicates a spatial clustering where high robbery rates are found near other high-rate areas, and the reverse is true for areas with low rates. This clustering effect is visually confirmed in Figure , showing a definite trend of spatial dependence with pockets of high-high and low-low clustering evident across the city.
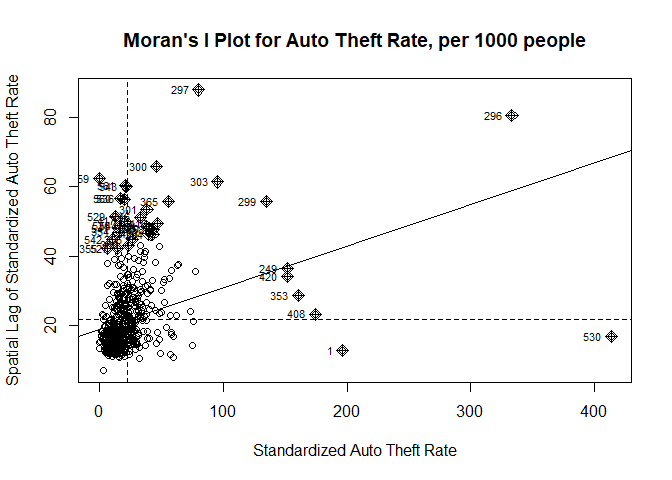
Moran’s I Plot for Auto Theft Rate in TorontoSimilar patterns are observable in the auto theft rate data. The positive Moran’s I statistic and the extremely low p-value (p-value = 1.475×10⁻¹⁵) indicate non-randomness. Figure illustrates a clear non-random pattern where high auto theft rates cluster in particular neighborhoods, affirming the hypothesis of non-random spatial patterns.
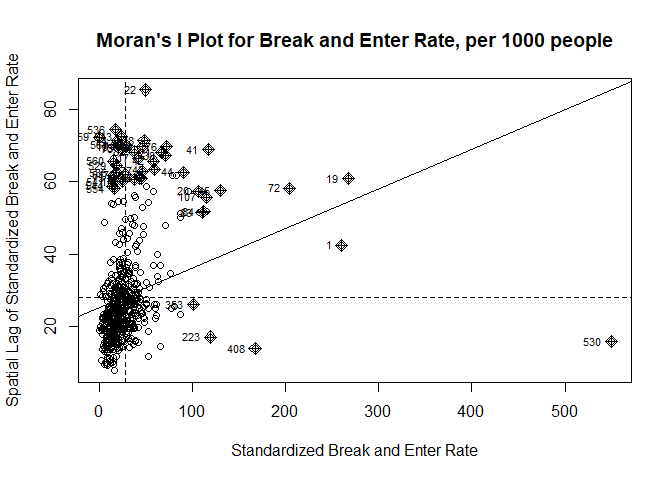
Moran’s I Plot for Break and Enter Rate in TorontoThe break and enter rates demonstrate a positive Moran’s I statistic with a very small p-value(p-value = 1.824×10⁻¹⁴), leading to the rejection of the null hypothesis and suggesting a non-random spatial pattern. Figure underlines this clustering of break and enter incidents, with areas of high rates situated near similar areas, reinforcing the concept of spatial autocorrelation within this type of crime.
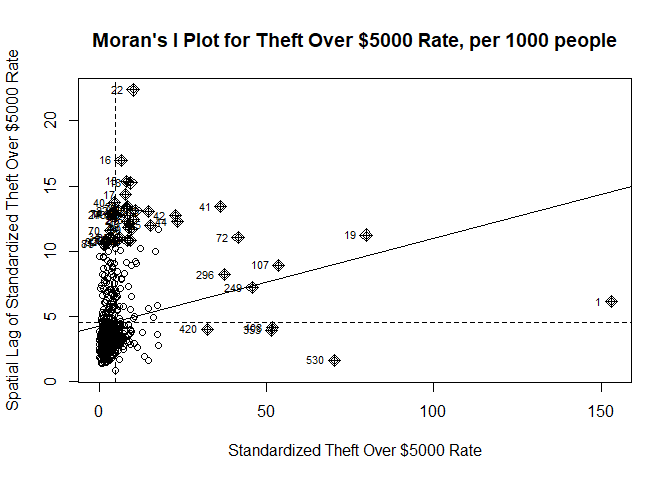
Moran’s I Plot for Theft Over $5000 Rate in TorontoFurthermore, the theft over $5000 rate shows a positive Moran’s I statistic, indicating moderate spatial clustering, showing a non-random pattern confirmed by the low p-value (p-value = 1.463×10⁻⁶). The moderate clusters of both high and low theft rates are identifiable in Figure , although they are subtler in comparison to the other crime types.
Kendall’s tau correlation provides a quantitative assessment of the relationships between income, unemployment, and various crime rates in Toronto. The analysis shows both the direction and strength of these relationships and is crucial for understanding the socioeconomic dynamics affecting crime rates. Kendall’s tau correlation was chosen over other correlation methods due to its robustness against influence by outliers, which this dataset has a significant number of across all crime types.
Linear regression analysis between the type of crime and both socioeconomic variables was performed to find the best-fitting model for observed data. These regression analyses include linear, quadratic-transformed, cubic-transformed, and logarithmic-transformed.
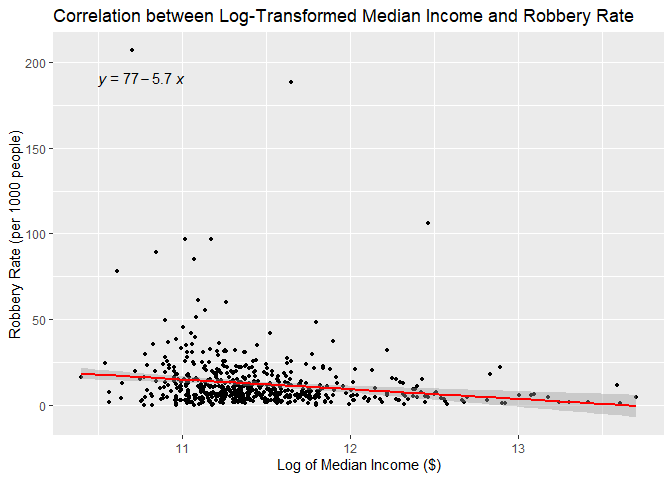
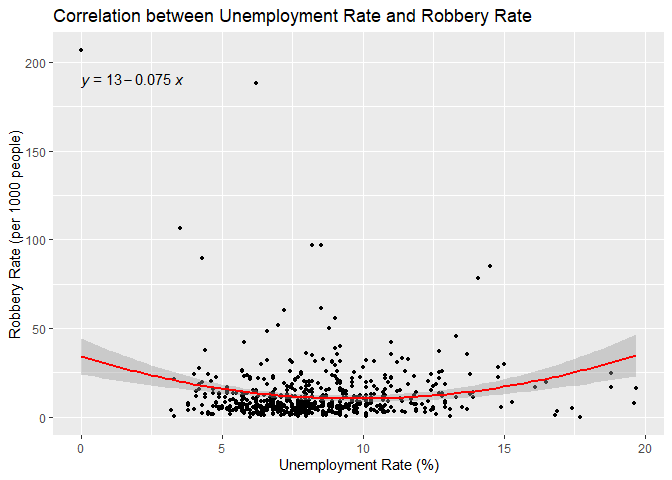
Correlation Analysis of Median Income and Robbery Rate in Toronto Correlation Analysis of Unemployment Rate and Robbery Rate in TorontoLooking at robbery rates, Kendall’s tau correlation with income is weak, negative and statistically significant (tau = -0.155, p = 3.08e-08), suggesting that as income increases, robbery rates tend to decrease. The linear regression model of log-transformed median income corroborates this with a negative coefficient for income (Estimate = -5.665, p = 7.632e-05), although the model explains a relatively small portion of the variance in robbery rates (Adjusted R-squared = 0.02553). Kendall’s tau correlation with unemployment is weak, positive, and statistically significant (tau = 0.785, p = 0.0054), suggesting that as unemployment increases, robbery rates tend to increase. The linear regression model with a quadratic transformation of the unemployment variable corroborates this with a positive coefficient for unemployment at the 2nd degree (Estimate = 73.8392, p = 4.84e-05), although the model explains a relatively small portion of the variance in robbery rates (Adjusted R-squared = 0.03109).
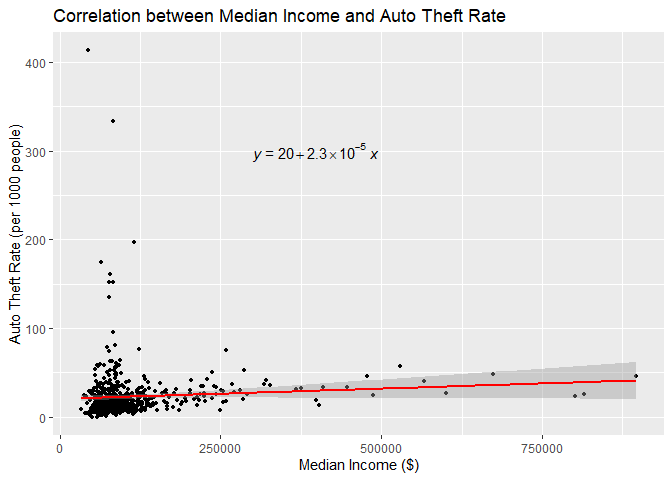
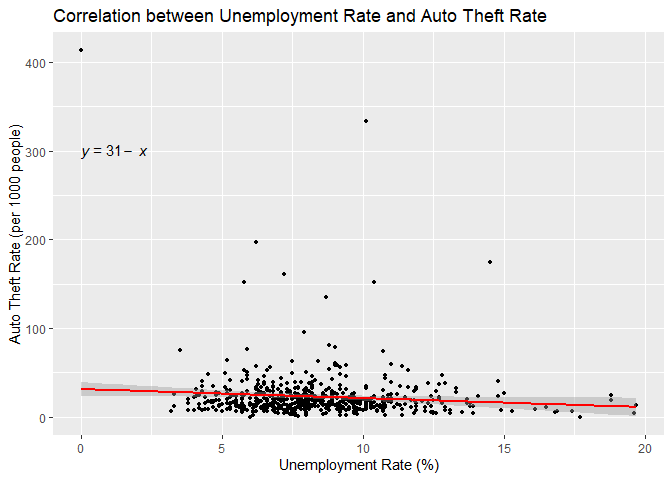
Correlation Analysis of Median Income and Auto Theft Rate in Toronto Correlation Analysis of Unemployment Rate and Auto Theft Rate in TorontoFor auto theft rates, the correlation with income shows a slight positive trend, and it is statistically significant (tau = 0.142, p = 4.03e-07). This suggests that as income increases, there’s a marginal tendency for auto theft rates to rise. However, the relationship between income and auto theft rates is not captured strongly in a linear model, as indicated by a non-significant p-value (p = 0.0827) from the regression analysis. Conversely, the link between auto theft rates and unemployment shows a negative but weak and statistically insignificant correlation (tau = -0.0497, p = 0.07826). This suggests that unemployment has a negligible effect on the rate of auto theft. This lack of significance is confirmed by the linear regression analysis, which returns a high p-value (p = 0.0244), implying that the regression model fails to capture any substantial linear effect of unemployment on auto theft rates, as evidenced by a very low adjusted R-squared value (Adjusted R-squared = 0.007154), highlighting a minimal explained variance in auto theft rates by these socioeconomic factors.
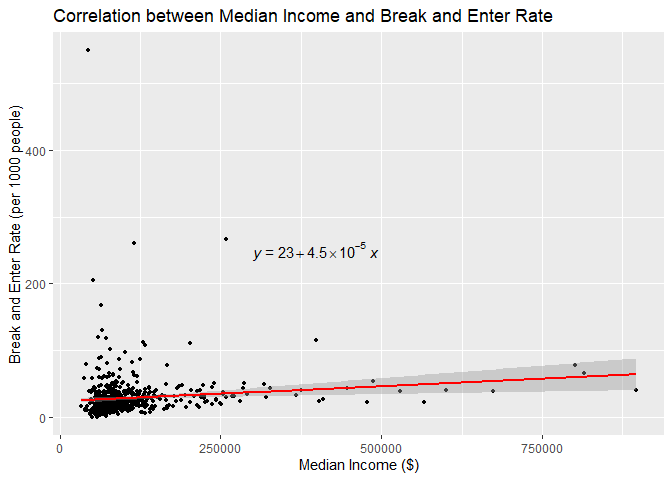
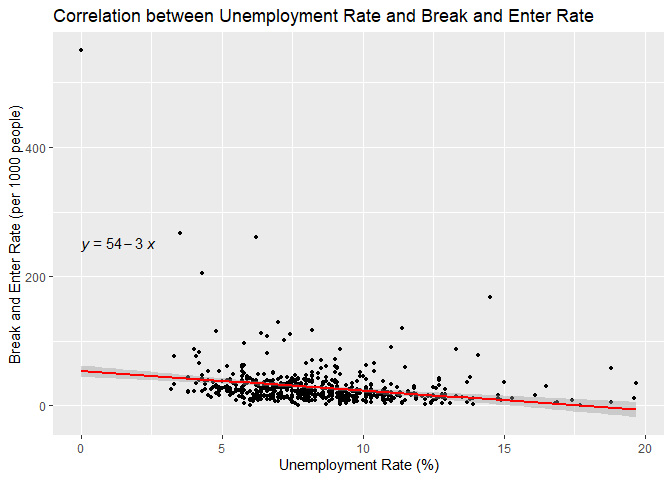
Correlation Analysis of Median Income and Break and Enter Rate in Toronto Correlation Analysis of Unemployment and Break and Enter Rate in TorontoThe break and enter rates have a moderately positive, statistically significant association with income (tau = 0.229, p = 3.099e-16) and a moderately negative, statistically significant correlation with unemployment (tau = -0.223, p = 2.302e-15). The regression models show that both income (Estimate: 4.50e-05, p = 0.003356) and unemployment (Estimate: -3.0064, p = 6.968e-09) are moderate predictors with a linear relationship, with higher income associated with higher break and enter rates and higher unemployment leading to lower rates. However, the variation explained by both models remains low (adjusted R-squared = 0.01333 and 0.05583, respectively).
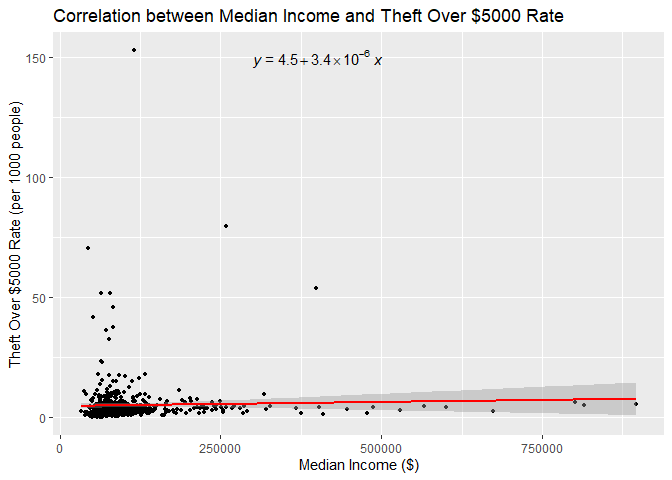
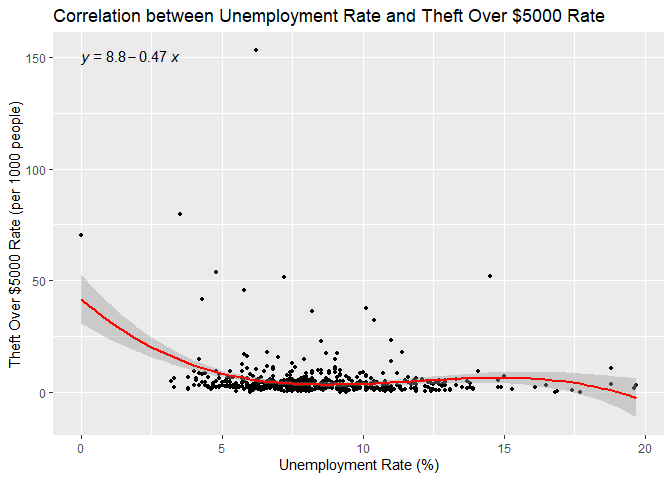
Correlation Analysis of Median Income and Theft Over $5000 Rate in Toronto Correlation Analysis of Unemployment Rate and Theft Over $5000 Rate in TorontoLastly, the rate of theft over $5000 has a weak, positive, and statistically significant correlation with income (tau = 0.081, p = 0.003859), however, the regression model shows that this relationship is not well-explained linearly. (p = 0.4396). Despite this, other types of polynomial or logarithmic transformation did not provide a better fit for the relationship between these two variables. Kendall’s tau correlation with unemployment is weak, negative, and statistically significant (tau = -0.1215, p = 1.635e-05), and the cubic relationship is effectively captured by the regression model (p = 5.478e-10). These relationships are still fairly weak, as shown in the respective adjusted R-squared values (-0.0007 and 0.07335).
Finally, spatial lag models were created for each type of crime to predict which census tract crimes are most likely to occur based on each individual relationship between income and unemployment. As evidenced by Moran’s I test, each type of crime exhibits positive spatial autocorrelation, meaning a spatial lag model is appropriate to consider the influence of neighbouring regions in the regression equation. The spatial lag models account for this influence through the use of an exponential decay function and a spatial weights matrix, which defines the spatial relationship between each pair of observations. The exponential decay function used for each model was custom-made for this study, and is defined by the following:
distance_decay_function <- function(d, bandwidth) {
  exp(-d / bandwidth)
}
This function specifies that for the distances d between neighbours, an exponential decay is applied using a specified bandwidth to calculate the weight applied to each neighbour. Through the vectorization of d, these weights diminish as distance increases, thus, the exponential decay function ensures that closer neighbours possess a stronger influence than those further away.
Each model uses a custom matrix defined by threshold and bandwidth values, with the optimal values for each found using the Akaike Information Criterion (AIC), which measures the best fit against the observed data. Threshold refers to the spatial extent within which neighbouring observations are considered for inclusion in the spatial weights matrix, and bandwidth refers to how the influence of an observation on its neighbour decays with increasing distance to the defined threshold. Both threshold and bandwidth are measured in meters, as established through the projection of the dataset into NAD 1983 UTM Zone 17N. The Akaike Information Criterion is useful for direct fit comparison across multiple models of the same data, where lower AIC values indicate a better model fit. Bandwidth was tested at intervals of 500m from a range of 0m to 3000m, and threshold was tested at intervals of 100m from a range of 2222m to 4000m, and the combination that produced the lowest AIC value was selected in each case. It is important to note that a threshold value of 2222m was the minimum required to run each model, to ensure that every census tract in the dataset had at least one neighbour.
The results from Kendall’s tau correlation tests were used to define which variables, between income and unemployment, would be included for each model. Since Kendall’s correlation test is resistant to outliers, these tests were considered in selecting appropriate variables between income and unemployment when modeling. The results of regression analysis were used to consider the degree of transformation each variable would exhibit in each model, such as linear, quadratic, or logarithmic. In order to equally assess the impact of changes in the level of income and unemployment for the spatial lag models and curb outliers, the values of both income and unemployment were scaled to have a mean of 0 and a standard deviation of 1.
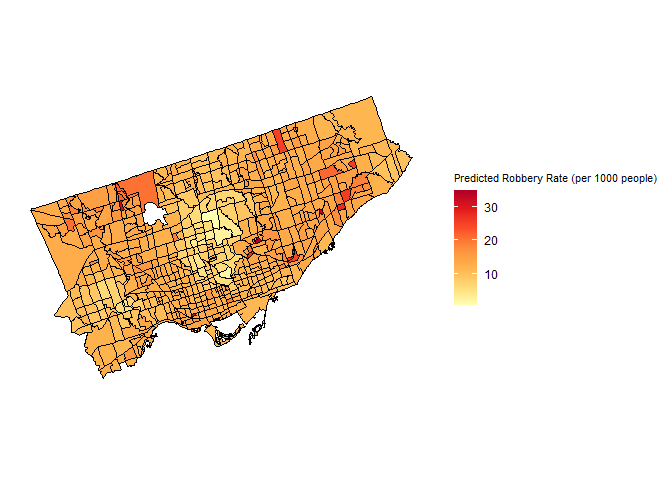
Predicted Robbery Rate Using a Spatial Lag ModelFigure shows the results of the spatial lag model predicting robbery rates in each census tract in Toronto. According to Kendall’s tau correlation, both Income (negative) and Unemployment (positive) have weak yet significant correlations on the rate of robbery in each census tract, thus both variables were included as predictors of robbery rate in the model. Based on the results of the regression analysis, income exhibits a logarithmic relationship with the robbery rate, while unemployment is characterized by a quadratic relationship. Due to this observation, income was included as a logarithmic predictor, and unemployment was included as a quadratic predictor to more accurately reflect the nonlinear relationship between these two variables and the observed robbery rate. The threshold and bandwidth chosen for this model were 3100m and 1500m, respectively, and the model produces an AIC value of 4779.4. The p-value of residual autocorrelation is 0.84716, indicating that the model accurately captures the spatial pattern present in the observed data.
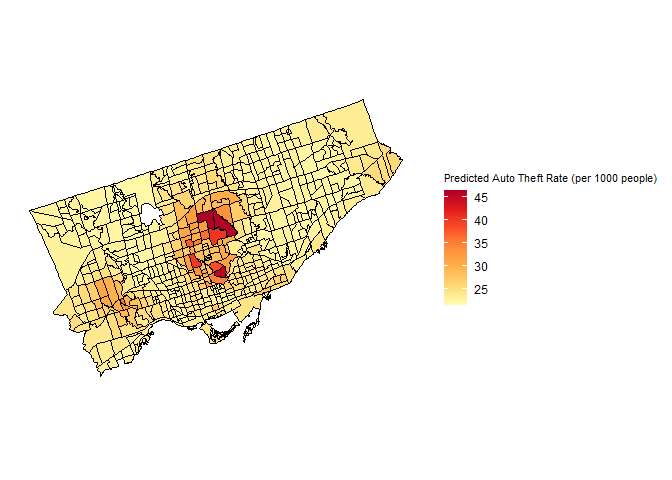
Predicted Auto Theft Rate Using a Spatial Lag ModelFigure shows the results of the spatial lag model predicting auto theft rates in each census tract in Toronto. According to Kendall’s tau correlation, Income has a weak yet significant positive correlation on the rate of auto theft, while Unemployment does not have a statistically significant correlation on the rate of auto theft. Due to the lack of a significant correlation between Unemployment and the rate of auto theft, only Income was considered as a predictor on the rate of auto theft for each census tract. Based on the results of the regression analysis, income exhibits a linear relationship with the rate of auto theft, thus it was included as a linear predictor of auto theft to reflect the linear relationship between these two variables. The threshold and bandwidth chosen for this model was 2222m and 1500m, respectively, and the model produces an AIC value of 5405.5. The p-value of residual autocorrelation is 0.10876, indicating that the model somewhat accurately captures the spatial pattern present in the observed data.
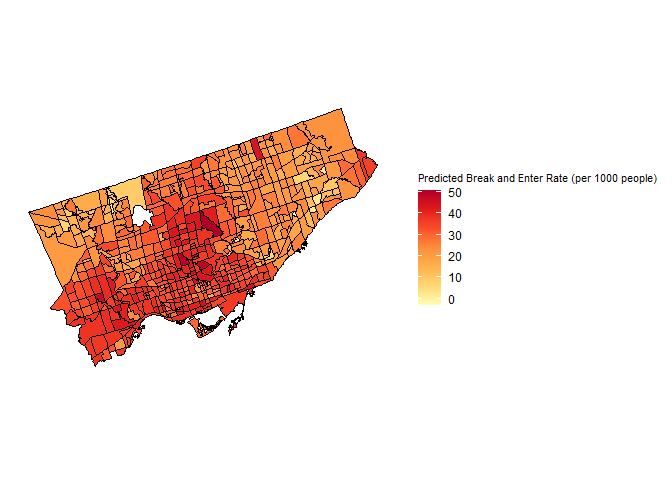
Predicted Break and Enter Rate Using a Spatial Lag ModelFigure shows the results of the spatial lag model predicting break and enter rates in each census tract in Toronto. According to Kendall’s tau correlation, both income (positive) and unemployment (negative) have moderate, significant correlations on the rate of break and enter crimes in each census tract, thus both variables were included as predictors of break and enter rate in the model. Based on the results of the regression analysis, both income and unemployment exhibit linear relationships with the rate of break and enter crimes, thus both variables were included as linear predictors of break and enter crimes to reflect the linear relationship between these variables. The threshold and bandwidth chosen for this model was 3800m and 2000m, respectively, and the model produces an AIC value of 5562. The p-value of residual autocorrelation is 0.093364, indicating that the model somewhat accurately captures the spatial pattern present in the observed data.
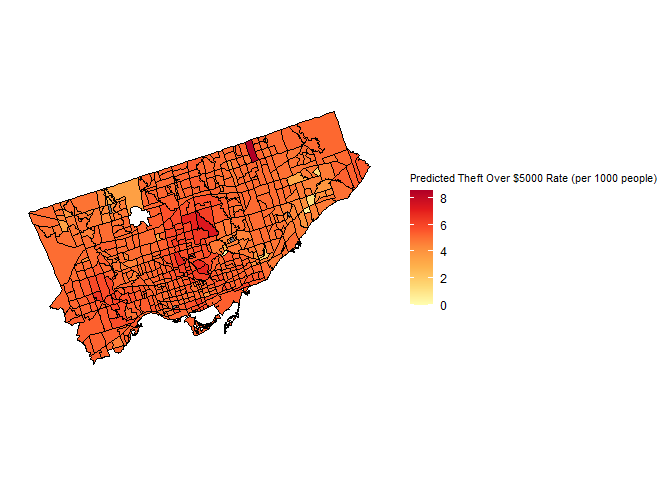
Predicted Theft Over $5000 Rate Using a Spatial Lag ModelFigure shows the results of the spatial lag model predicting theft over $5000 rates in each census tract in Toronto. According to Kendall’s tau correlation, both income (positive) and unemployment (negative) have weak yet significant correlations on the rate of theft over $5000 in each census tract, thus both variables were included as predictors of theft over $5000 rate in the model. Based on the results of the regression analysis, income exhibits a linear relationship with robbery rate, while unemployment is characterized by a cubic relationship. Due to this observation, income was included as a linear predictor, and unemployment was included as a cubic predictor to more accurately reflect the linear relationship between income and theft over $5000 rate, and the nonlinear relationship between unemployment and theft over the $5000 rate. The threshold and bandwidth chosen for this model were 2222m and 1500m, respectively, and the model produces an AIC value of 4156.3. The p-value of residual autocorrelation is 0.0028469, indicating that the model does not accurately capture the spatial pattern present in the observed data, since there is still significant spatial autocorrelation in the residuals.
When considering all four models together, Figure , the model for the rate of robbery, is the most accurate representation of the observed data. The p-value of residual autocorrelation for this model is the highest of any, at 0.84716, and has the second-lowest AIC value at 4779.4. None of the models are particularly effective at modeling the type of crime, as shown in the high AIC values produced by every model, due to complex relationships between socioeconomic status and rate of crime, as well as missing context variables. The most glaring omission is the lack of vehicle ownership statistics in the case of predicting auto theft crime rates, as in the observed data, Etobicoke falls victim to the highest number of auto theft crimes per 1000 people, yet this relationship is not expressed in either income or unemployment data.
After the analysis of census tracts in Toronto in various ways, they reveal distinct spatial patterns in income, unemployment, and various types of crime. Higher income areas, particularly in the center of northern Old Toronto and South-Central Etobicoke, exhibit lower unemployment rates but are not immune to crime. Robbery, break and enter, and theft over $5000 are concentrated downtown, northern Scarborough, and North York, while auto theft primarily occurs in Etobicoke. Our spatial autocorrelation analysis confirms these patterns are non-random; however, when performing a Kendall Tau correlation and linear regression to determine if there is a true relationship between these variables, for the most part, the correlation for each tends to be weak. While income is weakly and negatively associated with robbery, it correlates positively with auto theft, break and entering, and theft over $5000. Unemployment shows a weak, positive correlation with robbery, and a moderately negative one with break and entering. Auto theft appeared to have the least statistically significant relationship with income and unemployment, most likely due to lack of vehicle ownership statistics as well as them having the highest likelihood to be located at intersections, where they do not belong to any one census tract. The most accurate spatial lag model produced (Figure ) indicates that robbery occurs at lower rates in central Toronto, where the highest income households reside.
While there are some statistically significant trends, the complexity of factors influencing crime suggests that while spatial lag models provide some predictive power, they cannot fully predict exactly where and why various crimes take place. It is recommended that further research be done with a higher degree of accuracy to truly determine whether these factors play a large role in theft related crimes. Additionally, conducting an analysis on more recent data such as the upcoming census data that will be collected in 2026 would also be recommended as it would provide a more contemporary model of how these factors impact crimes across Toronto.
Baianchi, G., & Chen, Y. (2021, March 21). Testing effects of hospitality employment on property crime in the United States. SageJournals. https://journals.sagepub.com/doi/10.1177/13548166211001180
City of Toronto. (2023, January 31). Ward Profile: Etobicoke North. https://www.toronto.ca/city-government/data-research-maps/neighbourhoods-communities/ward-profiles/
Dızman Zeynep Şentürk (2020). Analyzing crime and unemployment from a sociological perspective. pamukkale university journal of social sciences institute. https://doi.org/10.30794/pausbed.789991
Government of Canada. (2023, July 27). Police-reported crime statistics in Canada, 2022. https://www150.statcan.gc.ca/n1/daily-quotidien/230727/dq230727b-eng.htm
Moreau, G. (2022, August 2). Police-reported crime statistics in Canada, 2021. Government of Canada, Statistics Canada. https://www150.statcan.gc.ca/n1/pub/85-002-x/2022001/article/00013-eng.htm
Oecd. (2024, April). Regional Demography: Toronto . OECD.Stat. https://stats.oecd.org/Index.aspx?DataSetCode=REGION_DEMOGR
Fanfair, R. (2024, February). Bold Partnerships Needed to Fight Auto Theft. Toronto Police Service. https://www.tps.ca/media-centre/stories/bold-partnerships-needed-to-fight-auto-theft/
SoCalCycling. (2022, February 17). Bicycle theft is becoming increasingly common. SoCalCycling.com. https://socalcycling.com/2022/02/28/bicycle-theft-is-becoming-increasingly-common/
Toronto Police Service. (2024a, April 4). TPS Crime Statistics - Auto Theft. Toronto Police Service Public Safety Data Portal. https://data.torontopolice.on.ca/pages/auto-theft
Toronto Police Service. (2024b, April 15). TPS Crime Statistics - Bicycle Thefts.
Toronto Police Service Public Safety Data Portal. https://data.torontopolice.on.ca/pages/bicycle-thefts
