Polkadot monitoring service
Project Overview
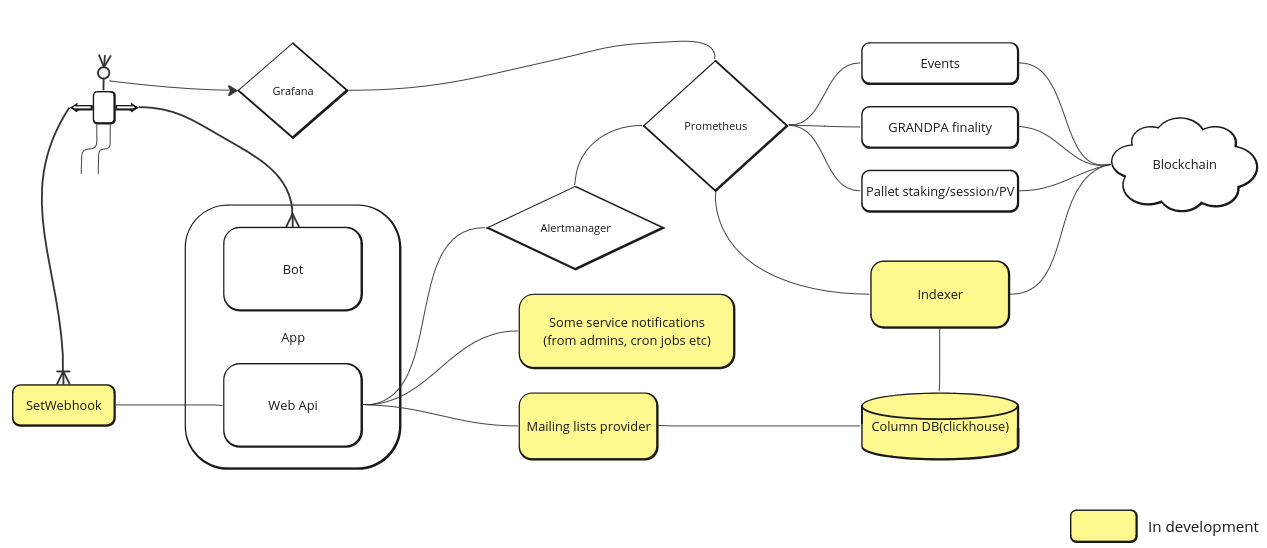
Monitoring as a Service is a tool to track important metrics about ALL validators in Polkadot and Kusama networks using a user-friendly dashboard or subscribe to network events using flexible filters via the Telegram bot. For experienced and demanding we also plan to provide an API. The project is built on top of the well-known open-source monitoring solutions: Prometheus, Grafana, and Alertmanager and represents a set of exporters, a tg bot (written using AIOgram and AIOHTTP), and web API.
Service implementations
- Portable version(current project):
NOTE In the portable version deploy of Grafana and the bot are independent. Bot just generates and saves local values.yml file.
In the current repository, we provide:
- Full exporters collection (please see a picture above or read an explanation of each below)
- Prometheus with a minimal set of alert expressions. Alert manager connected.
- Alertmanager with webhook sender and route(send alerts to the bot)
- Grafana with a provisioned dashboard that contains some useful graphics
- Telegram bot
Everything dockerised. docker-compose.yml is presented.
- Monitoring as a Service (cloud version of a service)
- Available via @p2pvalidator_monitoring_bot
- We maintain infrastructure and provide all support. No need to host anything.
- Metrics TTL = 30 days.
- 24/7/365 availability.
Components
- Telegram Bot
- Grafana instance deploy/destroy option
- Prometheus alerts enable/disable option
- Users support
- Administrators area(group chat)
- What administrators can do:
- Enable/Disable accounts
- Participate in support conversations with clients. Can text any client through a bot.
- Destroy grafana instance
NOTE Administrators receive into group chat each event client did with the bot (completed action).
- Metrics
Common exporter:
polkadot_staking_currentEra(chain) Current erapolkadot_staking_eraProgress(chain) Era progress in percentpolkadot_staking_totalPoints(chain) Amount of points earned by the whole networkpolkadot_staking_eraPoints(chain, account) Amount of points earned by validator in the current erapolkadot_staking_validatorsChart(chain, account) Validator's position from best to worstpolkadot_session_currentSession(chain) Current session indexpolkadot_session_sessionProgress(chain) Session progress in percentpolkadot_session_validators(chain, account) Is validator active or notpolkadot_session_paraValidators(chain, account) Paravalidator statuspolkadot_pv_pointsMedian(chain, account) Median ParaValidator points ratiopolkadot_pv_pointsAverage(chain, account) Average ParaValidator points ratiopolkadot_pv_pointsP95(chain, account) ParaValidator points ration 95 percentilepolkadot_pv_eraPoints(chain, account) Amount of points earned by ParaValidator in the current sessionpolkadot_pv_paraValidatorsChart(chain, account) ParaValidator's position from best to worst
Finality exporter:
polkadot_finality_roundProcessed(chain) Processed round - Rounds processedpolkadot_finality_prevotes(chain, account) - Amount of success prevotes by validatorspolkadot_finality_precommits(chain, account) - Amount of success precommits by validators (became to 2/3)
Events exporter:
polkadot_events(chain, module, method) - Occurred on-chain events counterpolkadot_events_by_account(chain, module, method, account) - Occurred on-chain events with validator account- Event examples
Balances.Deposit,Balances.Locked,Balances.Reserved,Balances.Transfer,Balances.Unlocked,Balances.Upgraded,Balances.Withdraw,ImOnline.SomeOffline,Proxy.ProxyAdded,Staking.Bonded,Staking.Chilled,Staking.PayoutStarted,Staking.Rewarded,Staking.SlashReported,Staking.Unbonded,Staking.ValidatorPrefsSet,Staking.Withdrawn,TransactionPayment.TransactionFeePaid,VoterList.Rebagged,VoterList.ScoreUpdated ParasDisputes.DisputeConcluded- accounts considering candidate is Invalid, but majority conclusion = Valid
- Event examples
How to setup, run, and test
- Install Docker and Docker Compose from https://docs.docker.com/engine/install/ or any other compose-compatible tool and container runtime
- (Optional) Add RPC endpoints to config files
polkadot.envandkusama.envin the following format:
WS_ENDPOINT="ws://your-node1:9944"
WS_ENDPOINTS="http://your-node1:9944,http://your-node2:9944,http://your-node3:9944/"
- Configure bot by adding telegram bot api token and group chatId for administrators to
bot.envUse@botfatherto create bot. Don't forget to add your bot to administrators group. - Run the exporters, grafana and tg bot:
- directly via docker-compose:
docker-compose -f docker-compose.yml -f polkadot.yml -f kusama.yml up- will start exporters for polkadot and kusamadocker-compose -f docker-compose.yml -f polkadot.yml up- will start exporters only for polkadotdocker-compose -f docker-compose.yml -f kusama.yml up- will start exporters only for kusama
- directly via docker-compose:
- Inspect the dashboard (default username and password
admin,admin) - Inspect the tg bot:
- Contact with your bot. Command
/startwill be good:) - Try to build or destroy grafana instance(local version generates only
values.ymlwhich needed to provide to Grafana) - Subscribe/Unsubscribe on alerts from prometheus.
- Contact with your bot. Command
References
- https://github.com/polkascan/py-substrate-interface - Python Substrate Interface. Many thanks to
Stichting Polkascan (Polkascan Foundation)for amazing library implimentation which successfully used in exporters. - https://github.com/itering/scale.go - Go implementation of scale codec
- https://wiki.polkadot.network/ - Polkadot Wiki
- https://polkadot.js.org/docs/ - Good to know
- https://docs.aiogram.dev/en/latest/ - AIOgram
- https://docs.aiohttp.org/en/stable/ - AIOHTTP
