A DIY radiation detector and logger.
The Radiation detector is built using the MightyOhm Geiger Counter Kit and a Raspberry Pi. The standard Geiger-Müller Tube that comes with the Geiger Counter Kit (SBM-20) allows for detection of beta and gamma rays. The geiger.py script provided in this repository provides the glue between the two devices and logs the data on the Raspberry Pi. The gnuplot script plot.plt can be used to average and display the data.
- A MightyOhm Geiger Counter kit.
- A Raspberry Pi.
- Tools to assemble the geiger counter kit and some wires to connect the geiger counter to the Pi.
- Wire everything up according to this image.
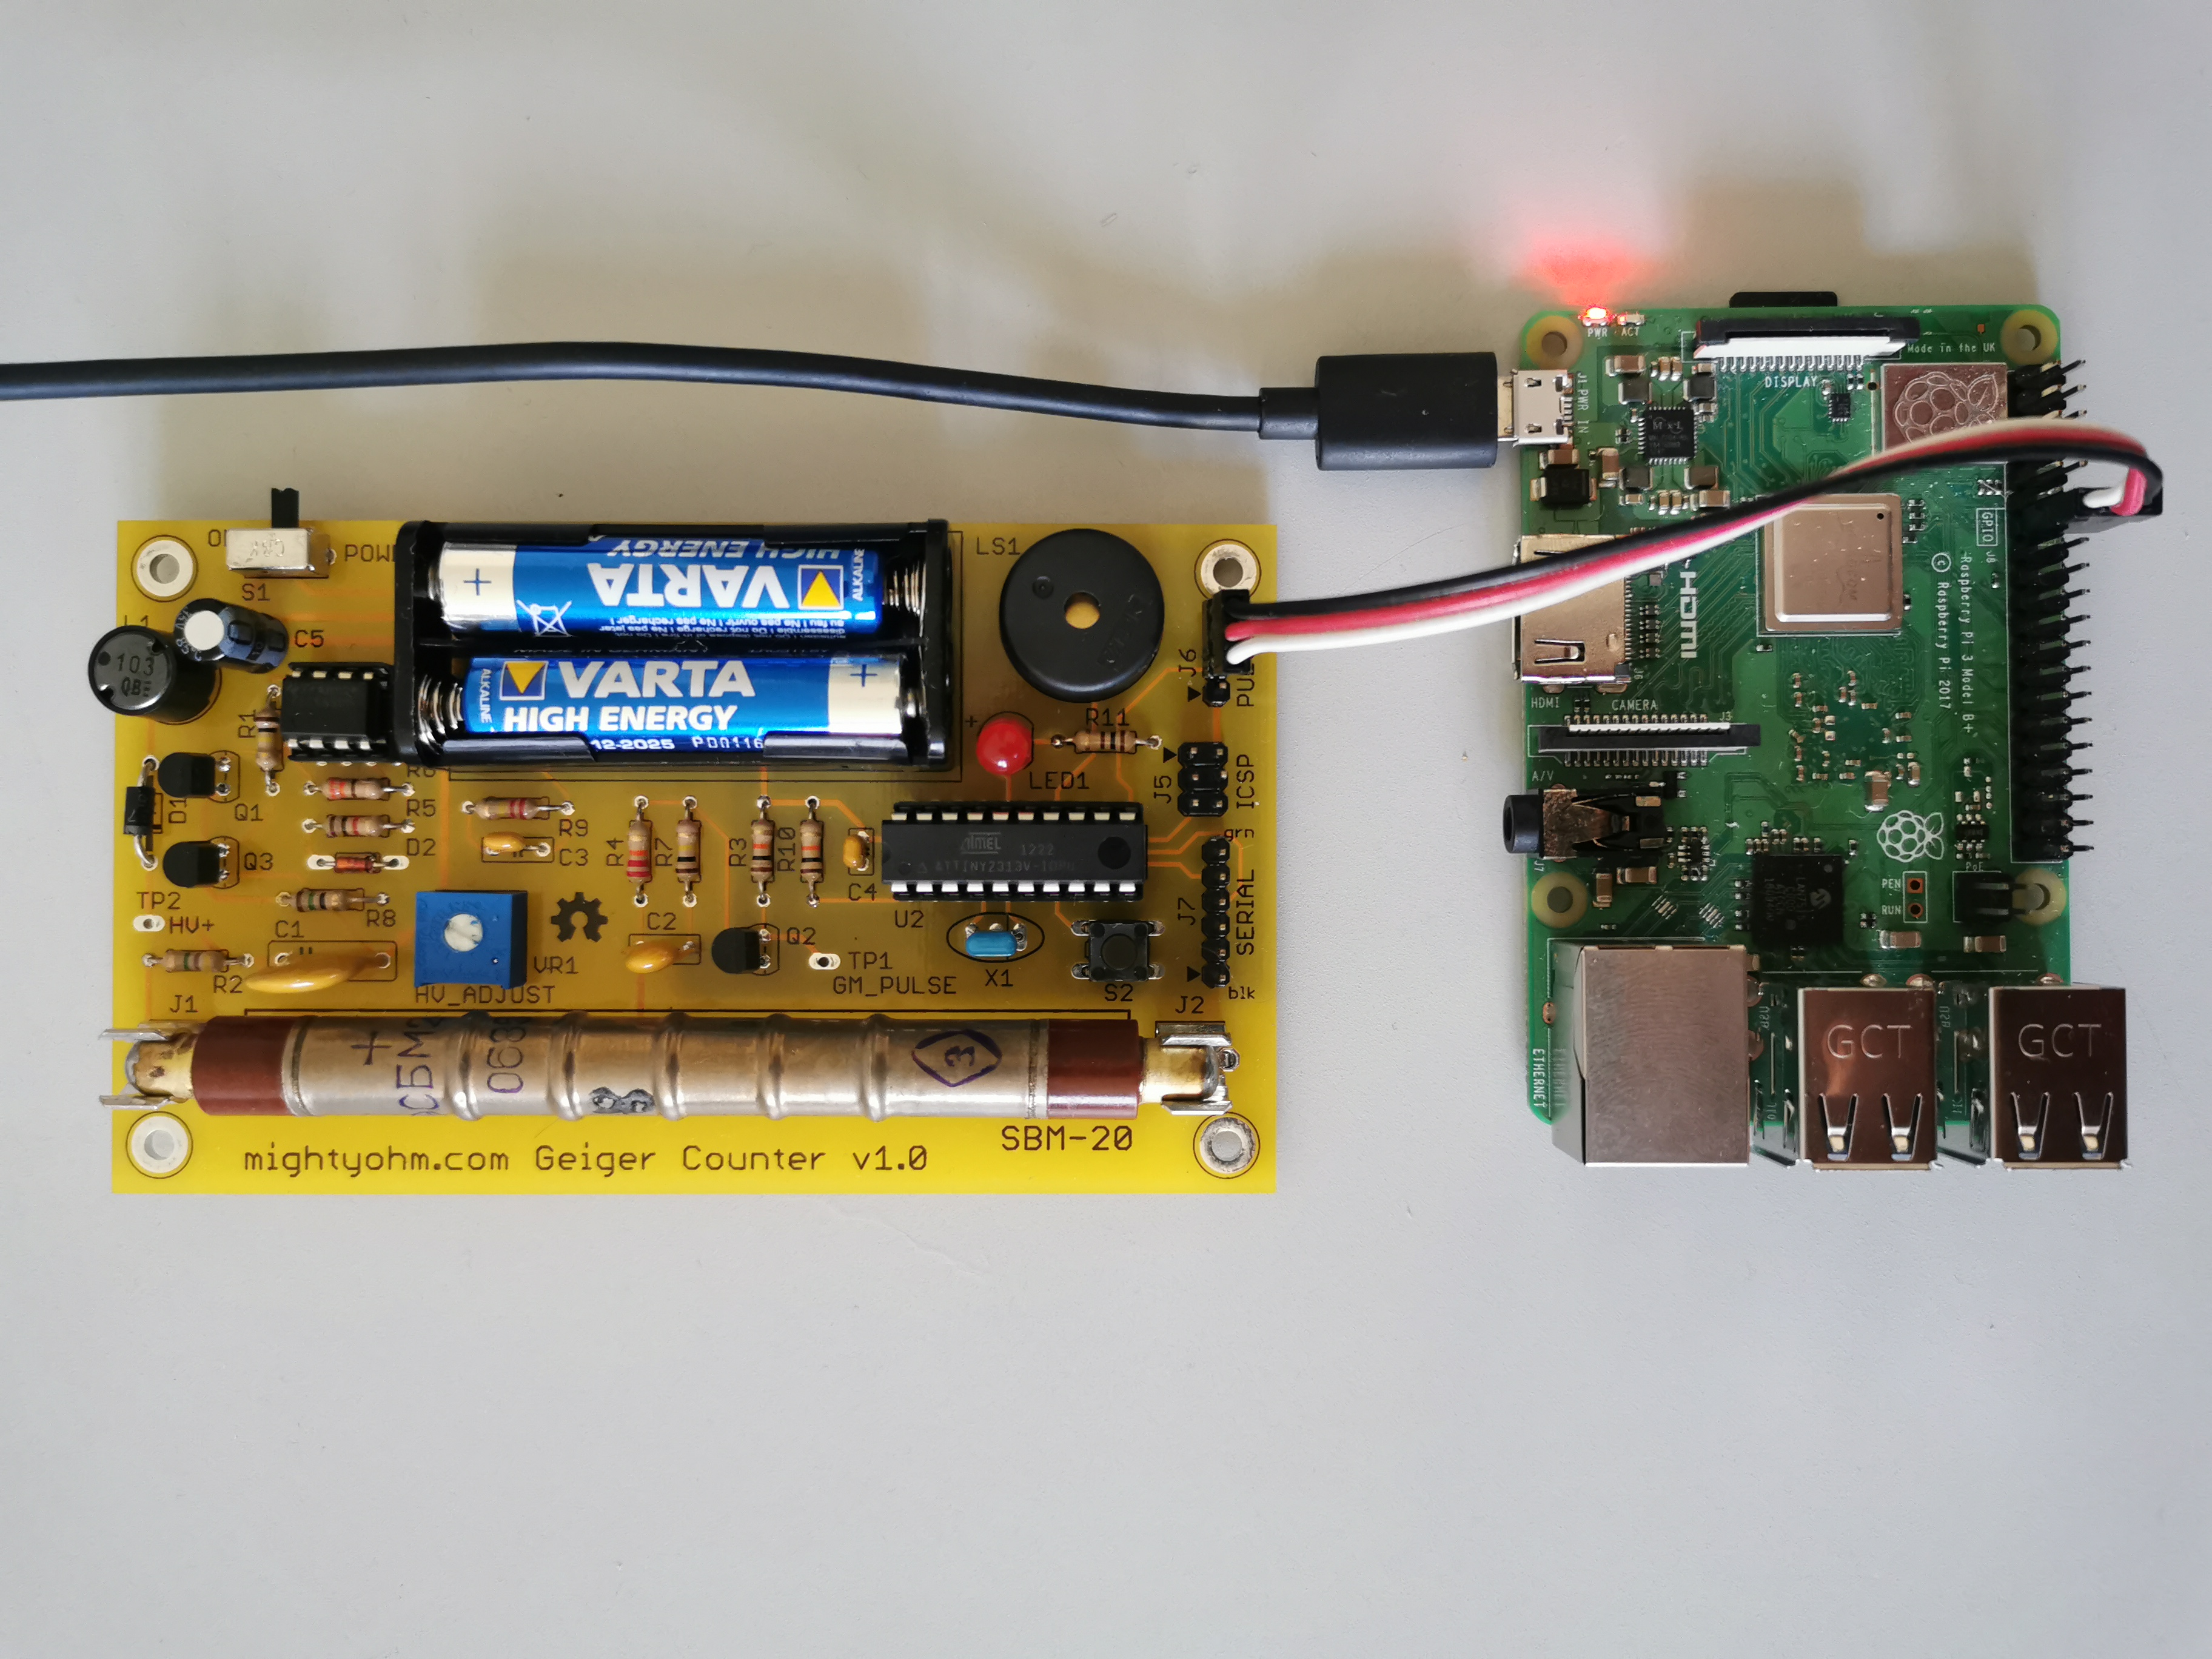
- Copy geiger.py to the Pi and make sure the pins in the code match the ones that were connected!
- Run the script and it will save the data in detections.txt in the same folder.

Optionally
- Set up a systemd service file to run the script on every boot of the Pi.
- Set up X11-forwarding to plot the data in real time using, for example, the provided gnuplot script.
- Use some kind of web API to share the data and make it accessible online.
A file detections.txt is written on the Pi with one line of output for every minute.
Timestamp, minute, detections, μS/h

2020-02-15_12:21:00 3 29 0.1653
2020-02-15_12:22:00 4 23 0.1311
2020-02-15_12:23:00 5 21 0.1197
2020-02-15_12:24:00 6 19 0.1083
2020-02-15_12:25:00 7 18 0.1026
2020-02-15_12:26:00 8 28 0.1596
2020-02-15_12:27:00 9 25 0.1425
For the SBM-20 Geiger-Müller Tube the number of detections per minute can be converted to μS/h using the formula
μS/h = detections/minute * 0.0057
The explanation for the factor can be found here.
Running the gnuplot script plot.plt should give a graph similar to this (roughly 0.1311 μS/h)
