"The scientific man does not aim at an immediate result. He does not expect that his advanced ideas will be readily taken up. His work is like that of the planter - for the future. His duty is to lay the foundation for those who are to come, and point the way."
- Nikola Tesla
A Clojure library that lets you create nice dashboards with interactive charts to monitor your applications in multiple environments.
This library was developed with Graphite as a data provider in mind.
You have to set up a small Ring/Compojure application, that will hold your oscillator.
Building the required routes is easy:
;; building compojure routes for your dashboard
(oscillator-routes :page-config               your-page-config
                   :chart-def-fetch-fun       get-chart-definitions
                   :annotation-event-targets  [])
Dashboards, navigation, charts, detail views ... everything will be rendered for you. You just have to provide some information about the page and what charts should be rendered.
{:base-url       "http://graphite.example.com/"        ;; your graphite server
 :pages          [...]                                 ;; see -> Pages
 :environments   [{:key "dev" :name "DEV"}
                  {:key "pre-prod" :name "PRE"}
                  {:key "production" :name "PROD"}]
 :default-params {:env        "production"
                  :from       "-24h"
                  :until      "-1min"
                  :resolution "10min"
                  :ymax-mode  "fix"
                  :stay       "false"}
 :replace-rules  {}                                    ;; see -> Replace Rules
 :context-path "/path"                                 ;; an optional context-path
 :add-js-files   ["/javascript/your-additional.js"]    ;; additional javascript files
 :add-css-files  ["/stylesheets/your-additional.css"]} ;; additional stylesheet files
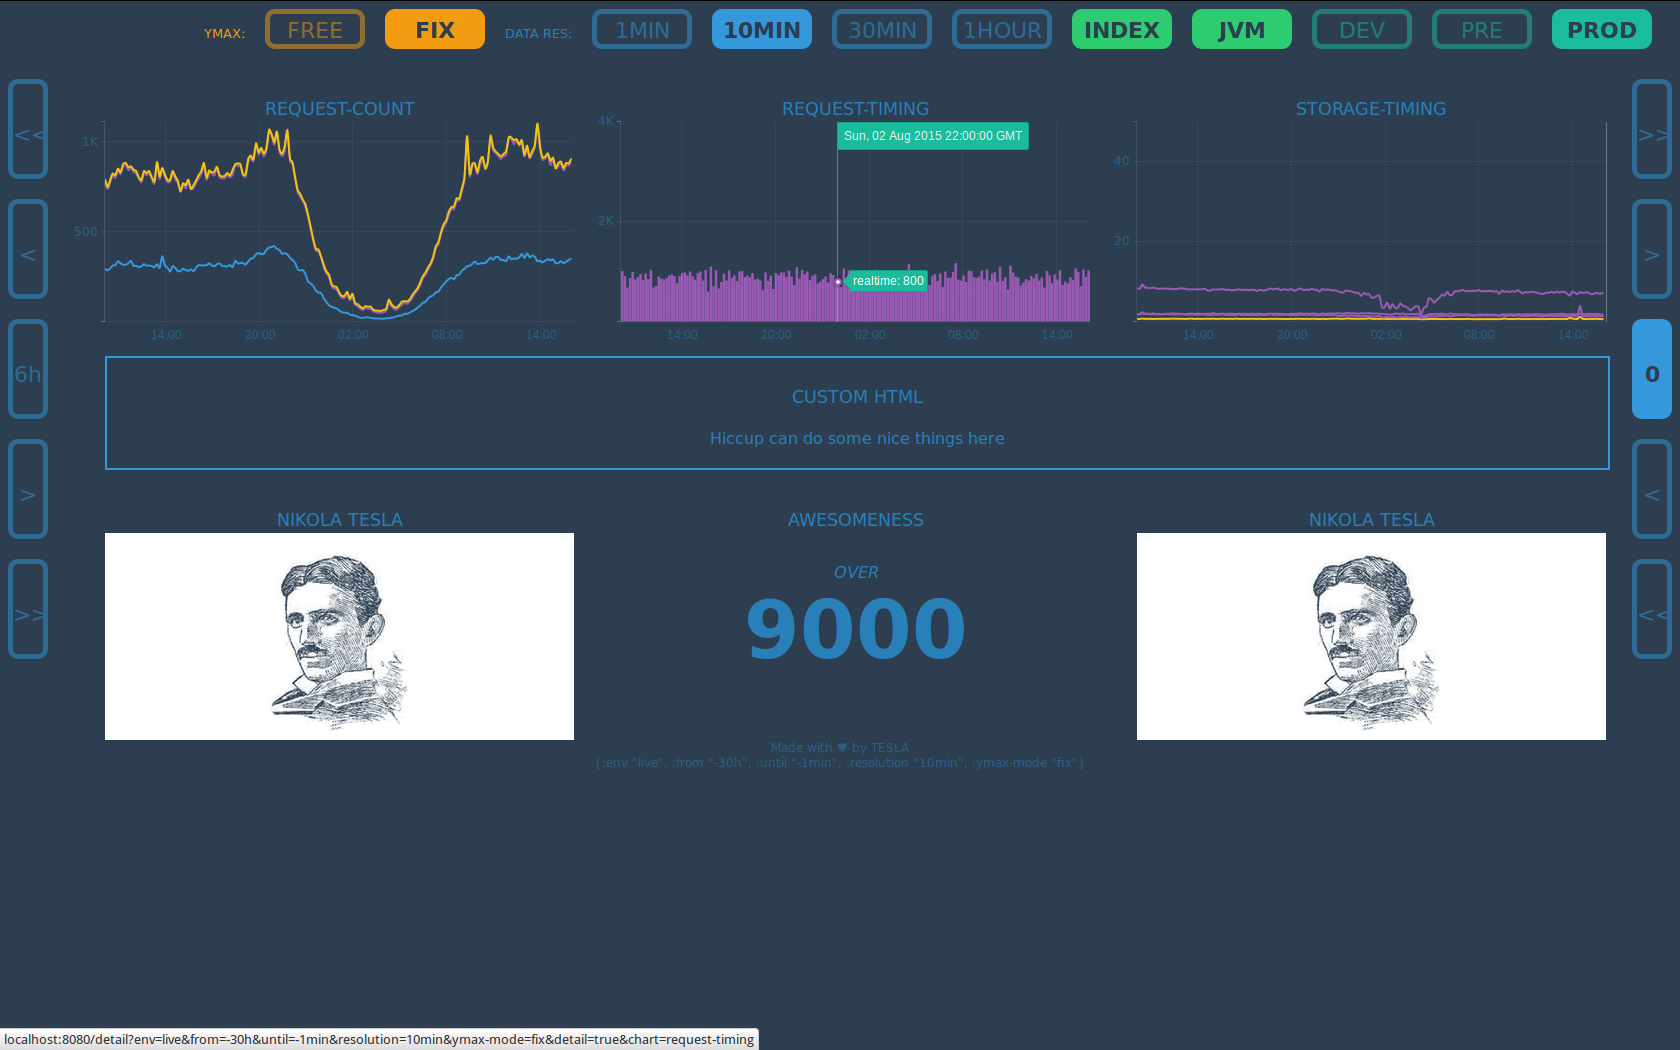
Pages are collections of tiles, that can be accessed under a given url. Each configured
page will get a button in the navigation bar. Currently there are 4 different types of tiles
supported: chart, image, number, plain-html, html-fn
Pages are defined in a list of hash-maps like this:
[
 {:name    "INDEX"
  :heading "Overview"
  :url     "/"
  :type    :dashboard
  :tiles   [{:type   :chart
             :params {:chart-name :request-count}}
            {:type   :chart
             :params {:chart-name :request-timing}}
            {:type   :chart
             :params {:chart-name :exceptions-count}}
            {:type   :image
             :params {:src     "nikola-tesla.png"
                      :heading "NIKOLA TESLA"}}
            {:type   :html-fn
             :params (fn [page-config url-params] [:div [:h2 "CUSTOM HTML"]])}
            {:type   :pie-chart
                      :params {:title   "MY-PIE"
                              :data-fn (fn [page-config url-params] [{:text "first" :value 34}
                                                                    {:text "second" :value 14}])}}
            {:type   :number
             :params {:heading "Awesomeness"
                      :descr   "OVER"
                      :num     9000}}
            {:type   :number
             :params {:heading "Offset"
                      :descr   "Last offset for stats"
                      :target  (dsl/max-series "app-serv-#{env}.*.metrics.stats.offset")}}
            {:type   :plain-html
             :params [:div {:class "col"}
                      [:h2 "CUSTOM HTML"]
                      [:span "simply use hiccup"]]}]}
 {:name  "JVM"
  :heading "JVM Stats"
  :url     "/"
  :type    :dashboard
  :tiles   [...]}}
]
Replace Rules are a hash-map of lookup-patterns as keys and simple transformation functions as values.
{:env          (fn [env] env)
 :logging-env  (fn [env] ((keyword env) {:production "live"} "dev"))}
Every rendered graphite target will be transformed by those replace rules. If a lookup-pattern
is found, it will be replaced by the result of the transformation function,
while the :key of the current environment is passed as the argument.
These targets:
...&target=app-server.#{env}.request.count&target=logging-server.#{logging-env}.error.count
and the rules from above and pre-prod as the current env would result
in a graphite request these target:
...&target=app-server.pre-prod.request.count&target=logging-server.dev.error.count
You have to provide a lookup-function that can return a hash-map of all charts. The keys in this map are used to specify a chart in Pages & Tiles configuration.
Each chart can hold multiple targets (data series in the graph). Each data series
has a key (used as name) and a target (a graphite query). Additional attributes
can be defined: color, renderer
(defn chart-definitions [env]
  {:request-count  {:targets {:request-count   {:target   (req-count-target)
                                                :color    "#0000ff"}
                              :bounces         {:target   (bounces-target)
                                                :color    "#ff00ff"}}}
   :request-timing {:targets {:request-count   {:target   (req-count-target)
                                                :color    "#0000ff"}
                              :request-timing  {:target   (req-timing-target)
                                                :renderer "bar"}}}
  }
)
Graphite targets can be defined with a simple and easy to read DSL, so you don't have to write those hard to maintain string-monsters.
Some examples:
(defn req-count-target []
  (dsl/sum-series
    (dsl/non-negative-derivative "app-serv-#{env}.request.count")))

(defn bounces-target []
  (dsl/keep-last-value
    (dsl/max-series "app-serv-#{env}.*.metrics.stats.offset")))

(defn reuse-example []
  (dsl/diff-series
    (req-count-target)
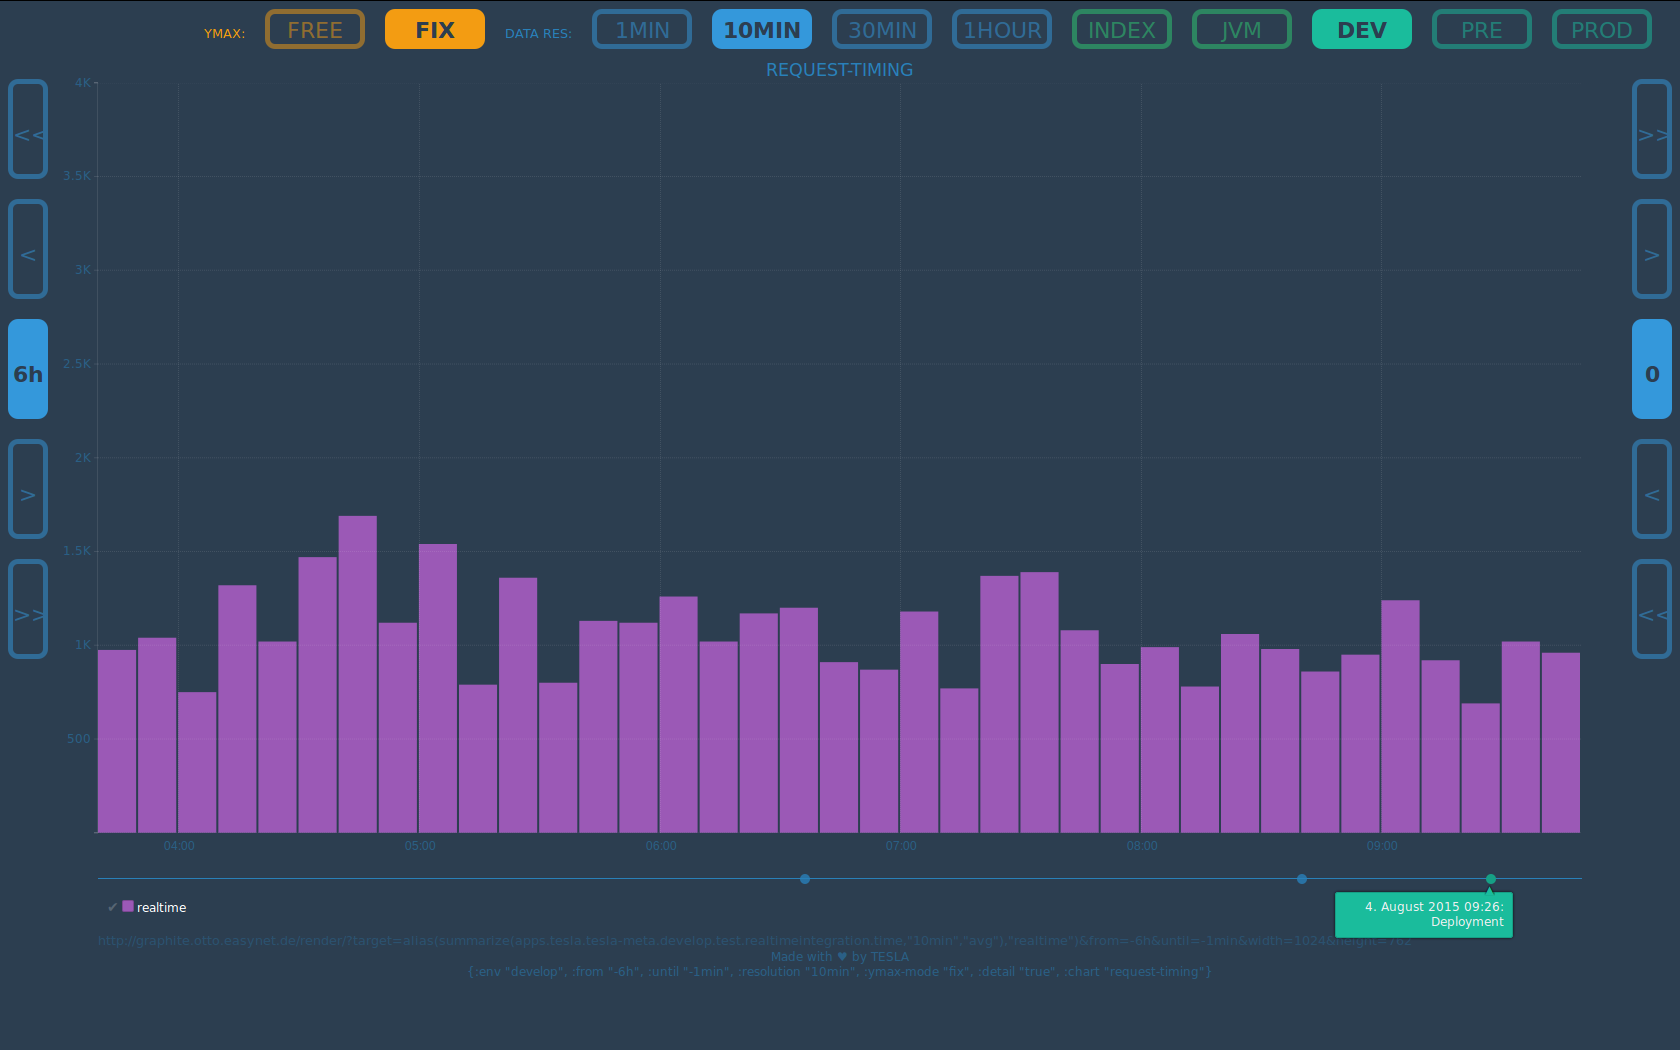
(bounces-target)))There are events, that can significantly influence your systems (e.g. deployments, reboots, etc.). To be able to see which anomaly in your chart correlates with which event, you can provide a list of Graphite-Targets that will be used for event annotation for your charts.
You can provide this list of annotation-event-targets while setting up your routes:
(oscillator-routes :page-config               your-page-config
                   :chart-def-fetch-fun       get-chart-definitions
                   :annotation-event-targets  [(dsl/aliaz "deployments.#{env}.count" "Deployment")
                                               (dsl/aliaz "chaos-monkey.#{env}.count" "Chaos Monkey")])
Annotation will be shown below all charts on detail pages.
- an add-on system, that can provide more tile types
We hope to have an example application available soon. It will be found like many others at tesla-examples.
Q: Is it any good? A: Yes.
Torsten Mangner, Christian Stamm, Kai Brandes, Florian Weyandt, Daley Chetwynd, Carl Düvel
Apache License

