Proof of concept (POC) of a recommender of time series categorical data. We use Tensorboard and nmslib for visualization and nearest neighbor queries, respectively.
The virtual conda environment can be setup via the included setup.sh script.
What is under the hood beside python standard libraries such as pandas, scipy, ...:
- nmslib: https://github.com/nmslib/nmslib
- tensorflow: https://github.com/tensorflow/tensorflow
- falcon: https://github.com/falconry/falcon
- gunicorn: https://github.com/benoitc/gunicorn
Pull-requests are welcome.
#license
Copyright 2018 Otto GmbH & Co Kg
Licensed under the Apache License, Version 2.0 (the "License"); you may not use this file except in compliance with the License. You may obtain a copy of the License at
http://www.apache.org/licenses/LICENSE-2.0
Unless required by applicable law or agreed to in writing, software distributed under the License is distributed on an "AS IS" BASIS, WITHOUT WARRANTIES OR CONDITIONS OF ANY KIND, either express or implied. See the License for the specific language governing permissions and limitations under the License.
Prepare data with integer numbers as in test/train_data_small which is used as input. Each line is one unser interaction history ordered w.r.t. time (see attached data), e.g.:
_,0
a,1
b,2
c,3
d,4
e,5
f,6
...
A map to string is needed (see attached data), e.g.:
15,8,34,15,76,77,78,38,76,79,40,76,8,50
15,15,92,15,92,15,92,15,92
15,35,38,37,39,36,40,41,35,15,35,37,39,36,38,40,41,35
29,30
68,68,15
15,6,15,6,3,4,5,15,6,15,6,15
... Naming convention:
- interaction: one single integer in the history given in the data
- event: one event contains features and targets beside having an occurence count.
We use the data to generate events. The events are sparse one-hot encoded according to the integer given in the data file. Thus, make sure, the user interactions are mapped to unique sequential integer values! For the translation, we use a mapping, defined in the interaction_map file for easier interpretation.
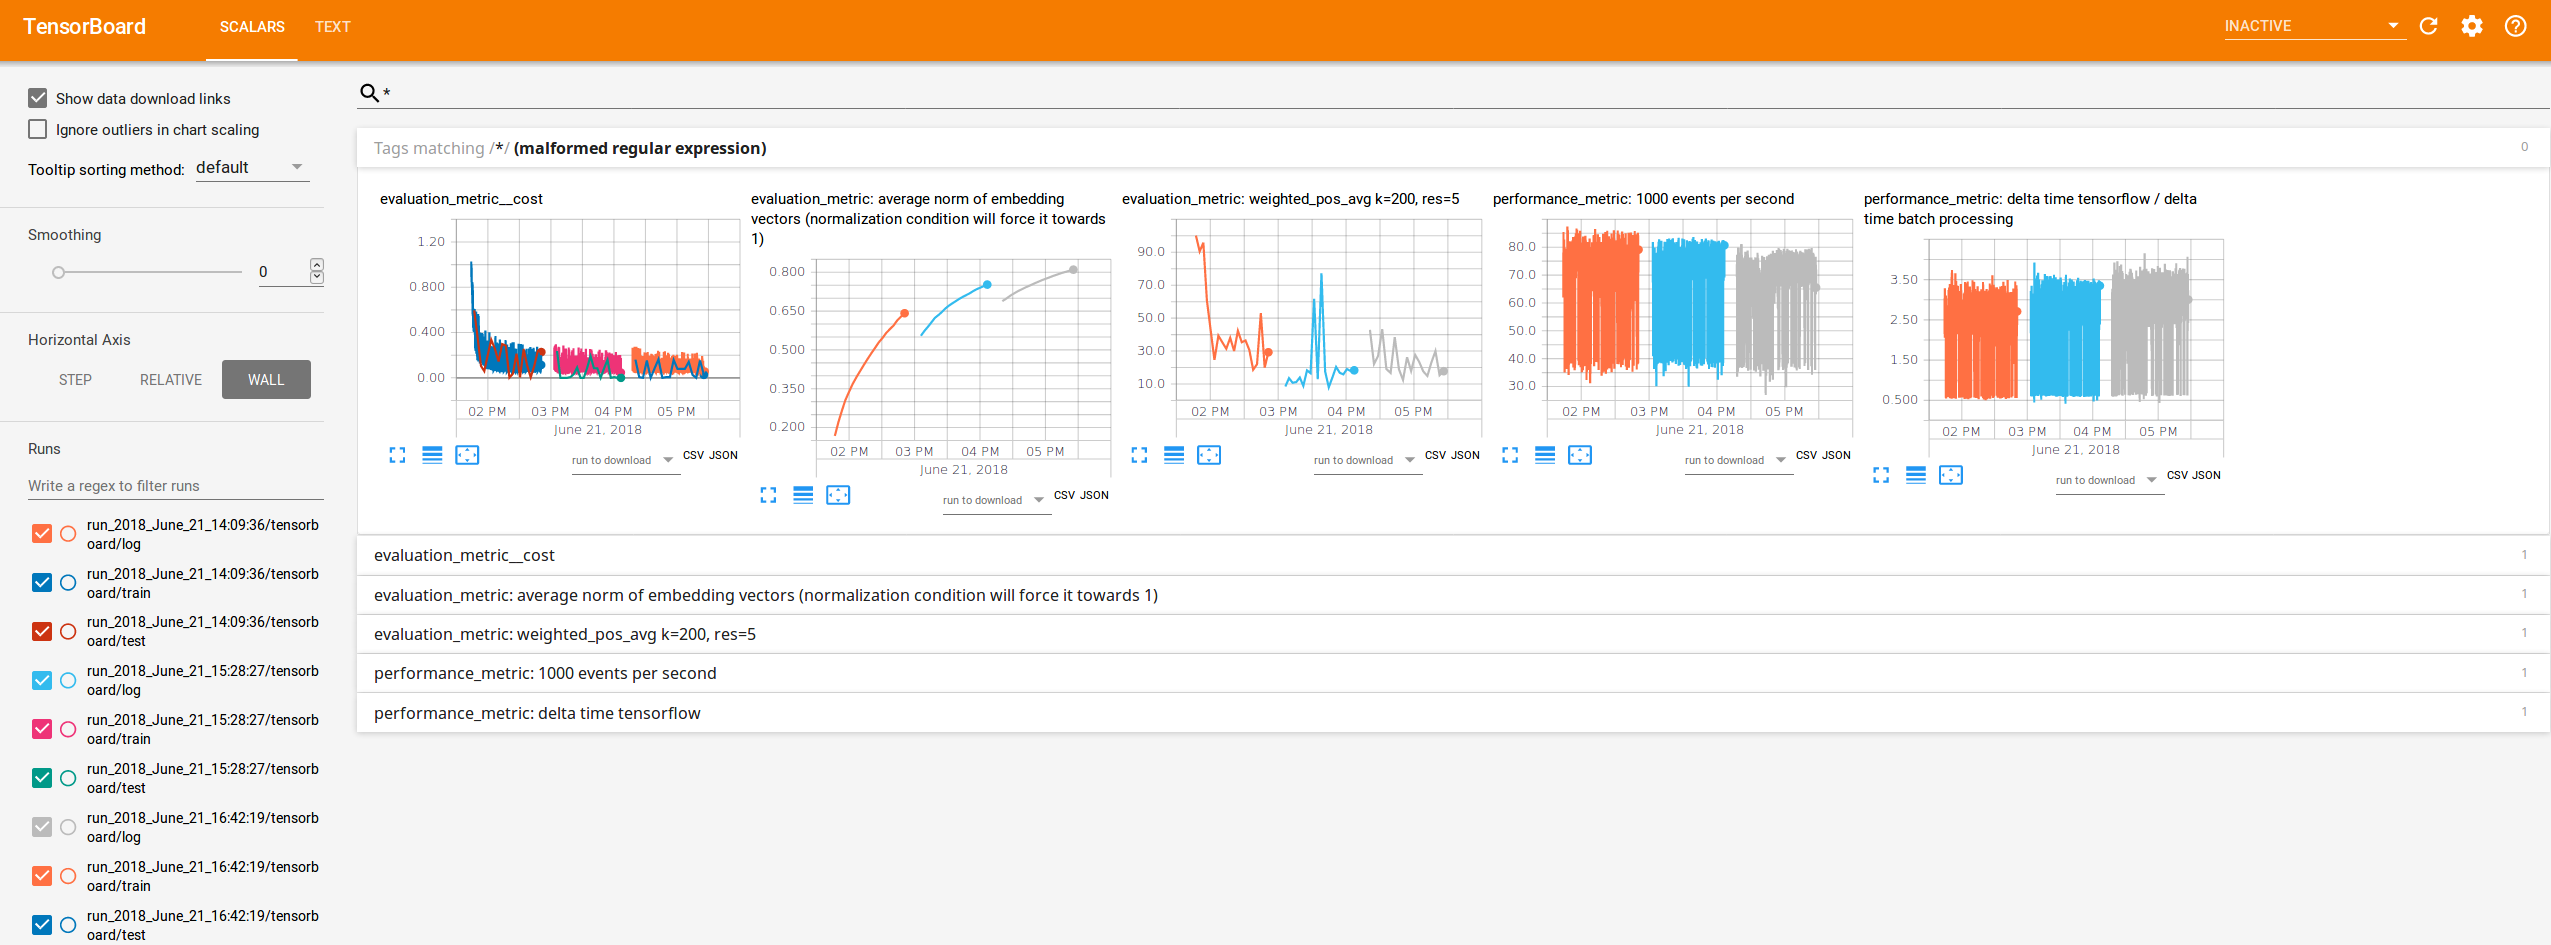
Some performance metrics are plotted with Tensorboard. Below, the three subsequent runs can be seen, each time adding new data and new cathegories up to 1 million. The metrics include TODO: explain metrics.
The (final) json file produced can be viewed via a chrome browser: chrome://tracing
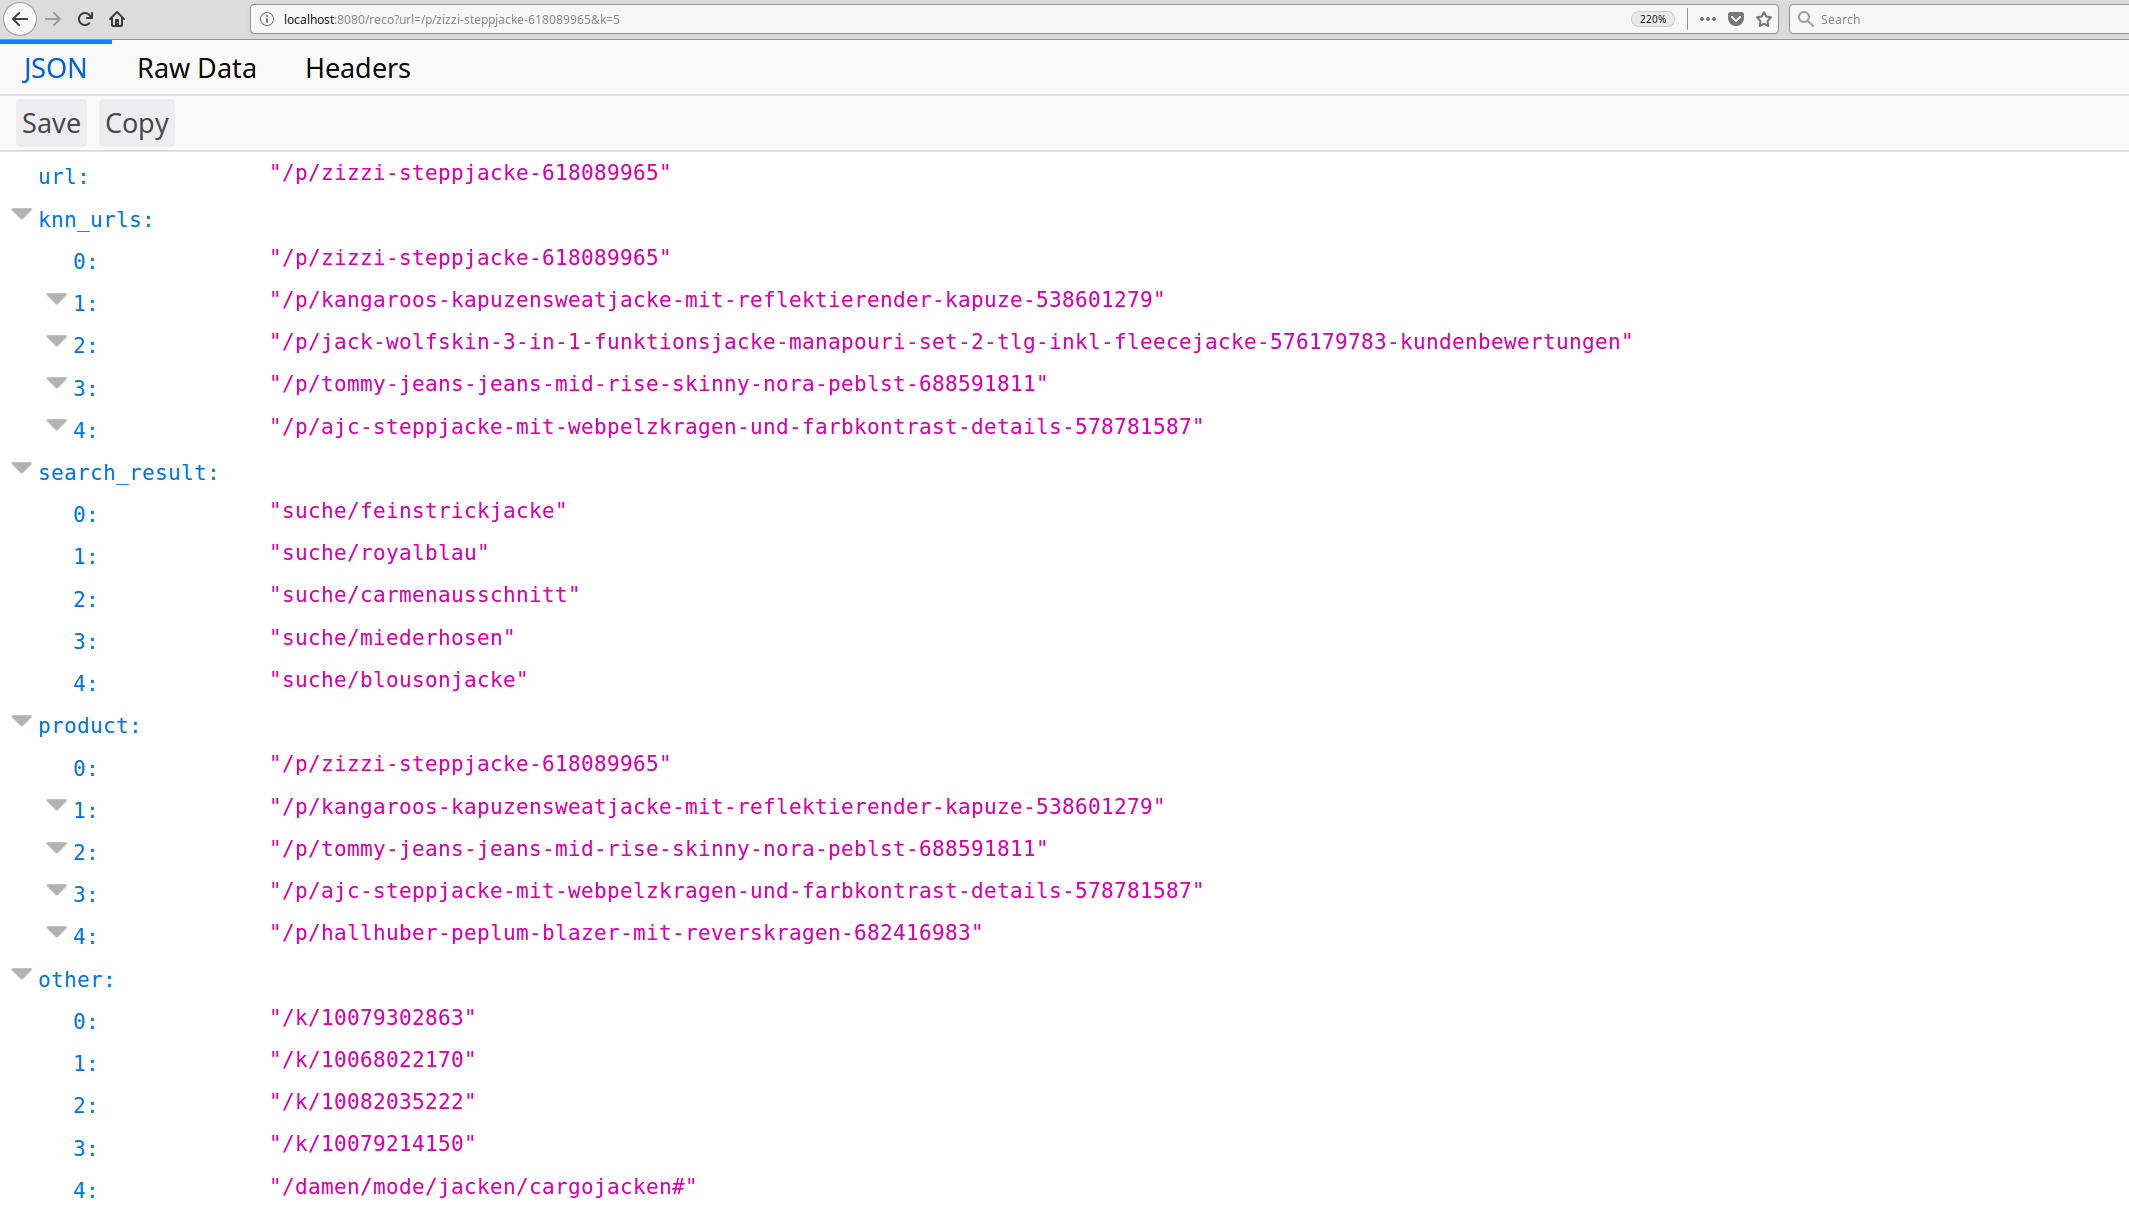
The reco rest api for a single recommender (conditional) index
is shown as example:
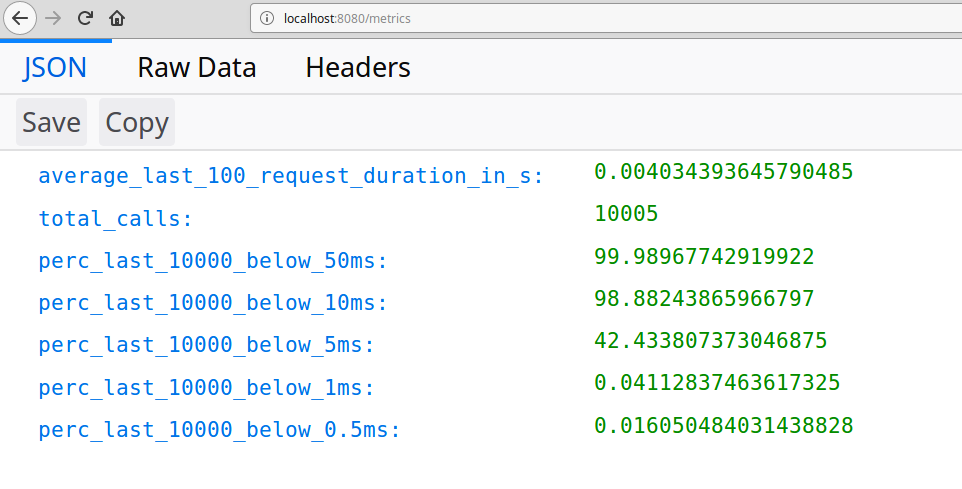
 The metrics endpoint is shown in the profiling section below.
We use gunicorn in the virtual environment (see environment.yml) to start the server. Start server (set timeout to let it create the index):
gunicorn reco:application --timeout=1500install:
sudo apt install apache2-utilsprofile via, e.g.:
ab -c 10 -n 100000 http://127.0.0.1:8000/recos?url=aaProfiling output of the rest-api calls on an i7 local machine for ca. 600 thousand items with a vector size of 100:
Percentage of the requests served within a certain time (ms)
  50%      7
  66%      7
  75%      7
  80%      7
  90%      7
  95%      8
  98%      8
  99%      8
 100%     26 (longest request)
The internal nmslib call was (shown in the metrics endpoint):

Carl says that's ok.

