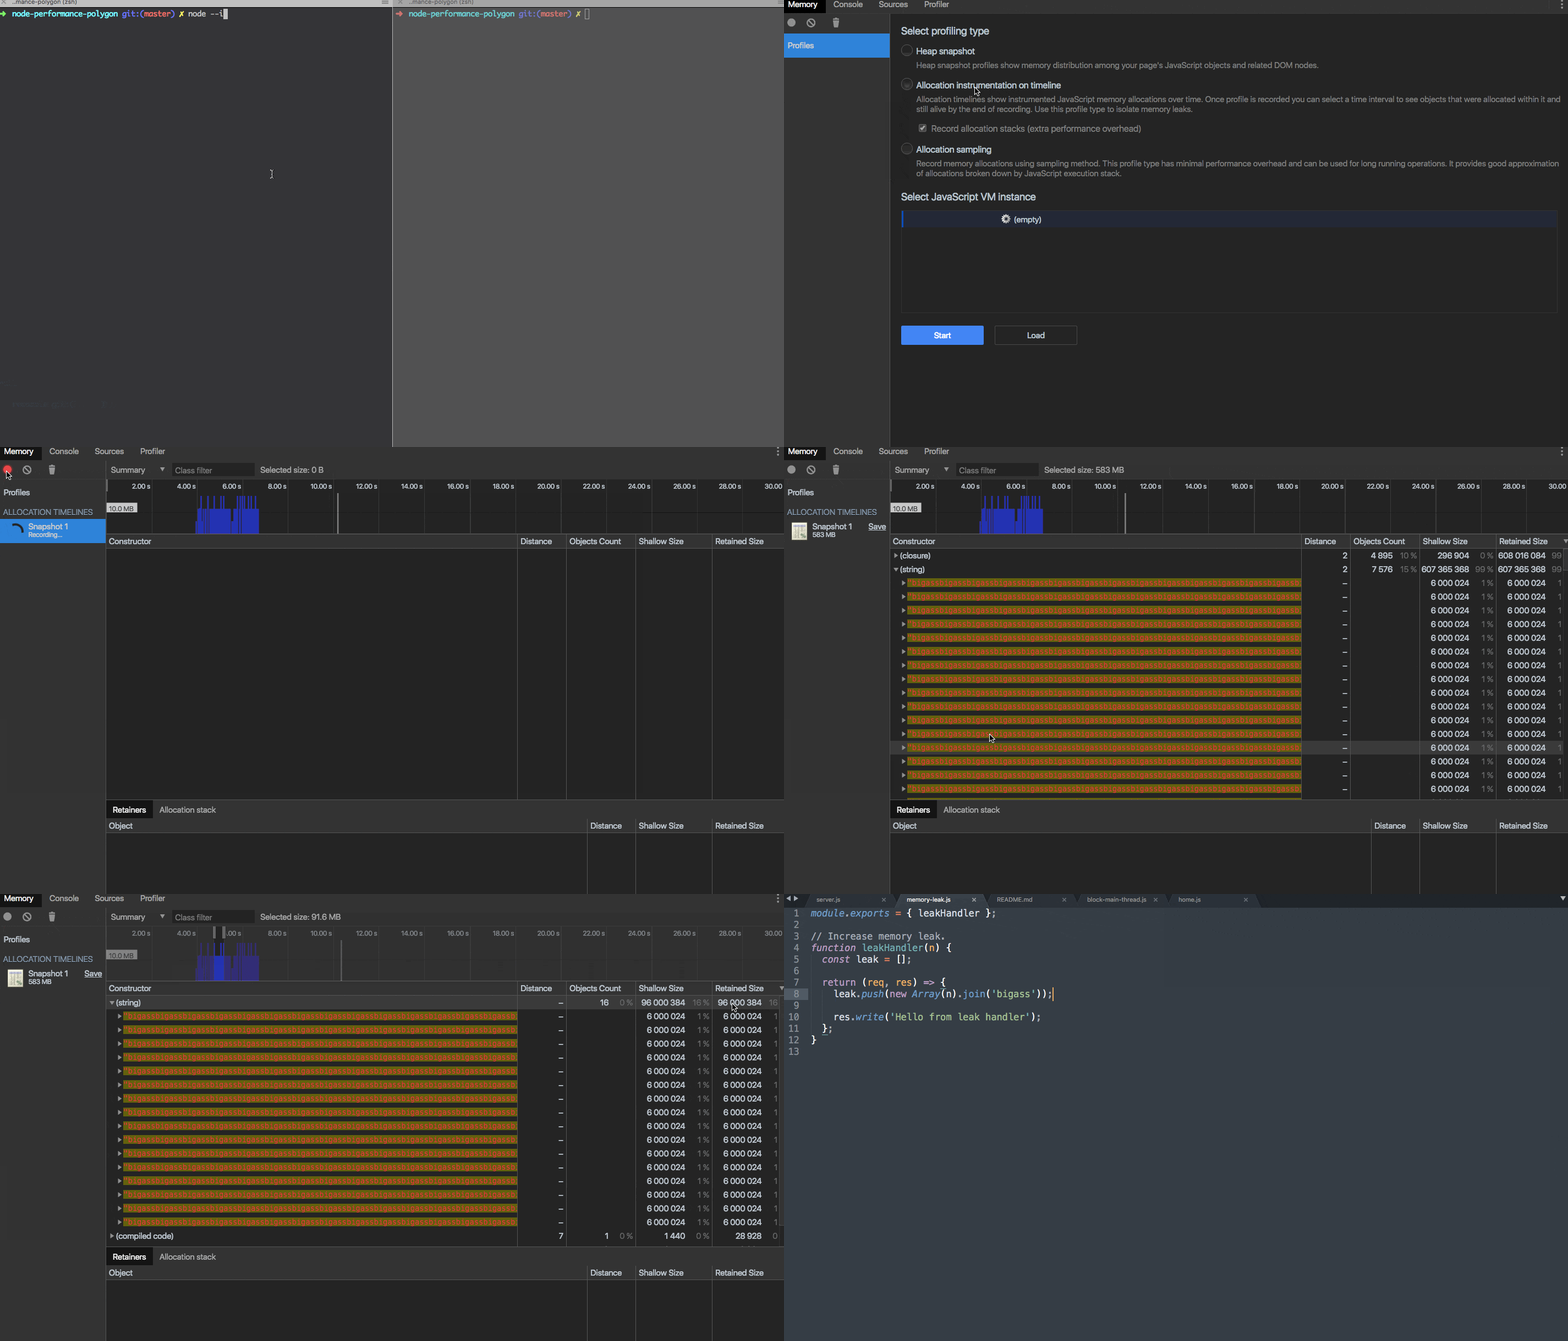
This is minimalist polygon to lear how to profile Node.js, find memory leaks, high CPU consumption, etc. It has no dependencies - only pure Node.js
It has the following endpoints:
server.js |
endpoint |
|---|---|
| '/' | "Hello World" stub (nothing dangerous) |
| '/leak' | Simple memory leak |
| '/block' | Block main thread stub |
Run server with inspect mode:
node --inspect server.js
Open the chrome dev-tools:
chrome://inspect
There you're getting power!
To not make requests manually you can use Apache Bench tool:
ab -k -c 100 -n 20000 http://localhost:7777/
Most usefull:
n - Number of requests
c - (concurrency)  Number of multiple requests to make
k - Keep Alive connection
