- The problem that must be solved is how the car product can compete in the market, and can predict the price of the product.
- What features have an impact on car prices?
- What algorithms are suitable for price prediction?
Make car price predictions so that buyers can easily calculate the price of cars in the future
Solution Statements that will be done is by applying 3 Machine Learning algorithms, which are:
- Random Forest.
Random forest algorithm is one of the supervised learning algorithms. It can be used to solve classification and regression problems. Random forest is also a frequently used algorithm because it is quite simple but has great stability. - Boosting Algorithm.
The boosting algorithm works by building a model from the training data. It then builds a second model that corrects the errors of the first model. Models are added until the training data is well predicted or has reached the maximum number of models to add. - K-Nearest Neighbor.
KNN is a relatively simple algorithm compared to other algorithms. The KNN algorithm uses 'feature similarity' to predict the value of each new data point. In other words, each new data point is assigned a value based on how similar it is in the training set.
By applying the 3 algorithms above, it will be sought which algorithm has the smallest error rate or error. So that the predicted price is close to the original price.
The data or datasets used in this machine learning project are the following 100,000 UK Used Car Data set that was obtained from the kaggle site. The dataset link can be seen from the following link vw.csv
The variables in the House Sales in King County, USA dataset are as follows:
- model : is a list of models that exist in Volkswagen cars.
- year : is a list of the year the car model was released.
- Price : lists the price of the car (in euros).
- transmission : is a list of transmissions on the car.
- mileage : is a list of mileage that can be traveled.
- fuelType : lists the type of fuel used.
- tax: is a list of taxes
- mpg: is a list of fuel efficiency.
- engineSize: is a list of engine capacities.
The data preparation used by me is:
- Data selection: selecting data whether the data is empty or not, if there is empty data then I will delete it.
- Dividing data into training and test data: to divide data for training and test.
- Handling Outliers = handling samples whose values are very far away.
- Using OneHotEncoder = encoding the model, transmission, and fueltype features.
- Dimensionality Reduction with PCA = reduces the number of features while maintaining the information in the data.
- Standardization = Helps make data features into a form that is easier for algorithms to process.
The modeling process I did on this data was to combine three machine learning algorithms and then find the best performance of the three machine learning algorithms.
This is the result of the best model from the three algorithms that I used
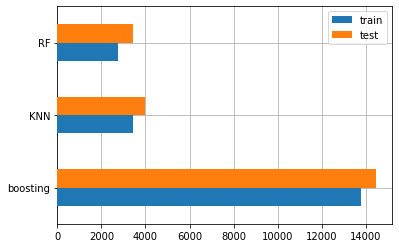
It can be seen from the bar chart above from the three algorithm models that I used, that Random Forest has the smallest error value.
This is the result of the model I used
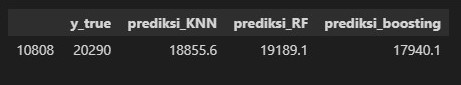
From the table above, it can be seen that prediction using Random Forest gives the closest results compared to the other two models.
The evaluation metric used to measure the performance of the model is the mse (Mean Squared Error) metric, as my chosen case is a regression case.
MSE basically measures the mean squared error of our predictions. For each point, it calculates the squared difference between the prediction and the target and then averages those values.
The higher this value, the worse the model. The MSE value is never negative, as we square the individual prediction errors before summing them, but would be zero for a perfect model.
Benefit: Useful if we have unexpected values that we have to care about. A very high or low value that we have to pay attention to.
Weaknesses: If we make one very bad prediction, squaring will make the error worse and that might make the metric tend to overestimate the badness of the model. That is a very problematic behavior if we have noisy data (i.e., data that for whatever reason is not completely reliable) even a "perfect" model may have a high MSE in that situation, so it becomes difficult to judge how well the model is performing. On the other hand, if all errors are small, or more precisely, smaller than 1, than the opposite effect is felt: we can underestimate the badness of the model.
The formula of MSE metric is as follows
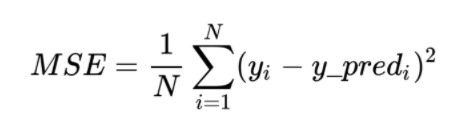
Description:
N : Number of datasets.
yi = actual value.
y_pred = predicted value.