COVID-2019 Data Exploration
Simulation of corona virus spread dynamics using Mathematica capabilities.
Data retrieval call in Mathematica
ResourceData[
  "Epidemic Data for Novel Coronavirus 2019-nCoV from Wuhan, China"];
Main plots
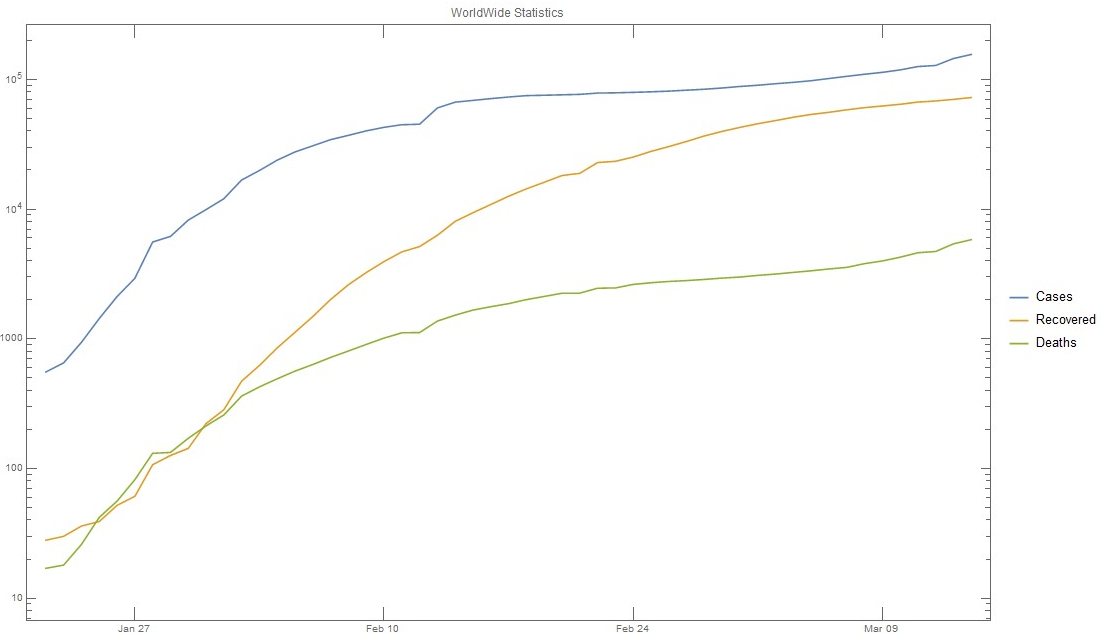
Corona virus spread is characterized by three values:
- Total confirmed cases.
- Recovered people.
- Deaths.
| Worldwide plots | Europe plots |
|---|---|
 |
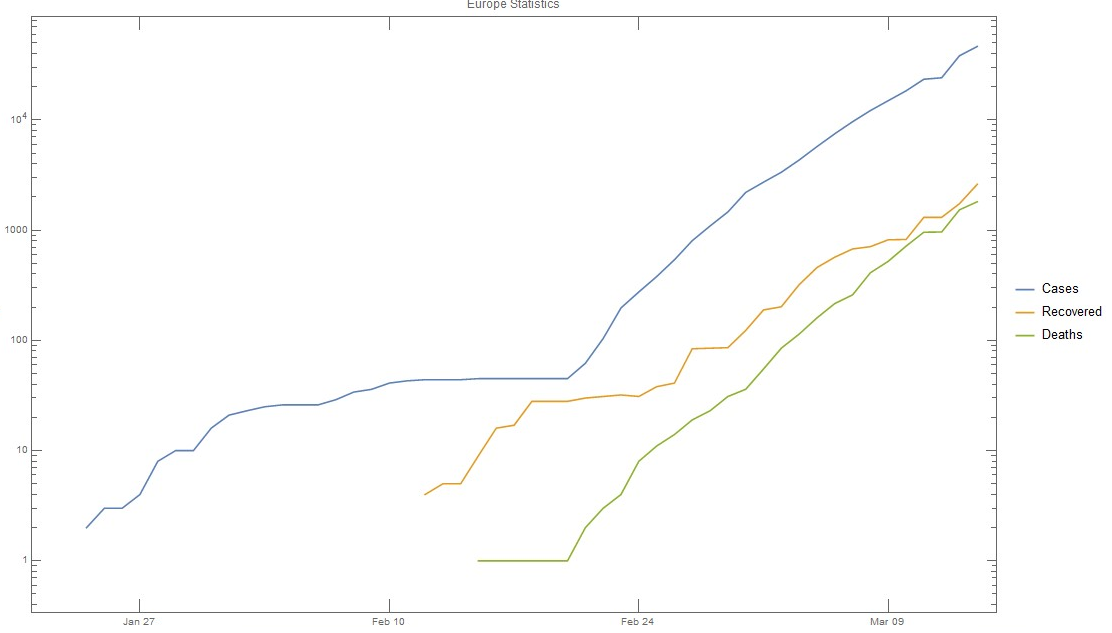 |
Plots are in log scale, starting from 1 February to 15 March 2020.
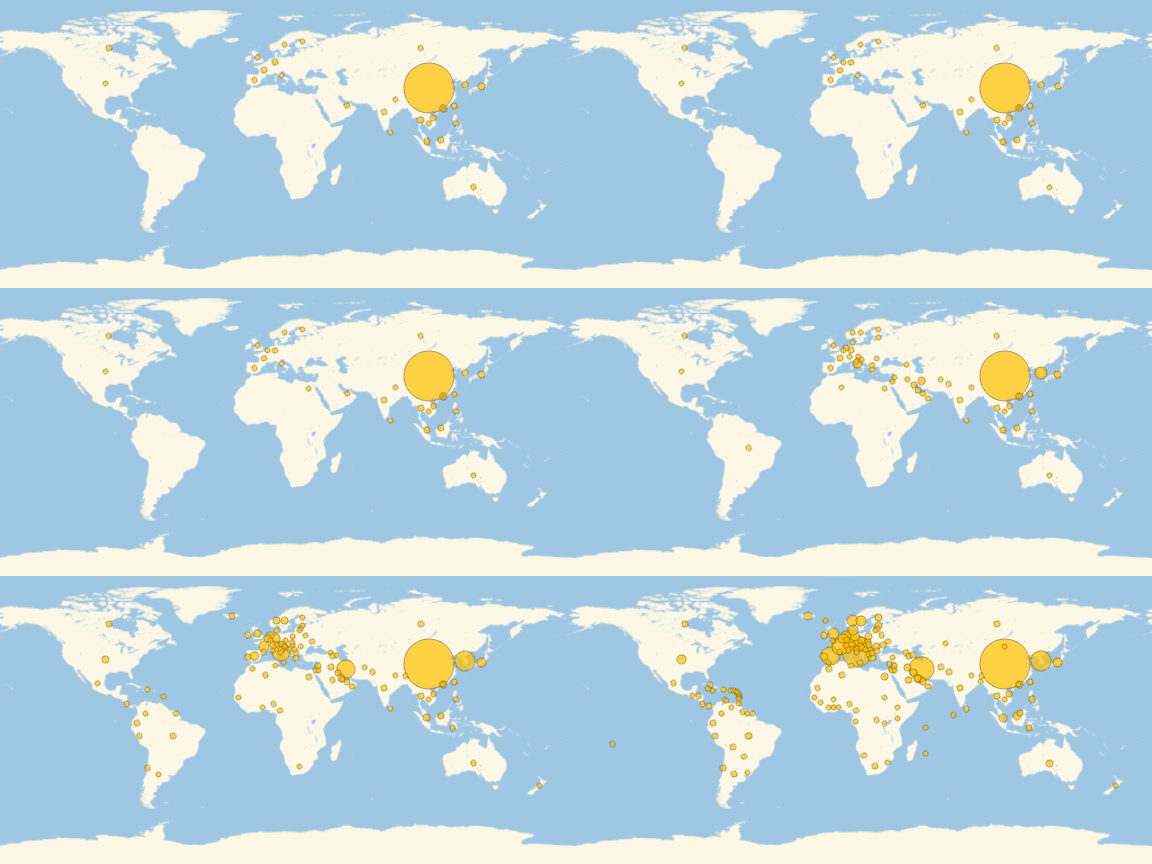
Animation to better understand geography paths of virus:
| Worldwide | Europe |
|---|---|
 |
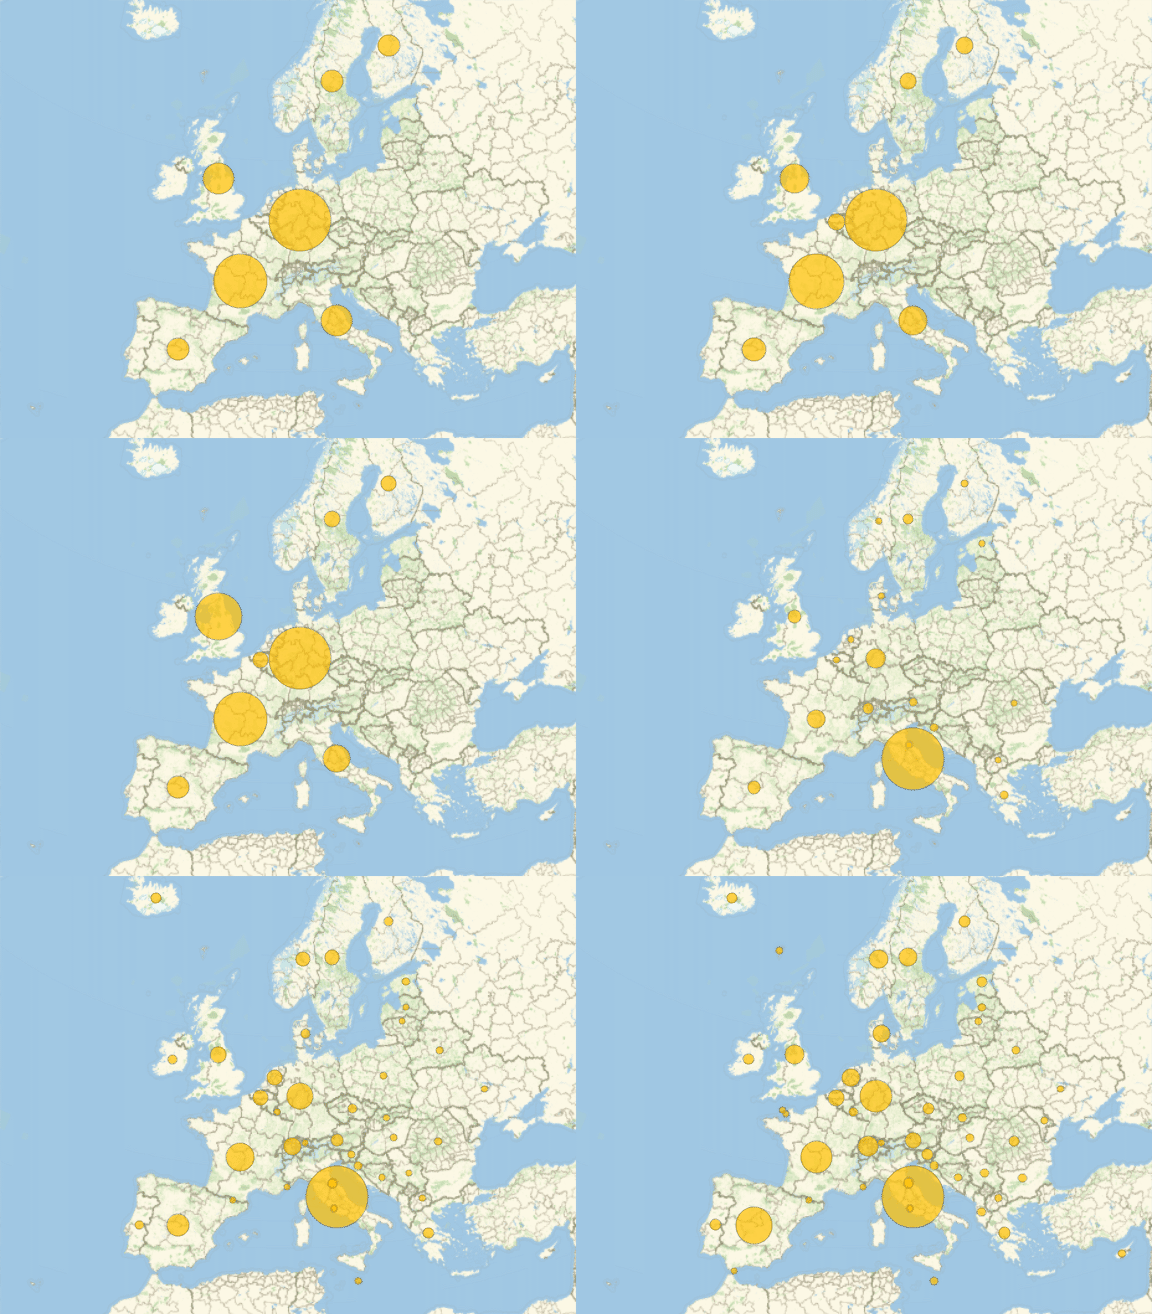 |
ps: absolute scale of bubble is changing with time only relative sizes makes sense.
Derivatives
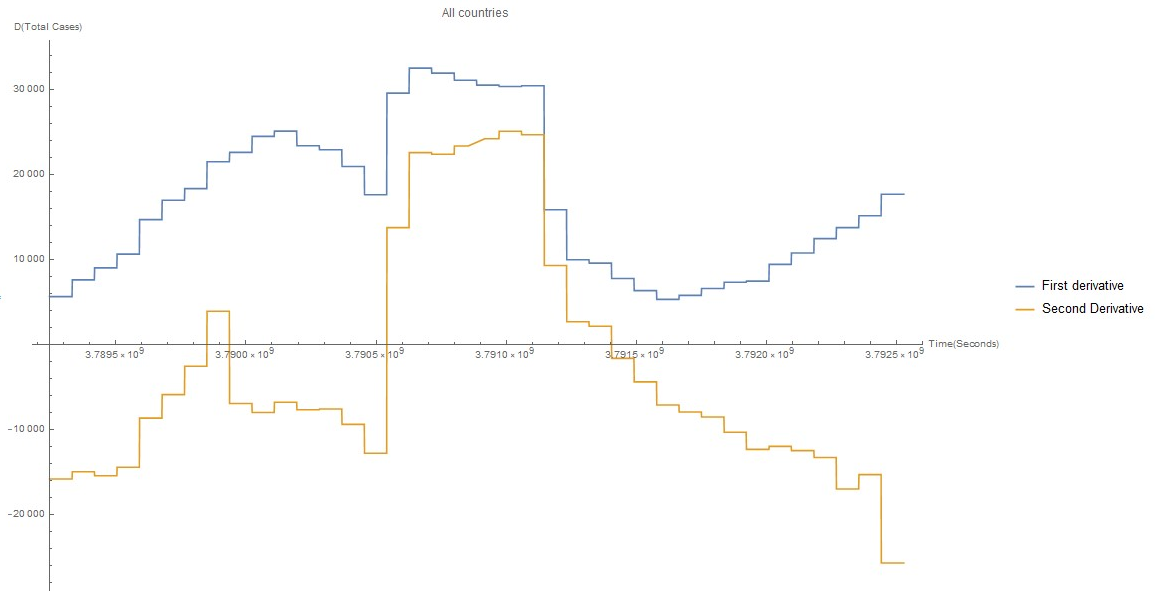
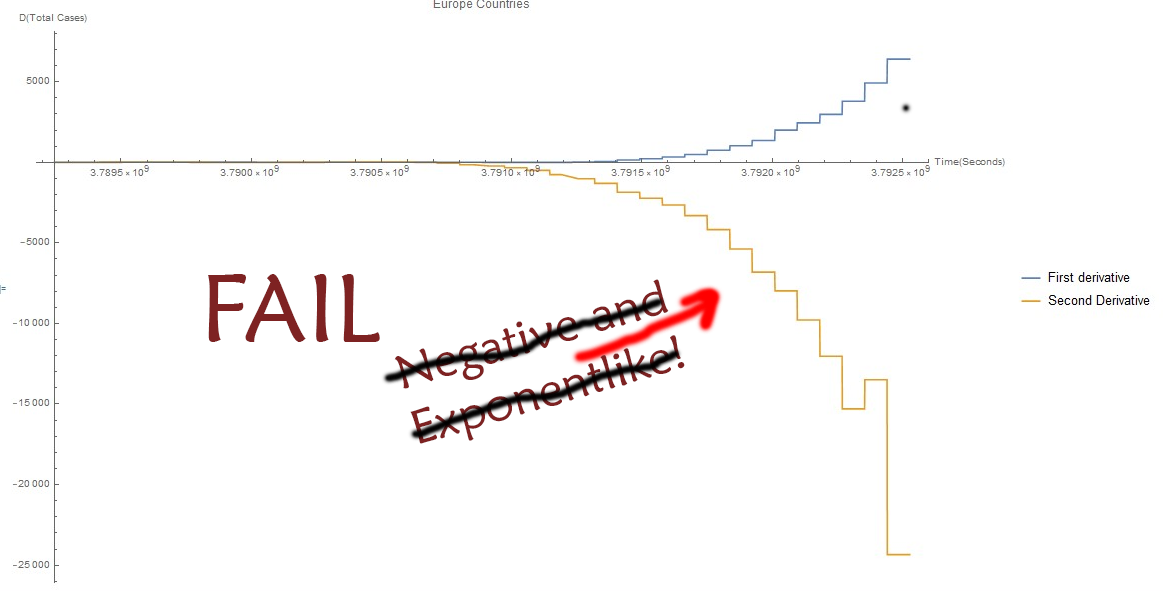
To understand better dynamics of these curves let simply evaluate derivatives. First - which intuitivelly can be understood as speed, and second - as acceleration:
 |
 |
When I first evaluate these plots I was amazed!
Second derivatives are negative it means that speed is slowing down, and if You take a look on Europe plot - it is sloving down exponentially like! So spreading overally in Europe is starting to slowing down.
And now we can extrapolate Confirmed Cases curve using logistic function.
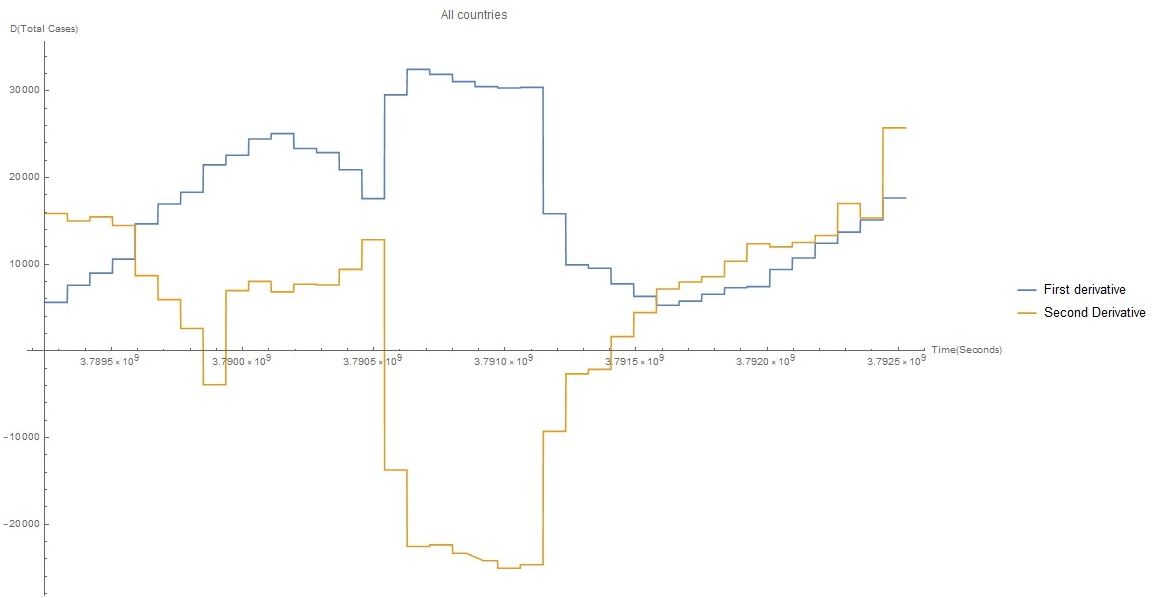
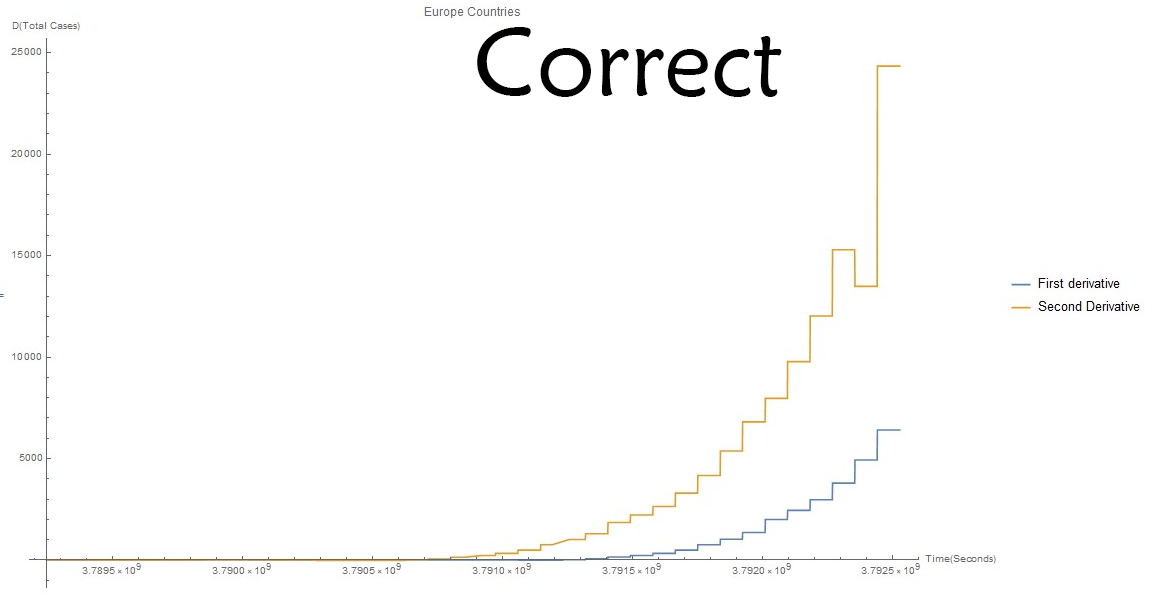
UPD: Forgot "-" minus sign at evaluation of second derivative... It is exponential like and positive. Situation is still serious.
Correct derivative plots:
| Worldwide | Europe |
|---|---|
 |
 |
Logistic Curve Approximation using second derivative
To be Continued...
16 March 2020.