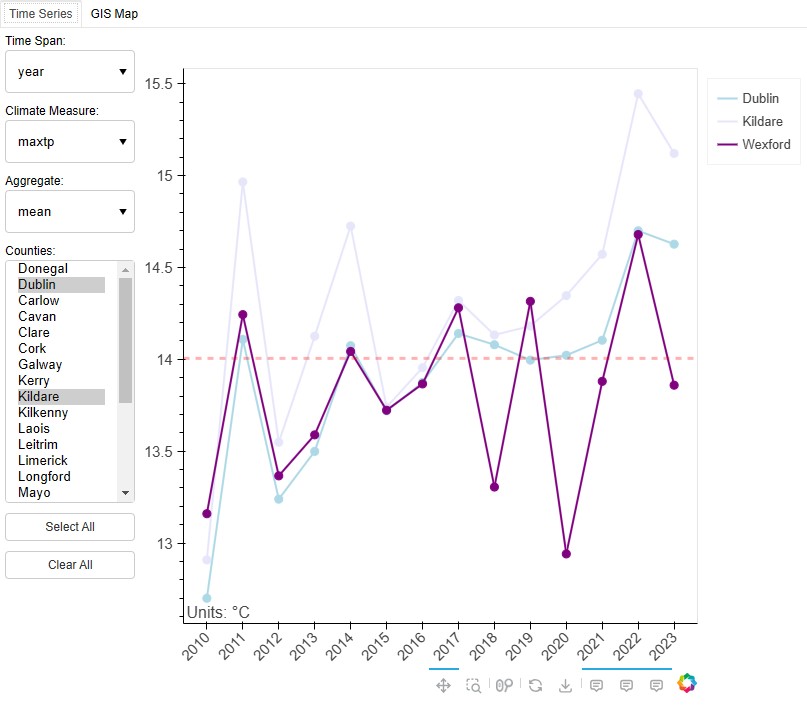
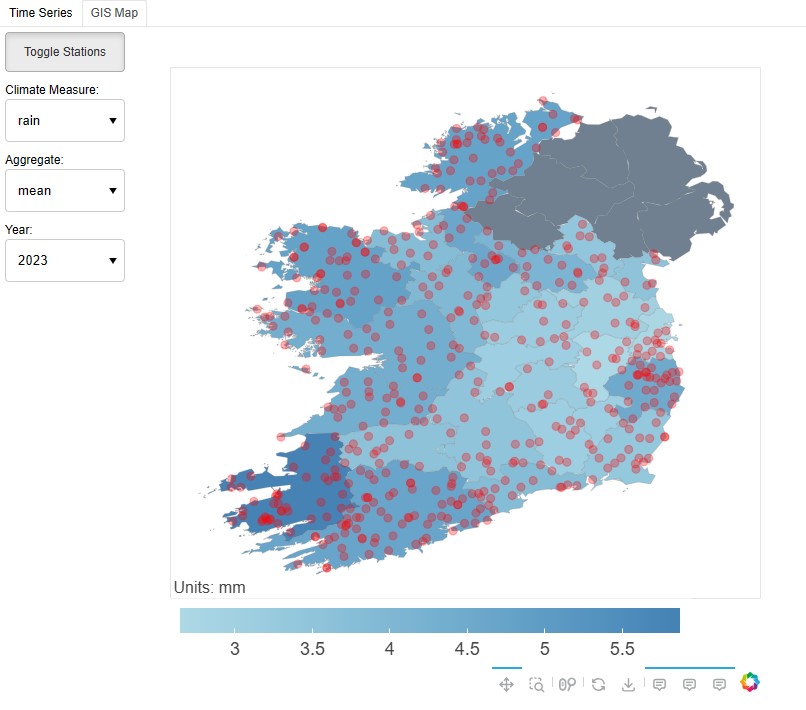
Dashboard applications are particularly useful for visualising multiple patterns within a dataset in a concise and user friendly way. This repository contains the code and data for running a climate dashboard which visualises meteorological data across Ireland.
The dashboard application includes two separate interactive Bokeh plots:
- A time series plot of different aggregated climate measures over time by county
- A gis map of different aggregated climate measures by county
The underlying meteorological data is sourced from Met Éireann's public historical data portal:
The different climate measures include:
maxtp:  -  Maximum Air Temperature (C)	  "
mintp:  -  Minimum  Air Temperature (C)
gmin:   -  09utc Grass Minimum Temperature (C)
soil:   -  Mean 10cm Soil Temperature (C)
wdsp:   -  Mean Wind Speed (knot)
sun:    -  Sunshine duration (hours)					"
evap:   -  Evaporation (mm)
rain:   -  Precipitation Amount (mm)
The dashboard application is available as a docker image, and is accessible on dockerhub:
Hosted dashboards are available on :

