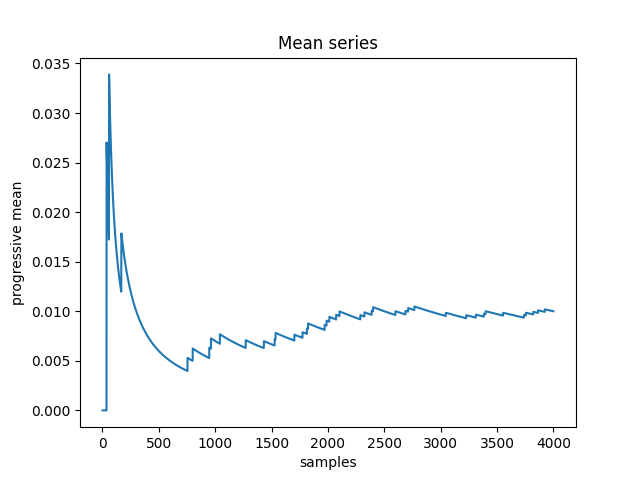
python-plot Visualisation how average calculation behaves when we increase data points Random is used to generate a list of numbers 1-100. Ones are calculated as event is happening simulating 1% drop chance. Then we calculate ever expanding mean and plot it.