Module 10 Challenge

In this Challenge, I’ll assume the role of an advisor in one of the top five financial advisory firms in the world. Competitors are fierce, so you want to propose a novel approach to assembling investment portfolios that are based on cryptocurrencies.
Instead of basing my proposal on only returns and volatility, I'll include other factors that might impact the crypto market—leading to better performance for my portfolio.
The data we're analyzing comes from a jupyter notebook that we've created and imported files to. We'll be using Python to run and read our data.
- [jupyter] - (https://github.com/jupyter/notebook) - Helps us run our code and get the information we need from the data listed in csv files.
In order for us to get the data we need we must import pandas, plots and the csv files we want to observe.
# Import required libraries and dependencies
import pandas as pd
import hvplot.pandas
from path import Path
from sklearn.cluster import KMeans
from sklearn.decomposition import PCA
from sklearn.preprocessing import StandardScalerTo find the information needed we build a jupyter notebook and run various functions to pull the data from csv files.
# Plot a line chart with all the inertia values computed with
# the different values of k to visually identify the optimal value for k.
elbow_plot = df_elbow.hvplot.line(x="k", y="inertia", title="Elbow Curve", xticks=k)
elbow_plot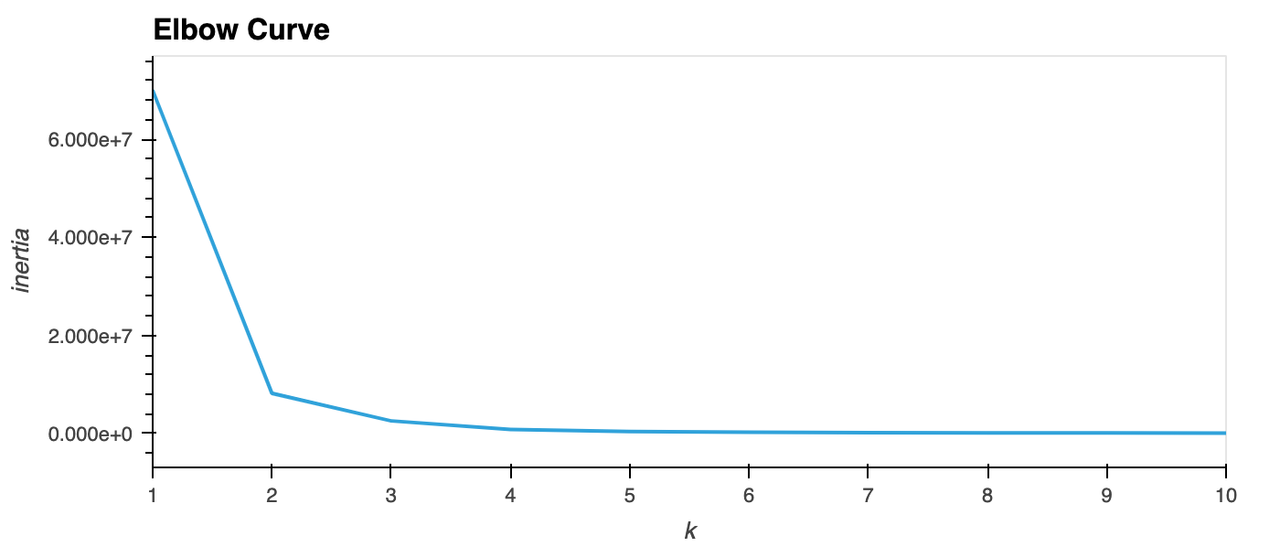
Brought to you by Elgin Braggs Jr.
MIT