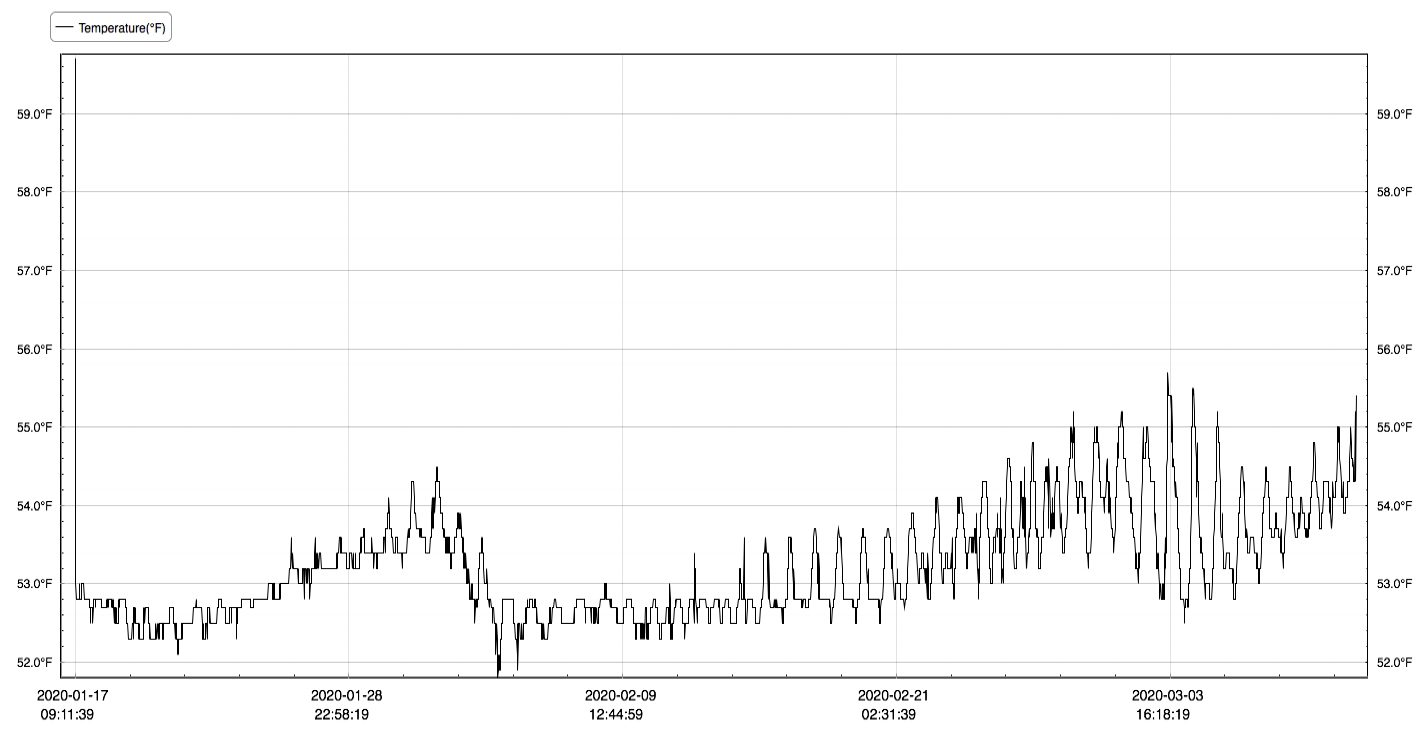
Over the course of 1/17/2020 to 3/11/2020 (54 days) we collected 5205 temperature data points, one every 15 minutes, from a remote logging device ~1 meter below the surface of the bay, near the entrance to aquatic park.
Over this period, the
-
Highest: 59.7
-
Lowest: 51.8
-
Average: 53.2
We used the Temtop Temlog 20 to record the temperatures.
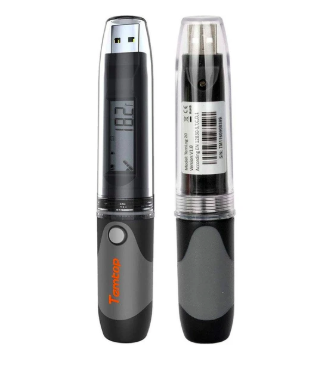
The logger was secured about a meter below the surface, near the entrance of Aquatic Park. It moved up and down with the tides to stay at a constant level below the surface, and was able to move several meters side to side in the ebb and flood.

Here are the results in various formats:
* Device-generated PDF report * Comma Separated Values * Excell formated reported (the CSV plus configuration parameters and summary) * Graph of results
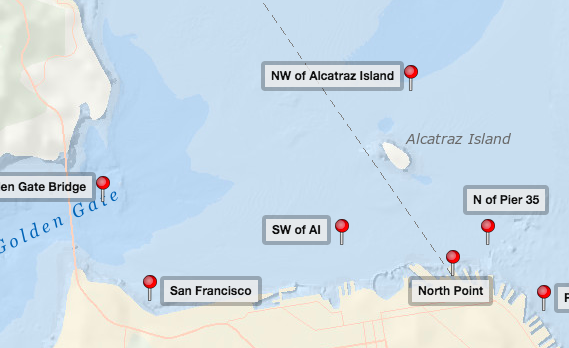
NOAA collects data at a number of different locations around the bay, the closest of which are "SW of AI" (Southwest of Alcatraz Island) and "North Point", which are both about a half mile from the collection location.
The "SW of AI" location water temp graph shows this graph on 3/12/2020:
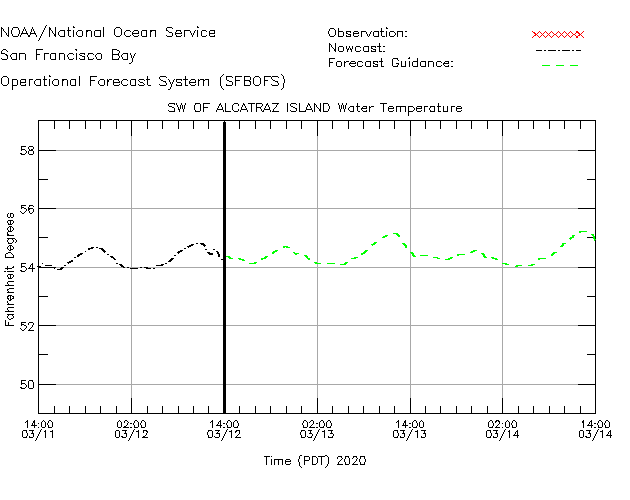
And the "North Point (Pier 41)" location water temp graph shows this graph on 3/12/2020:
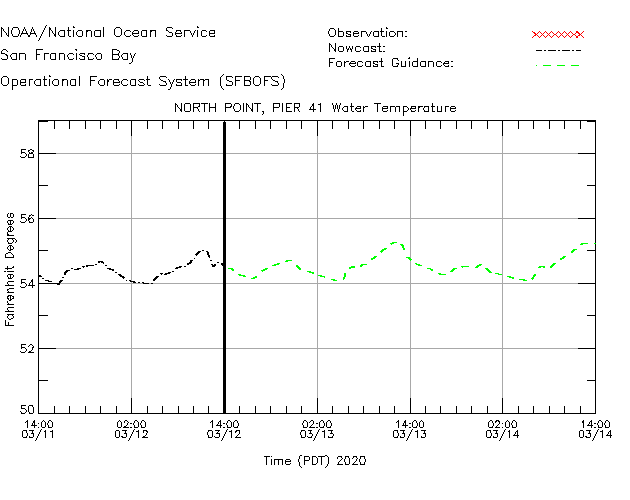
The last data point collected at aquatic park was at 14:11:39 3/11/2020 with a reading of 55.4F. This time is almost exactly on the left-most point of these graphs, which I read as 54.0F and 54.2F respectively. This shows an ~1.3 degree diffence.
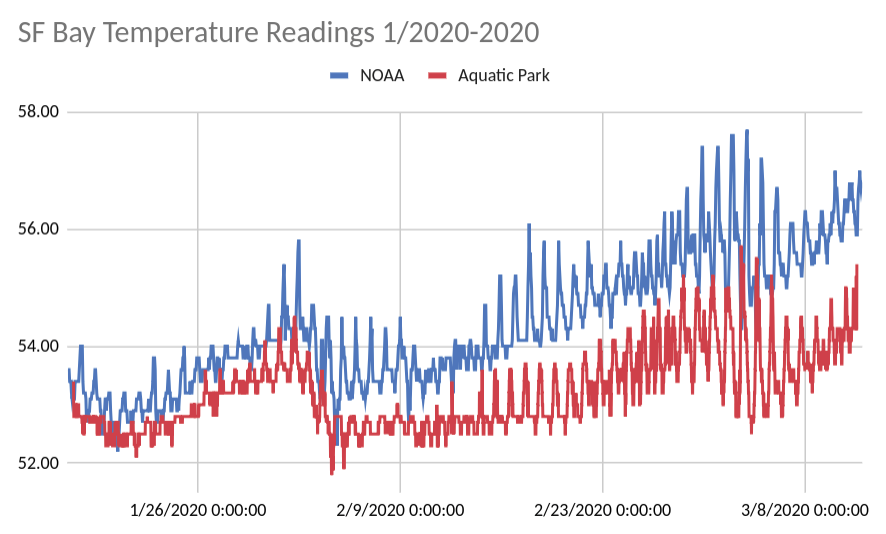
Using the NOAA "Tides and Currents" data from the San Fancisco station, We are able to look at historical data from NOAA:
The ~1.3F degree difference may be explained by:
-
The collector sensor being calibrated differently
-
The collector being placed at a different location relative to the surface
-
The collector being in a place that is genuinely warmer
Given that the two NOAA readings are quite similar, it makes sense that they are calibrated similarly. I also imagine that their sensors are more expensive (e.g. more than $20) and accurate. As they span either side of our collection point, it is unlikely that the water is overall warmer near Aquatic Park.
I would expect a reading at the surface to be warmer than a subsurface reading, and could imagine a difference on the order of a degree. If the NOAA sensor are deeper than a meter, this could account for the difference.
So overall, it seems as though our sensor is reading may be ~1 degree higher than NOAA’s readings.
I’d like to
-
Collect more data, and analyze the day-to-day variance across the year
-
Better understand NOAA’s collectors, to see if I can account for the 1 degree difference
-
Perhaps run two loggers side by side to control for calibration
-
Get NOAA raw data to further compare
Contact me at nick.stielau@gmail.com