Introduction • Get Started • Docs • Build • Contribute • Contact Us
What is pktvisor?
pktvisor (pronounced "packet visor") is an observability agent for summarizing high volume, information dense data streams down to lightweight, immediately actionable observability data directly at the edge. Its goal is to extract the signal from the noise; to separate the needles from the haystacks as close to the source as possible.
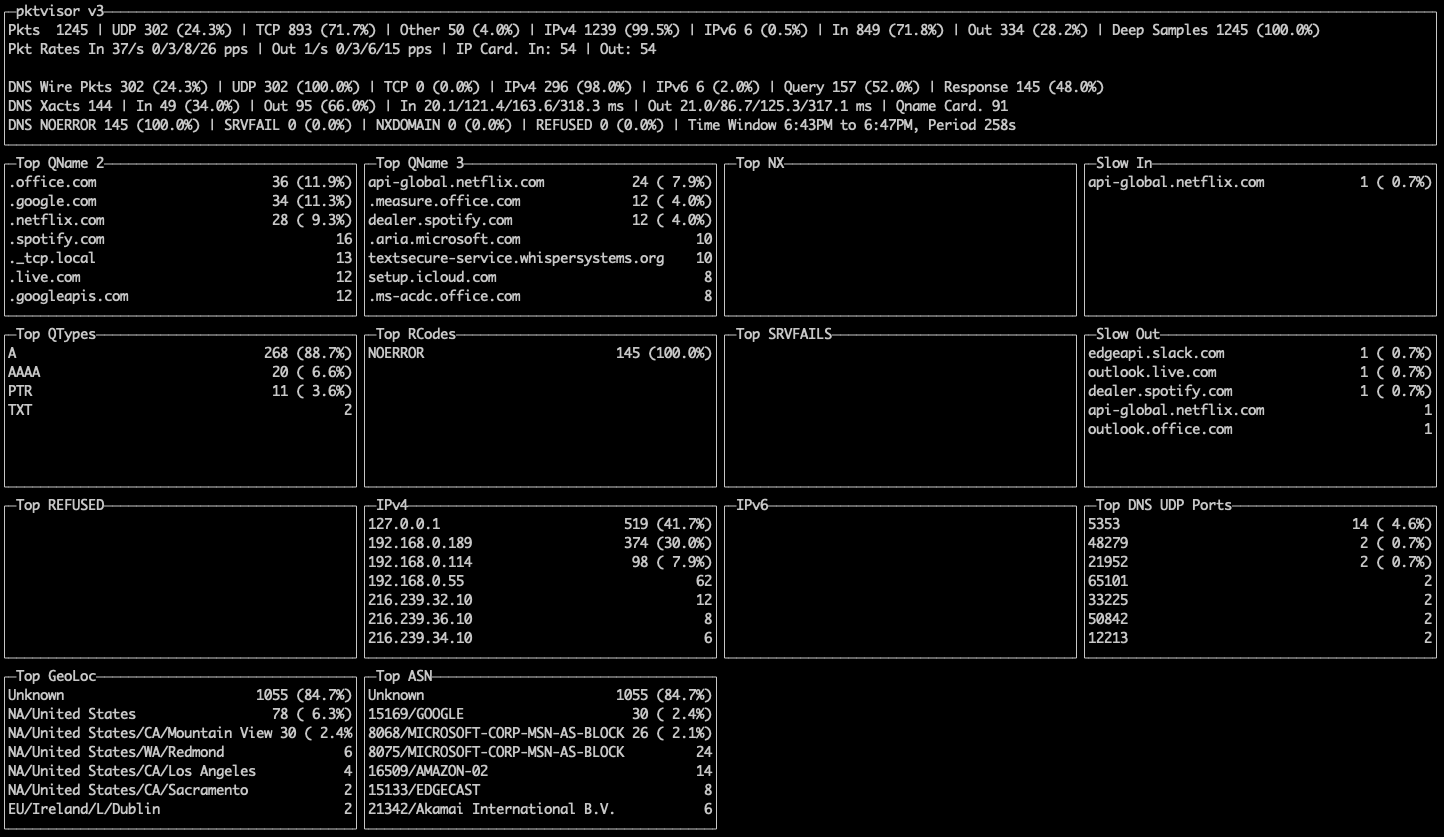
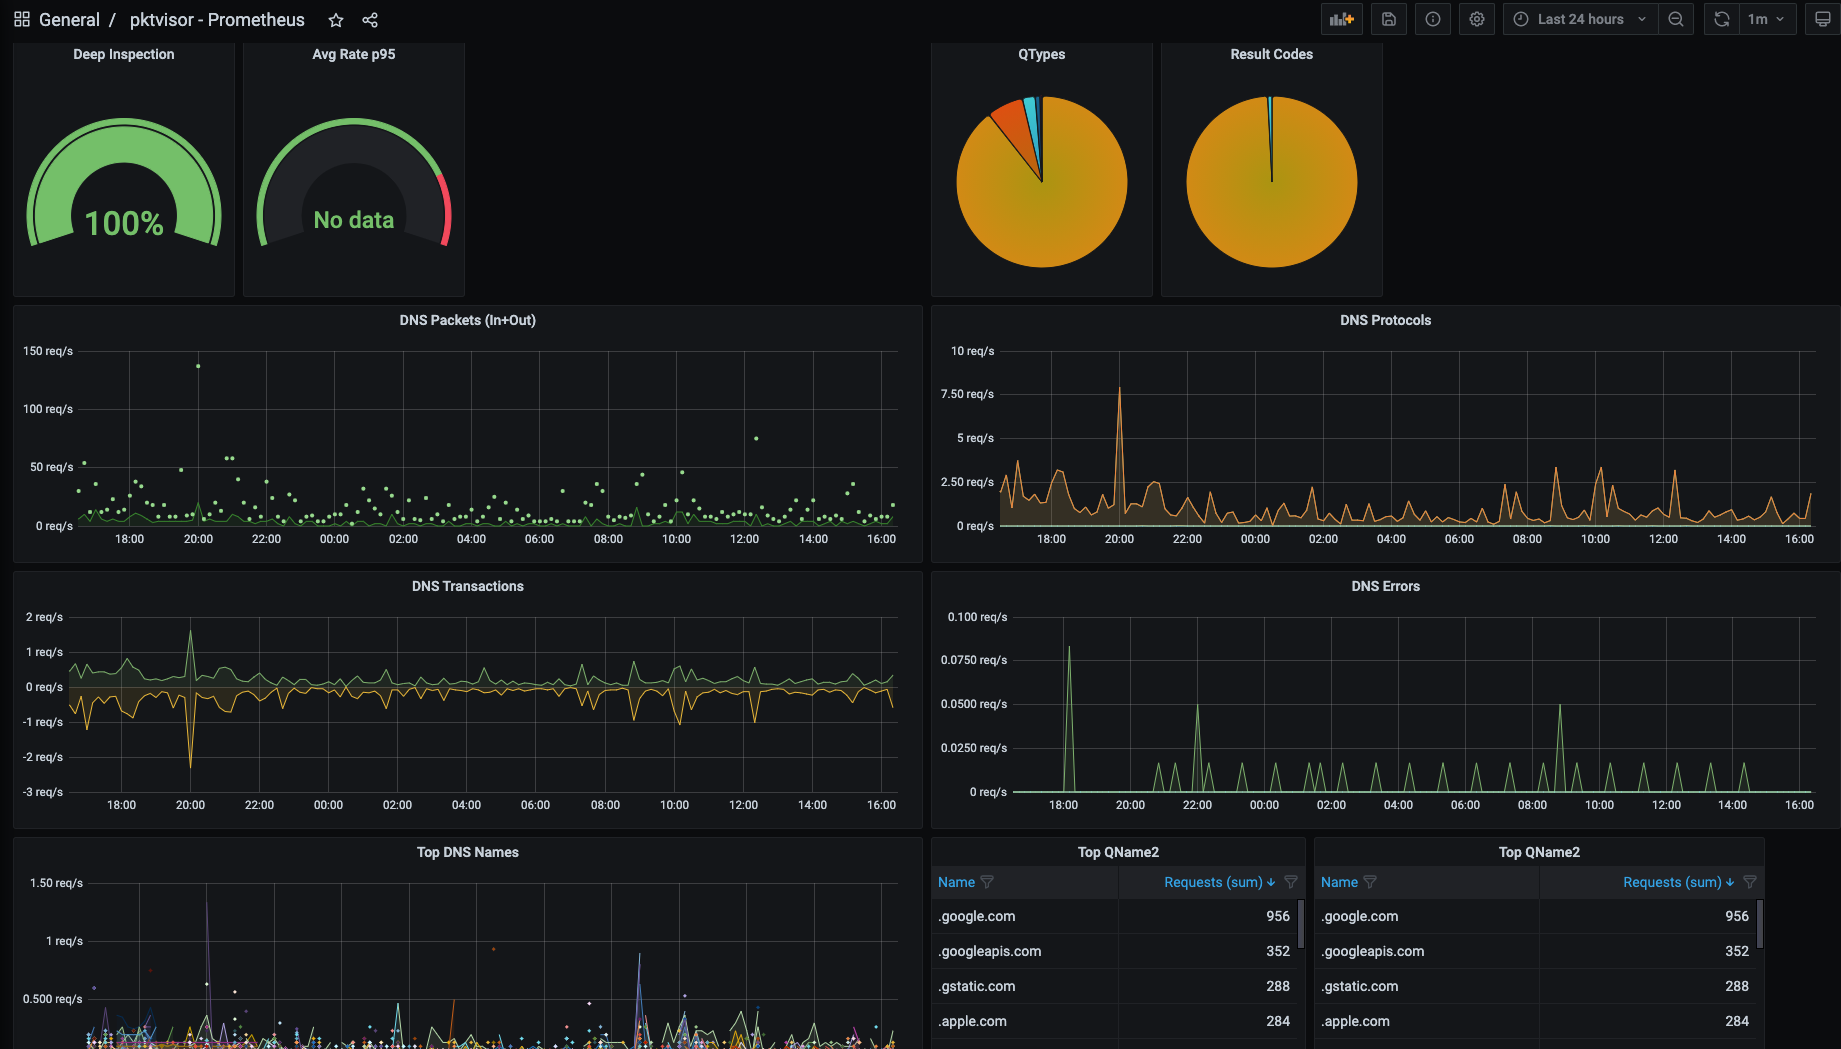
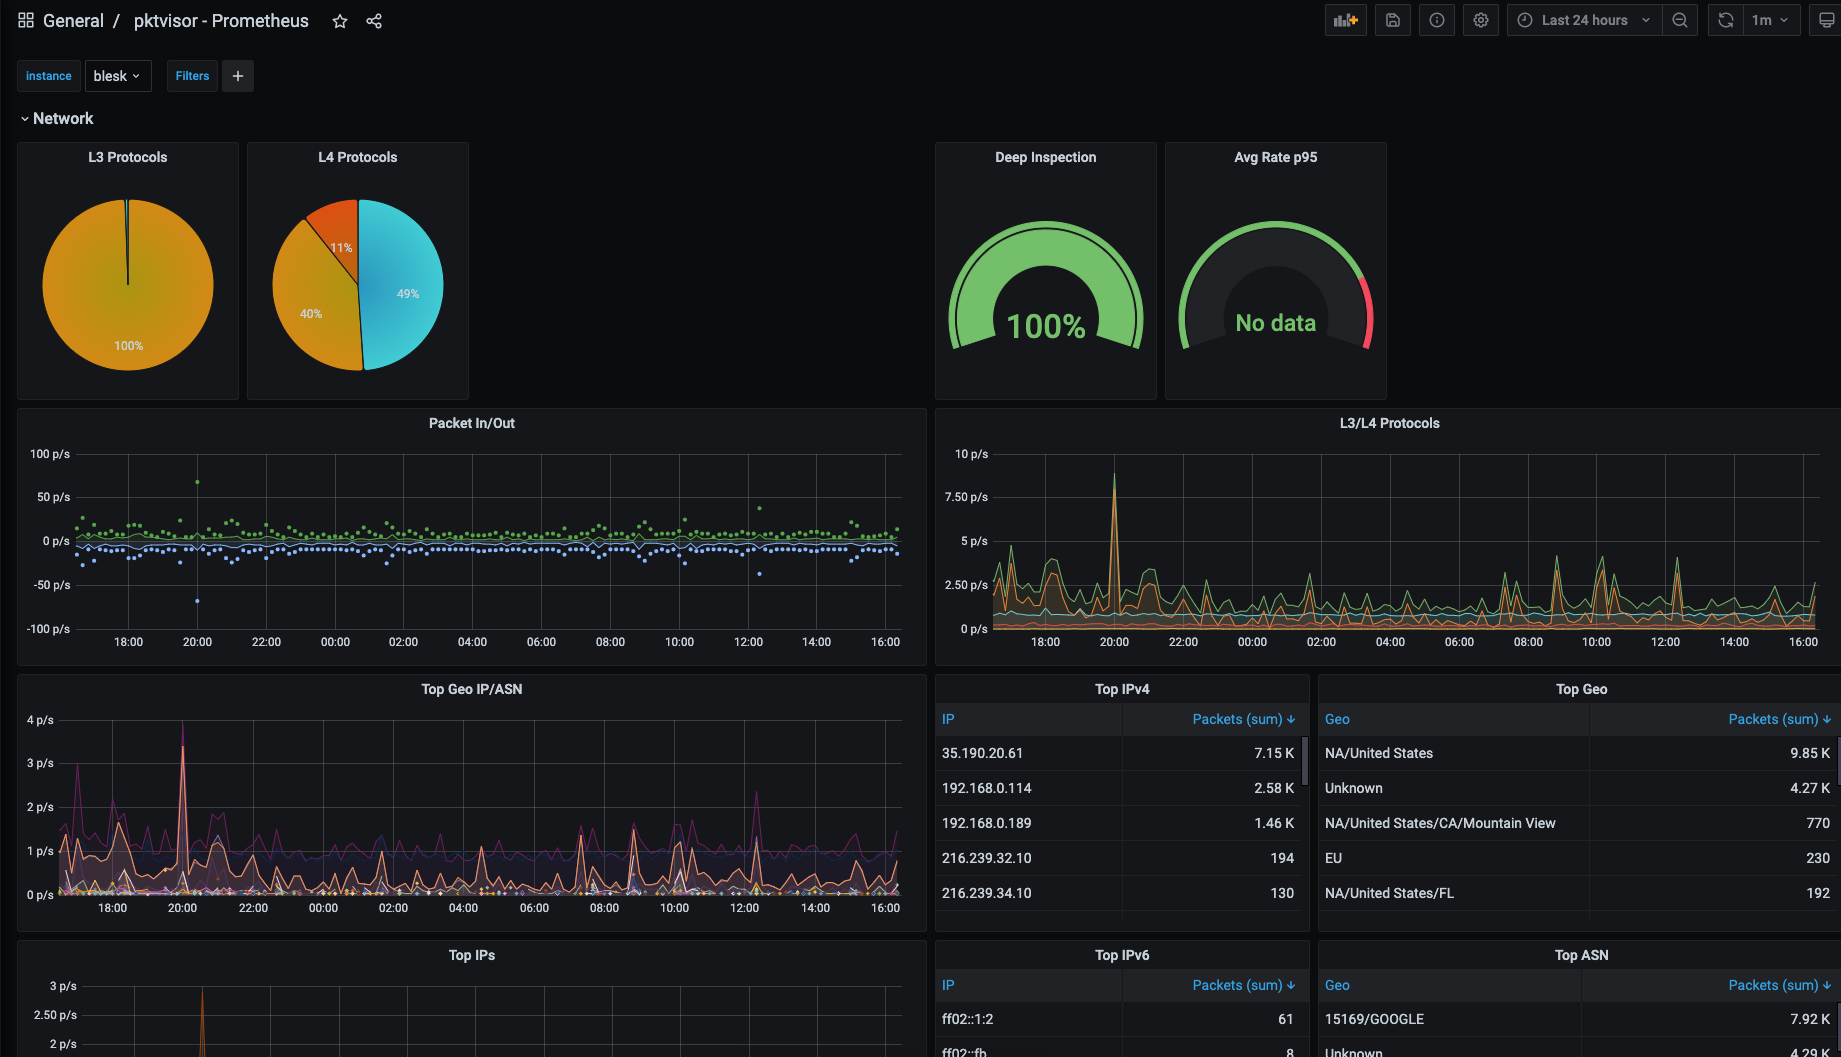
It is a resource efficient, side-car style agent built from the ground up to be modular and dynamically controlled in real time via API. Input and processor modules may be dynamically loaded at runtime. Metric output can be visualized both on-node via command line UI (for a localized, hyper real-time view) as well as centrally collected into industry standard observability stacks like Prometheus and Grafana.
The input stream system is designed to tap into data streams, and currently focuses on packet capture but will soon support additional taps such as sFlow / Netflow , dnstap, envoy taps, and eBPF.
The stream processor system includes full application level analysis, and efficiently summarizes to one minute buckets of:
- Counters
- Histograms and Quantiles
- Timers and Rates
- Heavy Hitters/Frequent Items/Top N
- Set Cardinality
- GeoIP
pktvisor has its origins in observability of critical internet infrastructure in support of DDoS protection, traffic engineering, and ongoing operations.
These screenshots display both the command line and centralized views of the Network and DNS stream processors, and the types of summary information provided:
Get Started
Docker
One of the easiest ways to get started with pktvisor is to use
the public docker image. The image contains the collector
agent (pktvisord), the command line UI (pktvisor-cli), and the pcap file analyzer (pktvisor-pcap). When running
the container, you specify which tool to run.
- Pull the container
docker pull ns1labs/pktvisor
- Start the collector agent
This will start in the background and stay running. Note that the final two arguments select pktvisord agent and
the eth0 ethernet interface for packet capture. You may substitute eth0 for any known interface on your device.
Note that this step requires docker host networking to observe traffic outside the container, and
that currently only Linux supports host networking:
docker run --net=host -d ns1labs/pktvisor pktvisord eth0
If the container does not stay running, check the docker logs output.
- Run the command line UI
After the agent is running, you can observe results locally with the included command line UI. This command will run the
UI (pktvisor-cli) in the foreground, and exit when Ctrl-C is pressed. It connects to the running agent locally using
the built in REST API.
docker run -it --rm --net=host ns1labs/pktvisor pktvisor-cli
Linux Static Binary (AppImage)
You may also use the Linux static binary, built with AppImage, which is available for download on the Releases page. It is designed to work on all modern Linux distributions and does not require installation or any other dependencies.
curl -L http://pktvisor.com/download -o pktvisor-x86_64.AppImage
chmod +x pktvisor-x86_64.AppImage
./pktvisor-x86_64.AppImage pktvisord -h
For example, to run the agent on ethernet interface eth0:
./pktvisor-x86_64.AppImage pktvisord eth0
The AppImage contains the collector agent (pktvisord), the command line UI (pktvisor-cli), and the pcap file
analyzer (pktvisor-pcap). You can specify which tool to run by passing it as the first argument:
For example, to visualize the running agent started above with the pktvisor command line UI:
./pktvisor-x86_64.AppImage pktvisor-cliNote that when running the AppImage version of the agent, you may want to use the -d argument to daemonize (run in the
background), and either the --log-file or --syslog argument to record logs.
Also see Advanced Agent Example.
Other Platforms
If you are unable to use the Docker container or the Linux binary, then you will have to build your own executable, please see the Build section below.
If you have a preferred installation method that you would like to see support for, please create an issue.
Docs
Agent Usage
A collector agent should be installed on each node to be monitored.
Current command line options are described with:
docker run --rm ns1labs/pktvisor pktvisord --help
or
./pktvisor-x86_64.AppImage pktvisord --help
    Usage:
      pktvisord [options] [IFACE]
      pktvisord (-h | --help)
      pktvisord --version

    pktvisord summarizes data streams and exposes a REST API control plane for configuration and metrics.

    IFACE, if specified, is either a network interface or an IP address (4 or 6). If this is specified,
    a "pcap" input stream will be automatically created, with "net", "dns", and "pcap" handler modules attached.

    Base Options:
      -d                    Daemonize; fork and continue running in the background [default: false]
      -h --help             Show this screen
      -v                    Verbose log output
      --no-track            Don't send lightweight, anonymous usage metrics
      --version             Show version
    Web Server Options:
      -l HOST               Run web server on the given host or IP [default: localhost]
      -p PORT               Run web server on the given port [default: 10853]
      --tls                 Enable TLS on the web server
      --tls-cert FILE       Use given TLS cert. Required if --tls is enabled.
      --tls-key FILE        Use given TLS private key. Required if --tls is enabled.
      --admin-api           Enable admin REST API giving complete control plane functionality [default: false]
                            When not specified, the exposed API is read-only access to summarized metrics.
                            When specified, write access is enabled for all modules.
    Geo Options:
      --geo-city FILE       GeoLite2 City database to use for IP to Geo mapping
      --geo-asn FILE        GeoLite2 ASN database to use for IP to ASN mapping
    Configuration:
      --config FILE         Use specified YAML configuration to configure options, Taps, and Collection Policies
    Logging Options:
      --log-file FILE       Log to the given output file name
      --syslog              Log to syslog
    Prometheus Options:
      --prometheus          Enable native Prometheus metrics at path /metrics
      --prom-instance ID    Optionally set the 'instance' label to given ID
    Handler Module Defaults:
      --max-deep-sample N   Never deep sample more than N% of streams (an int between 0 and 100) [default: 100]
      --periods P           Hold this many 60 second time periods of history in memory [default: 5]
    pcap Input Module Options:
      -b BPF                Filter packets using the given tcpdump compatible filter expression. Example: "port 53"
      -H HOSTSPEC           Specify subnets (comma separated) to consider HOST, in CIDR form. In live capture this /may/ be detected automatically
                            from capture device but /must/ be specified for pcaps. Example: "10.0.1.0/24,10.0.2.1/32,2001:db8::/64"
                            Specifying this for live capture will append to any automatic detection.
Command Line UI Usage
The command line UI (pktvisor-cli) connects directly to a pktvisord agent to visualize the real time stream
summarization, which is by default a sliding 5 minute time window. It can also connect to an agent running on a remote
host.
docker run --rm ns1labs/pktvisor pktvisor-cli -h
./pktvisor-x86_64.AppImage pktvisor-cli -h
Usage:
  pktvisor-cli [-p PORT] [-H HOST]
  pktvisor-cli -h
  pktvisor-cli --version

  -H string
    	Query pktvisord metrics webserver on the given host (default "localhost")
  -h	Show help
  -p int
    	Query pktvisord metrics webserver on the given port (default 10853)
  -version
    	Show client version
pcap File Analysis
pktvisor-pcap is a tool that can statically analyze prerecorded packet capture files. It takes many of the same
options, and does all of the same analysis, as the live agent version.
docker run --rm ns1labs/pktvisor pktvisor-pcap --help
./pktvisor-x86_64.AppImage pktvisor-pcap --help
    Usage:
      pktvisor-pcap [options] PCAP
      pktvisor-pcap (-h | --help)
      pktvisor-pcap --version

    Summarize a pcap file. The result will be written to stdout in JSON format, while console logs will be printed
    to stderr.

    Options:
      --max-deep-sample N   Never deep sample more than N% of streams (an int between 0 and 100) [default: 100]
      --periods P           Hold this many 60 second time periods of history in memory. Use 1 to summarize all data. [default: 5]
      -h --help             Show this screen
      --version             Show version
      -v                    Verbose log output
      -b BPF                Filter packets using the given BPF string
      --geo-city FILE       GeoLite2 City database to use for IP to Geo mapping (if enabled)
      --geo-asn FILE        GeoLite2 ASN database to use for IP to ASN mapping (if enabled)
      -H HOSTSPEC           Specify subnets (comma separated) to consider HOST, in CIDR form. In live capture this /may/ be detected automatically
                            from capture device but /must/ be specified for pcaps. Example: "10.0.1.0/24,10.0.2.1/32,2001:db8::/64"
                            Specifying this for live capture will append to any automatic detection.
You can use the docker container by passing in a volume referencing the directory containing the pcap file. The standard output will contain the JSON summarization output, which you can capture or pipe into other tools, for example:
$ docker run --rm -v /pktvisor/src/tests/fixtures:/pcaps ns1labs/pktvisor pktvisor-pcap /pcaps/dns_ipv4_udp.pcap | jq .

[2021-03-11 18:45:04.572] [pktvisor] [info] Load input plugin: PcapInputModulePlugin dev.visor.module.input/1.0
[2021-03-11 18:45:04.573] [pktvisor] [info] Load handler plugin: DnsHandler dev.visor.module.handler/1.0
[2021-03-11 18:45:04.573] [pktvisor] [info] Load handler plugin: NetHandler dev.visor.module.handler/1.0
...
processed 140 packets
{
  "5m": {
    "dns": {
      "cardinality": {
        "qname": 70
      },
      "period": {
        "length": 6,
        "start_ts": 1567706414
      },
      "top_nxdomain": [],
      "top_qname2": [
        {
          "estimate": 140,
          "name": ".test.com"
        }
      ],
...
The AppImage can access local files as any normal binary:
$ ./pktvisor-x86_64.AppImage pktvisor-pcap /pcaps/dns_ipv4_udp.pcap | jq .

[2021-03-11 18:45:04.572] [pktvisor] [info] Load input plugin: PcapInputModulePlugin dev.visor.module.input/1.0
[2021-03-11 18:45:04.573] [pktvisor] [info] Load handler plugin: DnsHandler dev.visor.module.handler/1.0
[2021-03-11 18:45:04.573] [pktvisor] [info] Load handler plugin: NetHandler dev.visor.module.handler/1.0
...
processed 140 packets
{
  "5m": {
    "dns": {
      "cardinality": {
        "qname": 70
      },
      "period": {
        "length": 6,
        "start_ts": 1567706414
      },
      "top_nxdomain": [],
      "top_qname2": [
        {
          "estimate": 140,
          "name": ".test.com"
        }
      ],
...
Metrics Collection
Metrics from the REST API
The metrics are available from the agent in JSON format via the REST API.
For most use cases, you will want to collect the most recent full 1-minute bucket, once per minute:
curl localhost:10853/api/v1/metrics/bucket/1
This can be done with tools like telegraf and the standard HTTP plugin. Example telegraf config snippet:
[inputs]
[[inputs.http]]
urls = [ "http://127.0.0.1:10853/api/v1/metrics/bucket/1",]
interval = "60s"
data_format = "json"
json_query = "1m"
json_time_key = "period_start_ts"
json_time_format = "unix"
json_string_fields = [
  "dns_*",
  "packets_*",
]

[inputs.http.tags]
t = "pktvisor"
interval = "60"
Prometheus Metrics
pktvisord also has native Prometheus support, which you can enable by passing --prometheus. The metrics are
available for collection at the standard /metrics endpoint.
$ ./pktvisor-x86_64.AppImage pktvisord -d --prometheus eth0
$ curl localhost:10853/metrics
# HELP dns_wire_packets_udp Total DNS wire packets received over UDP (ingress and egress)
# TYPE dns_wire_packets_udp gauge
dns_wire_packets_udp{instance="node"} 28
# HELP dns_rates_total Rate of all DNS wire packets (combined ingress and egress) per second
# TYPE dns_rates_total summary
dns_rates_total{instance="node",quantile="0.5"} 0
dns_rates_total{instance="node",quantile="0.9"} 4
dns_rates_total{instance="node",quantile="0.95"} 4
...
You can set the instance label by passing --prom-instance ID
If you are interested in centralized collection using remote write, including to cloud providers, there is a docker image available to make this easy. See centralized_collection/prometheus for more.
REST API
REST API documentation is available in OpenAPI Format
Please note that the administration control plane API (--admin-api) is currently undergoing heavy iteration and so is
not yet documented. If you have a use case that requires the administration API, please contact us to
discuss.
Advanced Agent Example
Starting the collector agent from Docker with MaxmindDB GeoIP/GeoASN support and using the Host option to identify ingress and egress traffic:
docker run --rm --net=host -d \
    --mount type=bind,source=/opt/geo,target=/geo \
    ns1labs/pktvisor pktvisord \
    --geo-city /geo/GeoIP2-City.mmdb \
    --geo-asn /geo/GeoIP2-ISP.mmdb \
    -H 192.168.0.54/32,127.0.0.1/32 \
    eth0
The same command with AppImage and logging to syslog:
./pktvisor-x86_64.AppImage pktvisord -d --syslog \
    --geo-city /geo/GeoIP2-City.mmdb \
    --geo-asn /geo/GeoIP2-ISP.mmdb \
    -H 192.168.0.54/32,127.0.0.1/32 \
    eth0
Further Documentation
We recognize the value of first class documentation, and we are working on further documentation including expanded and updated REST API documentation, internal documentation for developers of input and handler modules (and those who want to contribute to pktvisor), and a user manual.
Please contact us if you have any questions on installation, use, or development.
Contact Us
We are very interested in hearing about your use cases, feature requests, and other feedback!
- File an issue
- Use our public work board
- Use our public backlog board
- Start a Discussion
- Join us on Slack
- Send mail to info@pktvisor.dev
Build
The main code base is written in clean, modern C++. The pktvisor-cli command line interface is written in Go. The
build system requires CMake and the Conan package manager system.
pktvisor adheres to semantic versioning.
pktvisor is developed and tested on Linux and OSX. Windows is not yet officially supported, though the dependencies and code base do not preclude a Windows build. If you are interested in developing a Windows version, please contact us.
Dependencies
- Conan C++ package manager
- CMake >= 3.13 (
cmake) - C++ compiler supporting C++17
For the list of packages included by conan, see conanfile.txt
In addition, debugging integration tests make use of:
Building
The general build steps are:
# clone the repository
git clone https://github.com/ns1labs/pktvisor.git
cd pktvisor
mkdir build && cd build

# set up conan
conan profile update settings.compiler.libcxx=libstdc++11 default
conan config set general.revisions_enabled=1

# configure and handle dependencies
cmake -DCMAKE_BUILD_TYPE=Release ..

# build and run tests
make all test

# the binaries will be in the build/bin directory
bin/pktvisord --help
As development environments can vary widely, please see the Dockerfile and Continuous Integration build file for reference.
Contribute
Thanks for considering contributing! We will expand this section with more detailed information to guide you through the process.
Please open Pull Requests against the develop branch. If you are considering a larger
contribution, please contact us to discuss your design.
See the NS1 Contribution Guidelines for more information.
License
This code is released under Mozilla Public License 2.0. You can find terms and conditions in the LICENSE file.


