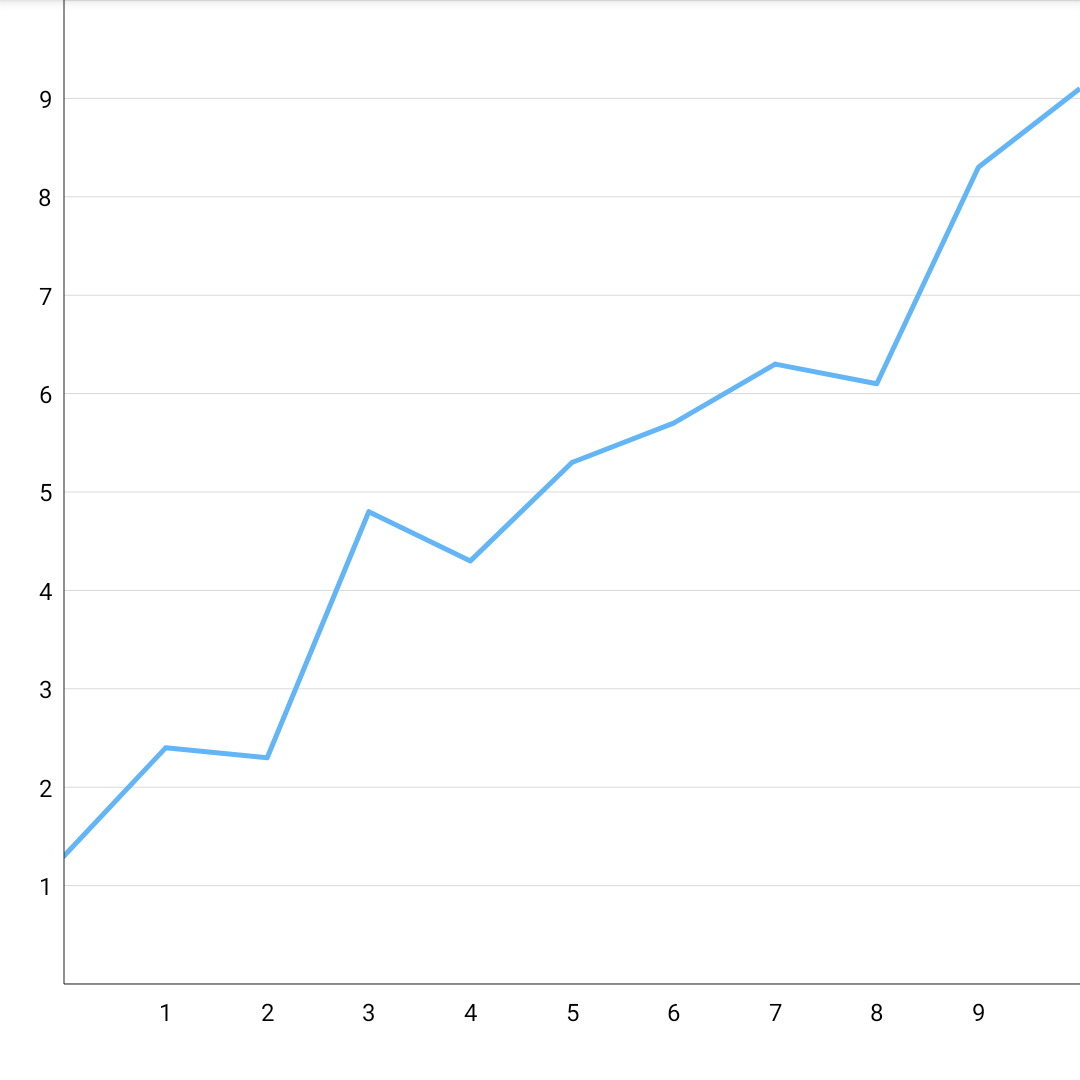
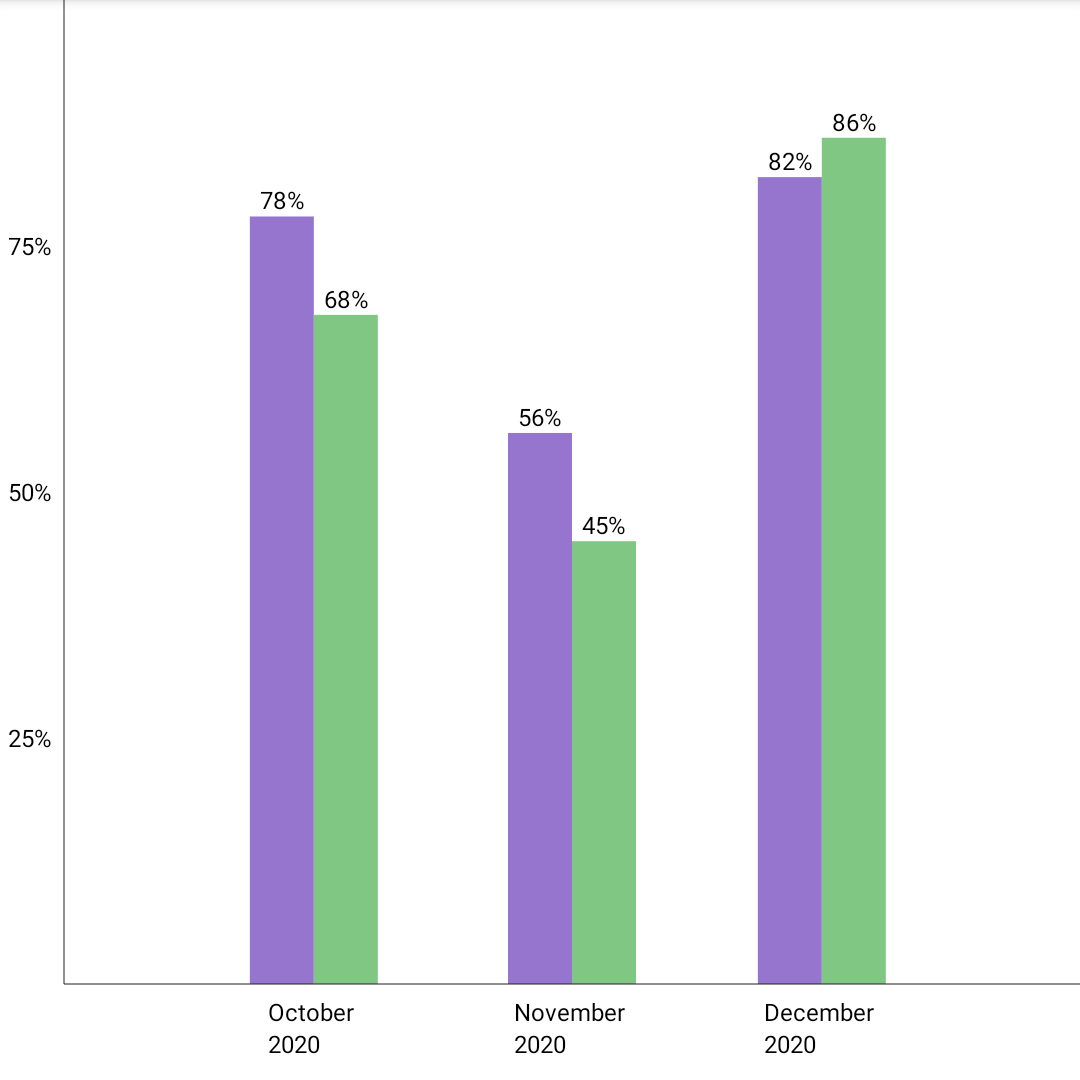
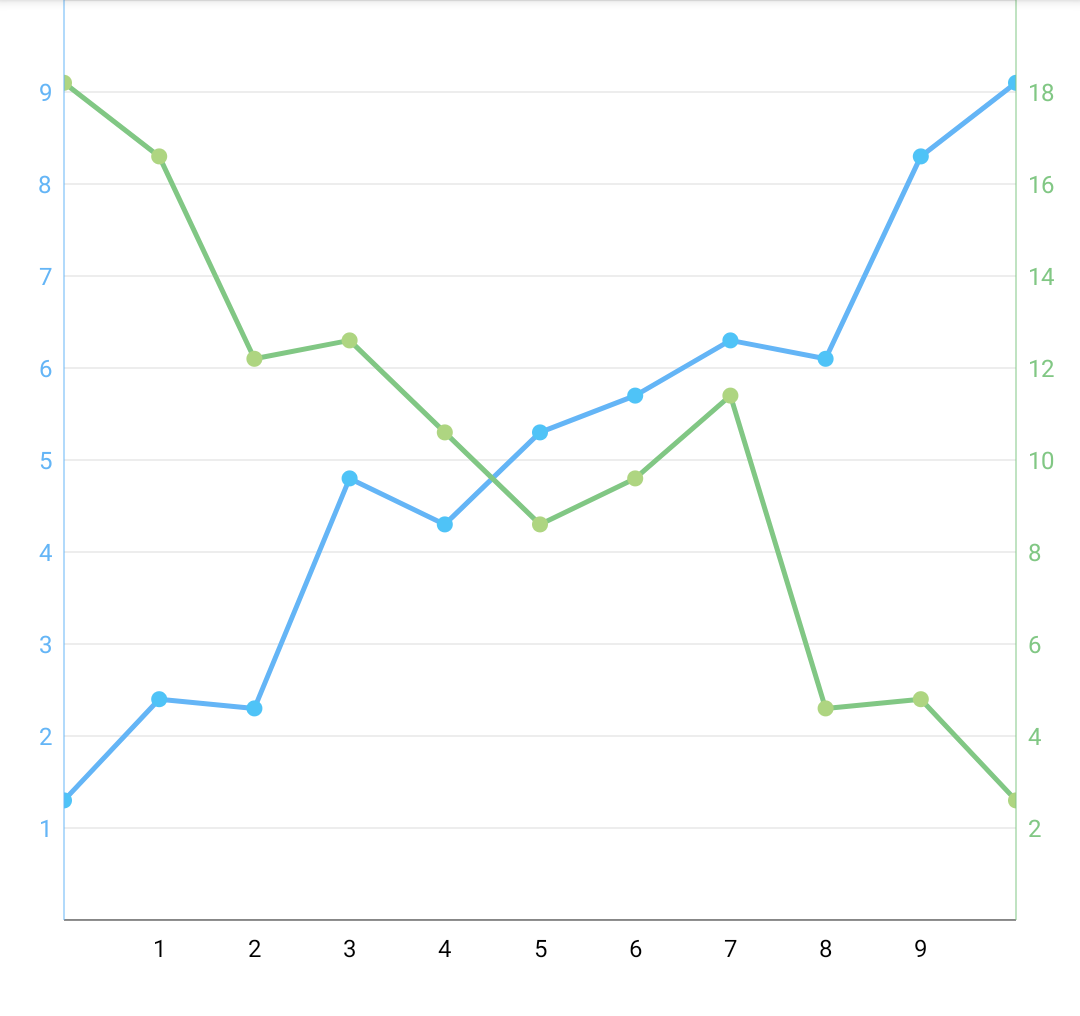
Flexible and simple library for creating charts using Jetpack Compose.
Note: currently this library is under development and is using some beta/alpha release components.
Table of contents:
You can add cchart to your project by simply adding it as dependency:
allprojects {
  repositories {
    ...
    maven { url 'https://jitpack.io' }
  }
}
dependencies {
        implementation 'com.github.staakk:cchart:$version'
}
Where version can be either a tag or a commit hash.
Here are few examples together with the code, for more examples check out the samples.
Click to view the code.
val horizontalLabelRenderer = horizontalLabelRenderer()
val verticalLabelRenderer = verticalLabelRenderer()
Chart(
  modifier = Modifier
    .padding(start = 32.dp, bottom = 32.dp)
    .aspectRatio(1f, false)
    .padding(bottom = 16.dp),
  viewport = Viewport(0f, 10f, 0f, 10f)
) {
  series(
    seriesOf(
      pointOf(0f, 1.3f),
      pointOf(1f, 2.4f),
      pointOf(2f, 2.3f),
      pointOf(3f, 4.8f),
      pointOf(4f, 4.3f),
      pointOf(5f, 5.3f),
      pointOf(6f, 5.7f),
      pointOf(7f, 6.3f),
      pointOf(8f, 6.1f),
      pointOf(9f, 8.3f),
      pointOf(10f, 9.1f),
    ),
    renderer = lineRenderer(lineDrawer = drawLine(brush = SolidColor(Blue)))
  )

  verticalAxis(
    verticalAxisRenderer(
      axisDrawer = axisDrawer(brush = SolidColor(DarkGrey))
    )
  )

  horizontalAxis(
    horizontalAxisRenderer(
      axisDrawer = axisDrawer(brush = SolidColor(DarkGrey))
    )
  )

  verticalAxisLabels(verticalLabelRenderer)

  horizontalAxisLabels(horizontalLabelRenderer)

  grid(
    gridRenderer(
      brush = SolidColor(LightGrey),
      orientation = GridOrientation.HORIZONTAL
    )
  )
}
Click to view the code.
val horizontalLabelRenderer = horizontalLabelRenderer(
  labelsProvider = object : LabelsProvider {
    private val pattern = "MMMM \nyyyy"
    private val formatter = DateTimeFormatter.ofPattern(pattern)

    override fun provide(
      min: Float,
      max: Float
    ): List<Pair<String, Float>> {
      var currentDate = LocalDate.ofEpochDay(min.toLong()).withDayOfMonth(1)
      val endDate = LocalDate.ofEpochDay(max.toLong()).withDayOfMonth(1)

      val labels = mutableListOf<Pair<String, Float>>()
      while (currentDate.isBefore(endDate)) {
        labels.add(
          currentDate.format(formatter) to currentDate.toEpochDay()
            .toFloat()
        )
        currentDate = currentDate.plusMonths(1)
      }
      return labels
    }
  }
)
val verticalLabelRenderer = verticalLabelRenderer { min, max ->
  (min.toInt()..max.toInt())
    .filter { it % 25 == 0 }
    .map { "$it%" to it.toFloat() }
}
Chart(
  modifier = Modifier
    .padding(start = 32.dp, bottom = 32.dp)
    .aspectRatio(1f, false)
    .padding(bottom = 16.dp),
  viewport = Viewport(
    minX = LocalDate.of(2020, 9, 1).toEpochDay(),
    maxX = LocalDate.of(2021, 1, 1).toEpochDay(),
    minY = 0f,
    maxY = 100f
  )
) {
  series(
    groupedSeriesOf(
      listOf(
        pointOf(LocalDate.of(2020, 10, 1).toEpochDay(), 78f),
        pointOf(LocalDate.of(2020, 10, 1).toEpochDay(), 68f),
      ),
      listOf(
        pointOf(LocalDate.of(2020, 11, 1).toEpochDay(), 56f),
        pointOf(LocalDate.of(2020, 11, 1).toEpochDay(), 45f),
      ),
      listOf(
        pointOf(LocalDate.of(2020, 12, 1).toEpochDay(), 82f),
        pointOf(LocalDate.of(2020, 12, 1).toEpochDay(), 86f),
      )
    ),
    renderer = barGroupRenderer(
      preferredWidth = 64f,
      barDrawer = drawBar { index, _ ->
        SolidColor(
          when (index) {
            0 -> DeepPurple
            1 -> Green
            else -> Pink
          }
        )
      }
    )
  )

  verticalAxis(
    verticalAxisRenderer(
      axisDrawer = axisDrawer(brush = SolidColor(DarkGrey))
    )
  )

  horizontalAxis(
    horizontalAxisRenderer(
      axisDrawer = axisDrawer(brush = SolidColor(DarkGrey))
    )
  )

  dataLabels {
    Text(
      modifier = Modifier.align(
        HorizontalAlignment.CENTER,
        VerticalAlignment.TOP
      ),
      text = "${data.y.toInt()}%",
      style = TextStyle(fontSize = 12.sp)
    )
  }

  verticalAxisLabels(verticalLabelRenderer)

  horizontalAxisLabels(horizontalLabelRenderer)
}
Click to view the code.
val horizontalLabelRenderer = horizontalLabelRenderer()
val density = LocalDensity.current
Chart(
  modifier = Modifier
    .padding(start = 32.dp, bottom = 32.dp, end = 32.dp)
    .aspectRatio(1f, false)
    .padding(bottom = 16.dp),
  viewport = Viewport(0f, 10f, 0f, 10f)
) {
  series(
    seriesOf(
      pointOf(0f, 1.3f),
      pointOf(1f, 2.4f),
      pointOf(2f, 2.3f),
      pointOf(3f, 4.8f),
      pointOf(4f, 4.3f),
      pointOf(5f, 5.3f),
      pointOf(6f, 5.7f),
      pointOf(7f, 6.3f),
      pointOf(8f, 6.1f),
      pointOf(9f, 8.3f),
      pointOf(10f, 9.1f),
    ),
    renderer = combine(
      lineRenderer(lineDrawer = drawLine(brush = SolidColor(Blue))),
      pointRenderer(
        size = with(density) { 8.dp.toPx() }.let { Size(it, it) },
        pointDrawer = drawCircle(brush = SolidColor(LightBlue))
      )
    )
  )

  series(
    seriesOf(
      pointOf(0f, 9.1f),
      pointOf(1f, 8.3f),
      pointOf(2f, 6.1f),
      pointOf(3f, 6.3f),
      pointOf(4f, 5.3f),
      pointOf(5f, 4.3f),
      pointOf(6f, 4.8f),
      pointOf(7f, 5.7f),
      pointOf(8f, 2.3f),
      pointOf(9f, 2.4f),
      pointOf(10f, 1.3f),
    ),
    renderer = combine(
      lineRenderer(lineDrawer = drawLine(brush = SolidColor(Green))),
      pointRenderer(
        size = with(density) { 8.dp.toPx() }.let { Size(it, it) },
        pointDrawer = drawCircle(brush = SolidColor(LightGreen))
      )
    )
  )

  verticalAxis(
    verticalAxisRenderer(
      axisDrawer = axisDrawer(brush = SolidColor(Blue)),
      location = 0f
    )
  )

  verticalAxis(
    verticalAxisRenderer(
      axisDrawer = axisDrawer(brush = SolidColor(Green)),
      location = 1f
    )
  )

  horizontalAxis(
    horizontalAxisRenderer(
      axisDrawer = axisDrawer(brush = SolidColor(DarkGrey))
    )
  )

  verticalAxisLabels(
    verticalLabelRenderer(
      paint = Paint().apply {
        color = Blue.toArgb()
        typeface = Typeface.DEFAULT
        textSize = with(density) { 12.sp.toPx() }
        isAntiAlias = true
      },
      location = 0f,
      alignment = Alignment.CenterLeft
    )
  )

  verticalAxisLabels(verticalLabelRenderer(
    paint = Paint().apply {
      color = Green.toArgb()
      typeface = Typeface.DEFAULT
      textSize = with(density) { 12.sp.toPx() }
      isAntiAlias = true
    },
    location = 1f,
    alignment = Alignment.CenterRight,
    labelOffset = Offset(12f, 0f)
  ) { min, max -> (min.toInt()..(max.toInt() + 1)).map { "${it * 2}" to it.toFloat() } })

  horizontalAxisLabels(horizontalLabelRenderer)

  grid(
    gridRenderer(
      brush = SolidColor(LightGrey),
      orientation = GridOrientation.HORIZONTAL
    )
  )
}Example below creates a basic chart with data rendered as points. It also features horizontal and vertical axis together with labels.
// Create axis and label renderers.
val horizontalLabelRenderer = horizontalLabelRenderer()
val verticalLabelRenderer = verticalLabelRenderer()
val horizontalAxisRenderer = horizontalAxisRenderer()
val verticalAxisRenderer = verticalAxisRenderer()

Chart(
    modifier = Modifier
        // Additional padding so the labels can be visible.
        .padding(start = 32.dp, bottom = 32.dp)
        // Let's make the chart square.
        .aspectRatio(1f, false),
    // The viewport of the chart.
    viewport = Viewport(0f, 10f, 0f, 5f)
) {
    // Adds series of data to the chart.
    series(
        seriesOf(
            pointOf(2f, 1.5f),
            pointOf(4f, 3.5f),
            pointOf(6f, 1.3f),
            pointOf(9f, 4.7f),
        ),
        // The points will be rendered as red circles 20px in diameter.
        renderer = pointRenderer(
            size = Size(20f, 20f),
            pointDrawer = drawCircle(brush = SolidColor(Colors.Red))
        )
    )

    // The following four lines set the axis and the labels for them.
    horizontalAxis(horizontalAxisRenderer)

    horizontalAxisLabels(horizontalLabelRenderer)

    verticalAxis(verticalAxisRenderer)

    verticalAxisLabels(verticalLabelRenderer)
}The point renderer can be created by using pointRenderer() function. It can be used to render a Series.
/**
 * Creates [SeriesRenderer] that renders points.
 *
 * @param size Size of the points to render in pixels.
 * @param pointDrawer A function drawing the point.
 * @param boundingShapeProvider Provider of the [BoundingShape].
 *
 * @see [io.github.staakk.cchart.ChartScope.series]
 */
fun pointRenderer(
    size: Size = Size(30f, 30f),
    pointDrawer: PointDrawer = drawCircle(),
    boundingShapeProvider: PointBoundingShapeProvider = circleBoundingShapeProvider()
): SeriesRenderer
By default this function will render a filled circle of diameter 30px. The default circleBoundingShapeProvider() will provide a bounding shape for it also as a circle with 30px diameter.
One can customize the drawn shape and its bounding shape by providing custom implementation of PointDrawer and PointBoundingShapeProvider.
The line renderer can be created by using lineRenderer() function. It can be used to render a Series.
/**
 * Creates [SeriesRenderer] that renders a line.
 *
 * @param lineDrawer A function drawing the line.
 * @param boundingShapeProvider Provider of the [BoundingShape]s for the rendered line.
 *
 * @see [io.github.staakk.cchart.ChartScope.series]
 */
fun lineRenderer(
    lineDrawer: LineDrawer = drawLine(),
    boundingShapeProvider: LineBoundingShapeProvider = lineBoundingShapeProvider()
): Series RendererThe bar renderer can be created by using barGroupRenderer() function. It can be used to render a GroupedSeries.
/**
 * Renders bars on the chart.
 *
 * @param preferredWidth Preferred width of the bars. If there's no enough space to maintain
 * [minimalSpacing] distance between the bars this value will be adjusted.
 * @param minimalSpacing Minimal spacing between the bars.
 * @param barDrawer Draws the bars.
 * @param boundingShapeProvider Provides bounding shapes for rendered bars.
 *
 * @see [io.github.staakk.cchart.ChartScope.series]
 */
fun barGroupRenderer(
    preferredWidth: Float,
    minimalSpacing: Float = 10f,
    barDrawer: BarDrawer = drawBar(),
    boundingShapeProvider: BarBoundingShapeProvider = barBoundingShapeProvider()
): GroupedSeriesRendererThe axis can be added to the chart by using horizontalAxis() and verticalAxis() functions.
Chart(
    // Configuration of the chart
) {
    // Adding series etc.

    horizontalAxis(horizontalAxisRenderer)

    verticalAxis(verticalAxisRenderer)
}
The axis renderers can be created using the following functions:
/**
 * Creates renderer for horizontal axis.
 *
 * @param location Location of the axis in percents.
 * @param axisDrawer Function drawing the axis.
 */
fun horizontalAxisRenderer(
    location: Float = HorizontalAxisRenderer.Bottom,
    axisDrawer: AxisDrawer = axisDrawer()
): HorizontalAxisRenderer

/**
 * Creates renderer for vertical axis.
 *
 * @param location Location of the axis in percents.
 * @param axisDrawer Function drawing the axis.
 */
fun verticalAxisRenderer(
    location: Float = VerticalAxisRenderer.Left,
    axisDrawer: AxisDrawer = axisDrawer()
): VerticalAxisRenderer
It is also possible to customize how the axis is drawn by providing custom AxisDrawer or using existing one with different parameters.
Labels for the axis can be provided via horizontalAxisLabels() and verticalAxisLabels() functions:
Chart(
    // Configuration of the chart
) {
    // Adding series etc.

    horizontalAxisLabels(horizontalAxisLabelsRenderer)

    verticalAxisLabels(verticalAxisLabelsRenderer)
}
The labels renderers can be created by using the following:
/**
 * Creates a [HorizontalLabelRenderer].
 *
 * @param paint Paint to draw the labels text with.
 * @param location Location of the label in percents.
 * @param alignment The alignment of the label relative to the position at which it should be
 * rendered.
 * @param textAlignment The alignment of the label text.
 * @param labelOffset Offset of the label position relative to the position at which it should be
 * rendered.
 * @param labelsProvider Provides the labels text and position for the given range.
 */
fun horizontalLabelRenderer(
    paint: Paint,
    location: Float = 1f,
    alignment: Alignment = Alignment.BottomCenter,
    textAlignment: TextAlignment = TextAlignment.Left,
    labelOffset: Offset = Offset(0f, 12f),
    labelsProvider: LabelsProvider = IntLabelsProvider
): HorizontalLabelRenderer

/**
 * Creates a [VerticalLabelRenderer].
 *
 * @param paint Paint to draw the labels text with.
 * @param location Location of the label in percents.
 * @param alignment The alignment of the label relative to the position at which it should be
 * rendered.
 * @param textAlignment The alignment of the label text.
 * @param labelOffset Offset of the label position relative to the position at which it should be
 * rendered.
 * @param labelsProvider Provides the labels text and position for the given range.
 */
fun verticalLabelRenderer(
    paint: Paint,
    location: Float = 0f,
    alignment: Alignment = Alignment.CenterLeft,
    textAlignment: TextAlignment = TextAlignment.Left,
    labelOffset: Offset = Offset(-12f, 0f),
    labelsProvider: LabelsProvider = IntLabelsProvider
): VerticalLabelRenderer
The labels can be further customized by providing implementation of the label renderers.
In order to create labels for data one can use dataLabels() function as follows.
Chart(
    // Configuration of the chart
) {
    // Adding series etc.

    dataLabels {
      Text(
          modifier = Modifier.padding(bottom = 4.dp)
              .align(HorizontalAlignment.CENTER, VerticalAlignment.CENTER),
          text = "(${data.x}, ${data.y})"
      )
    }
}
In order to position the label align(HorizontalAlignment, VerticalAlignment) modifier can be used. All the data related to the point for which the label is rendered can be accessed through the AnchorScope.
cchart offers possibility to add any view to the chart at anchored position. This can be done by using the following API:
Chart(
    // Configuration of the chart
) {
    // Adding series etc.

   anchor(point) {
    Text(
        modifier = Modifier
            .align(HorizontalAlignment.CENTER, VerticalAlignment.CENTER),
        text = "Click to close"
    )
   }
}
This can be used to create popups, buttons or to display additional information on the chart.
Panning can be enabled by just providing maxViewport param to the Chart. To enable zooming minViewportSize, maxViewportSize should be provided and enableZoom must be set to true.
Chart(
    modifier = Modifier
        .padding(start = 32.dp, bottom = 32.dp)
        .aspectRatio(1f, false),
    viewport = Viewport(0f, 10f, 0f, 5f),
    maxViewport = Viewport(-10f, 20f, -5f, 10f),
    minViewportSize = Size(5f, 5f),
    maxViewportSize = Size(10f, 10f),
    enableZoom = true
)For implementing animation see this example.
For observing chart's viewport see this example


