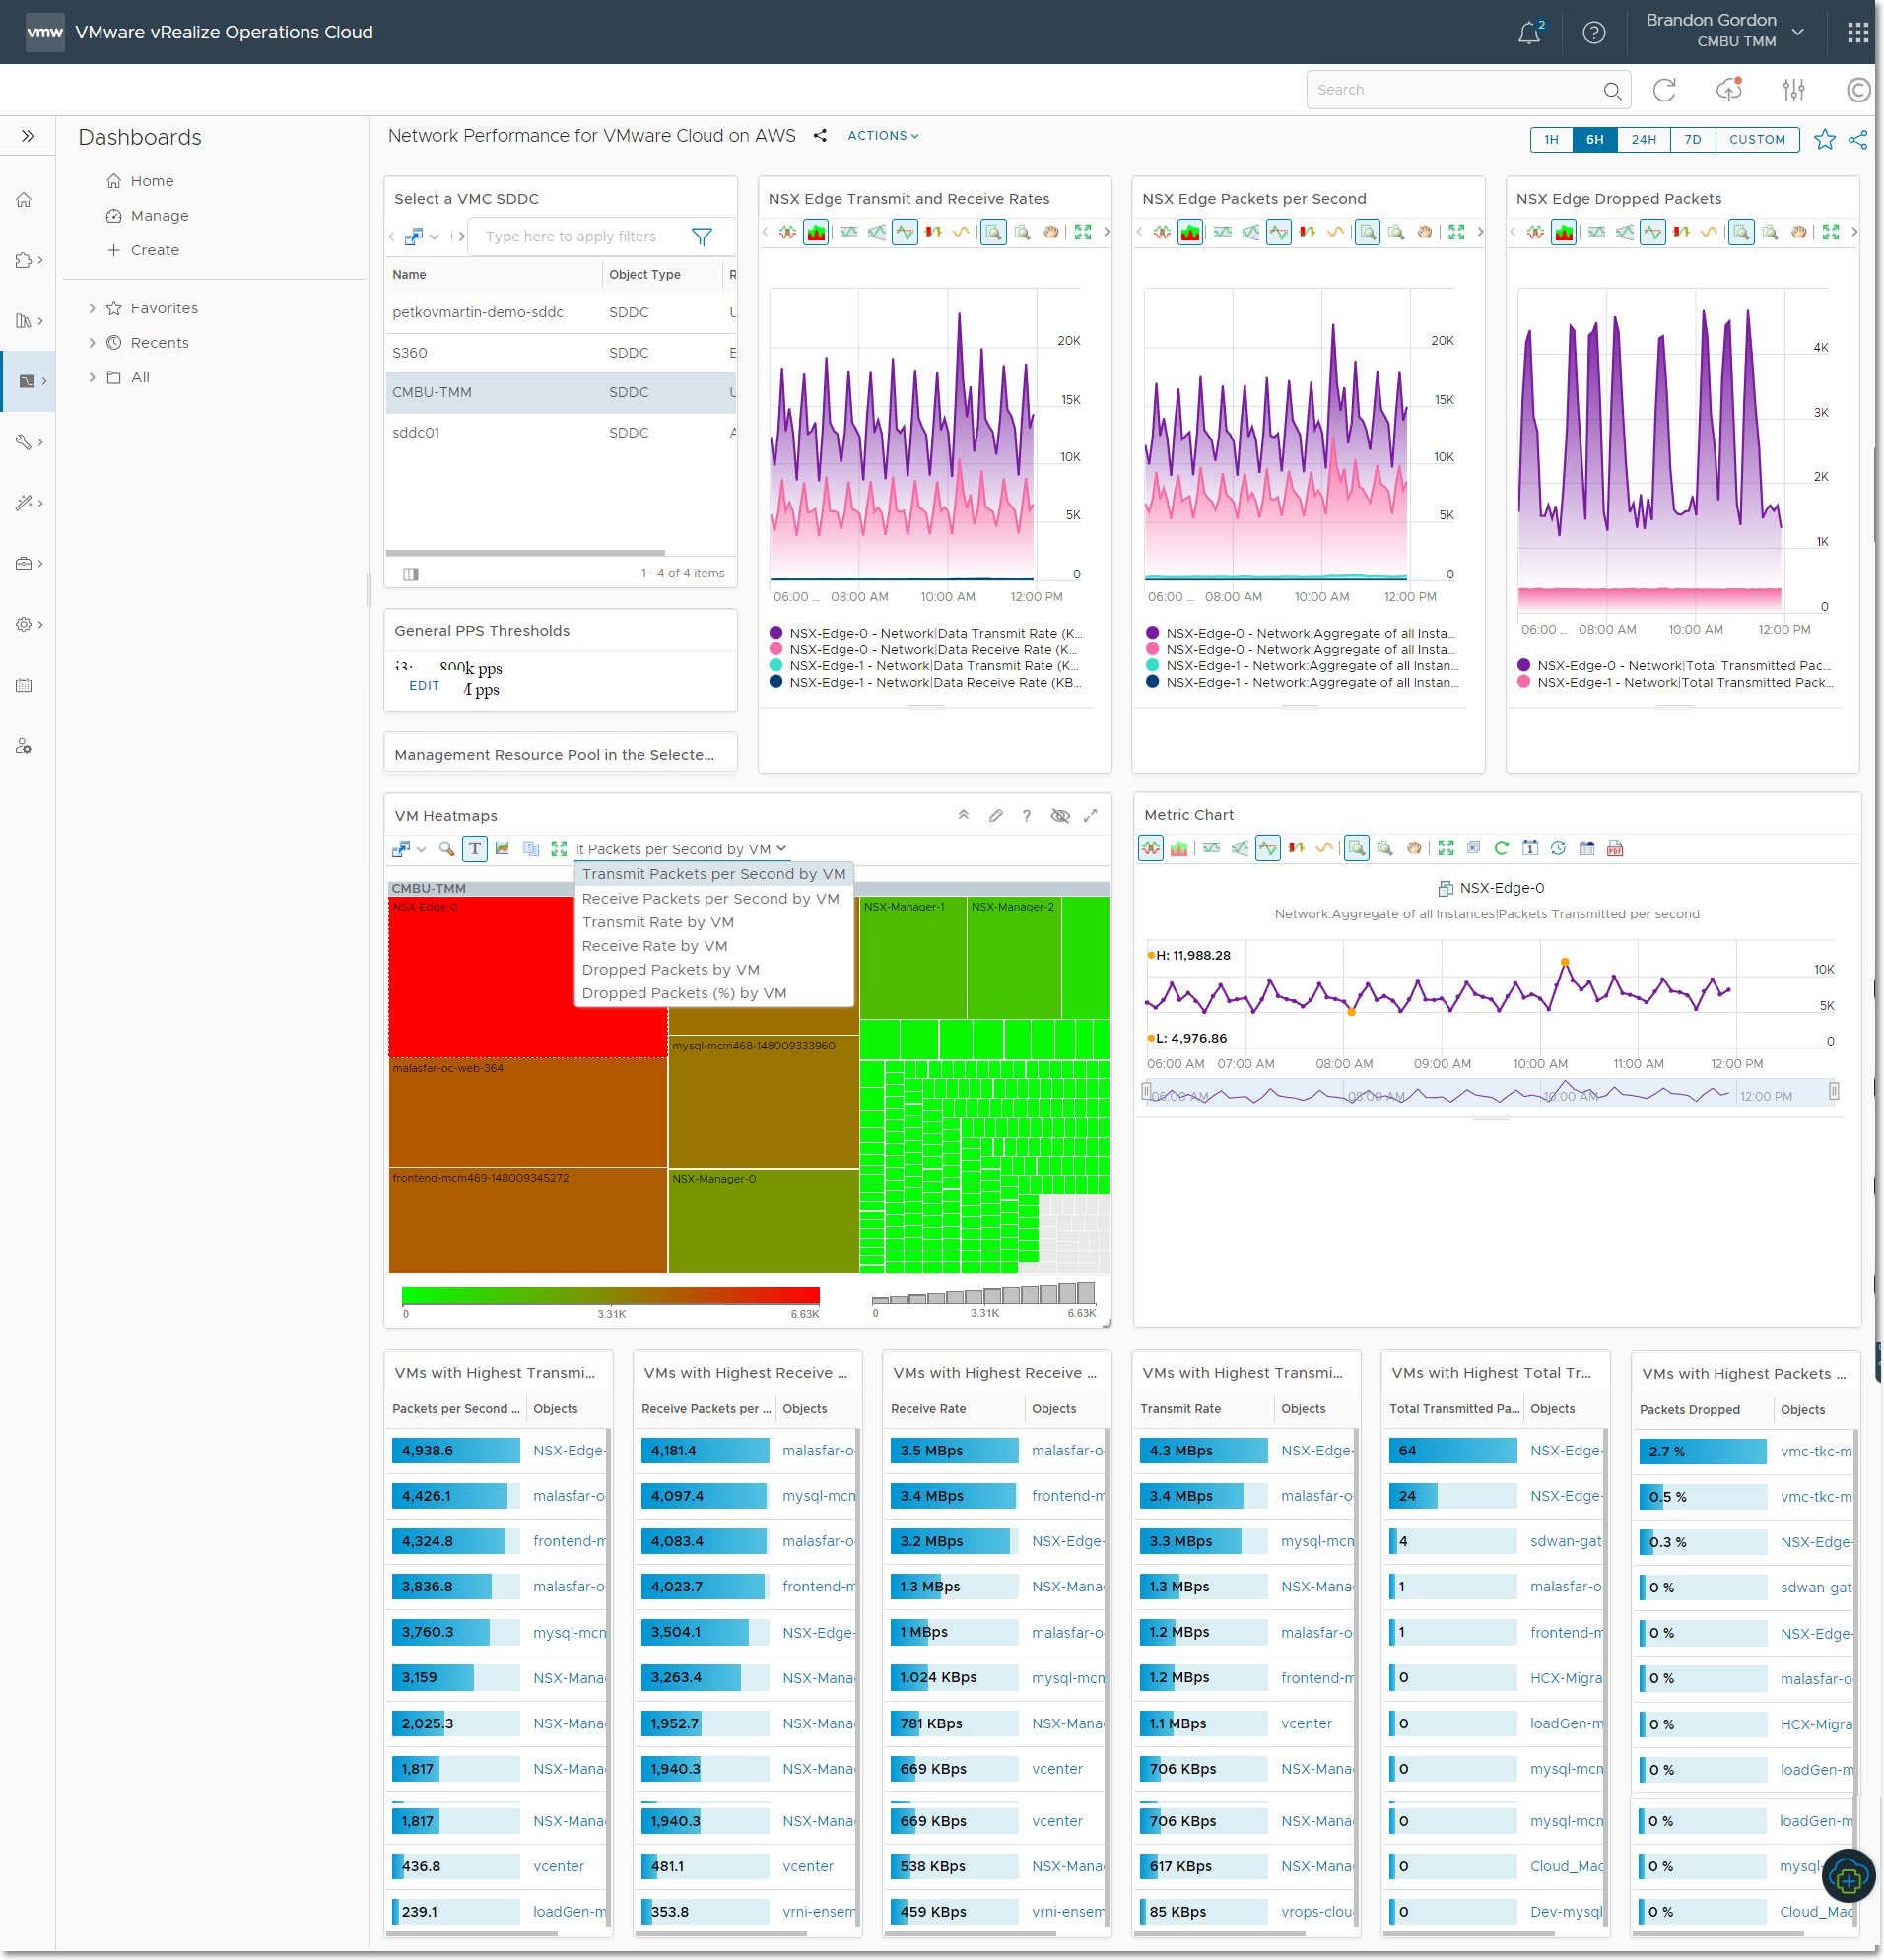
Network Performance for VMware Cloud on AWS Dashboard for vRealize Operations Cloud and vRealize Operations
Use this vRealize Operations dashboard to view performance of NSX Edges in VMware Cloud on AWS. Monitor throughput, packets per second, and dropped packets for NSX Edges. Use the heatmaps to find top talkers and troubleshoot. Optionally, you can add coloring to the packets per second metric chart based on the model of the host the edges are running on. NSX Edges running on i3 can support up to 800,000 packets per second and NSX Edges running on i3en hosts can support up to 1,600,000 packets per second.
- Import the dashboard at
Visualize/Dashboards/Manage/.../Import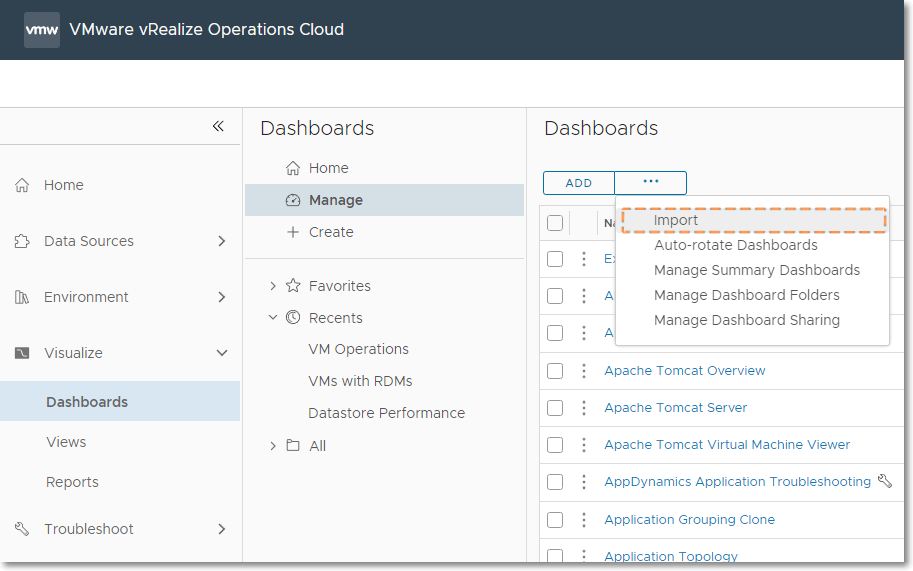
- Click
Browse...then select the file named Dashboards.zip - The included dashboards are listed in the Dashboards section
| Dashboard Name | Dashboard Path |
|---|---|
| Network Performance for VMware Cloud on AWS | Shared Dashboards (GBrandon)/Troubleshooting |
This dashboard requires vRealize Operations Cloud or vRealize Operations 8.2 (or newer)
Please open an issue for feedback.
2022-08-03
- Initial release