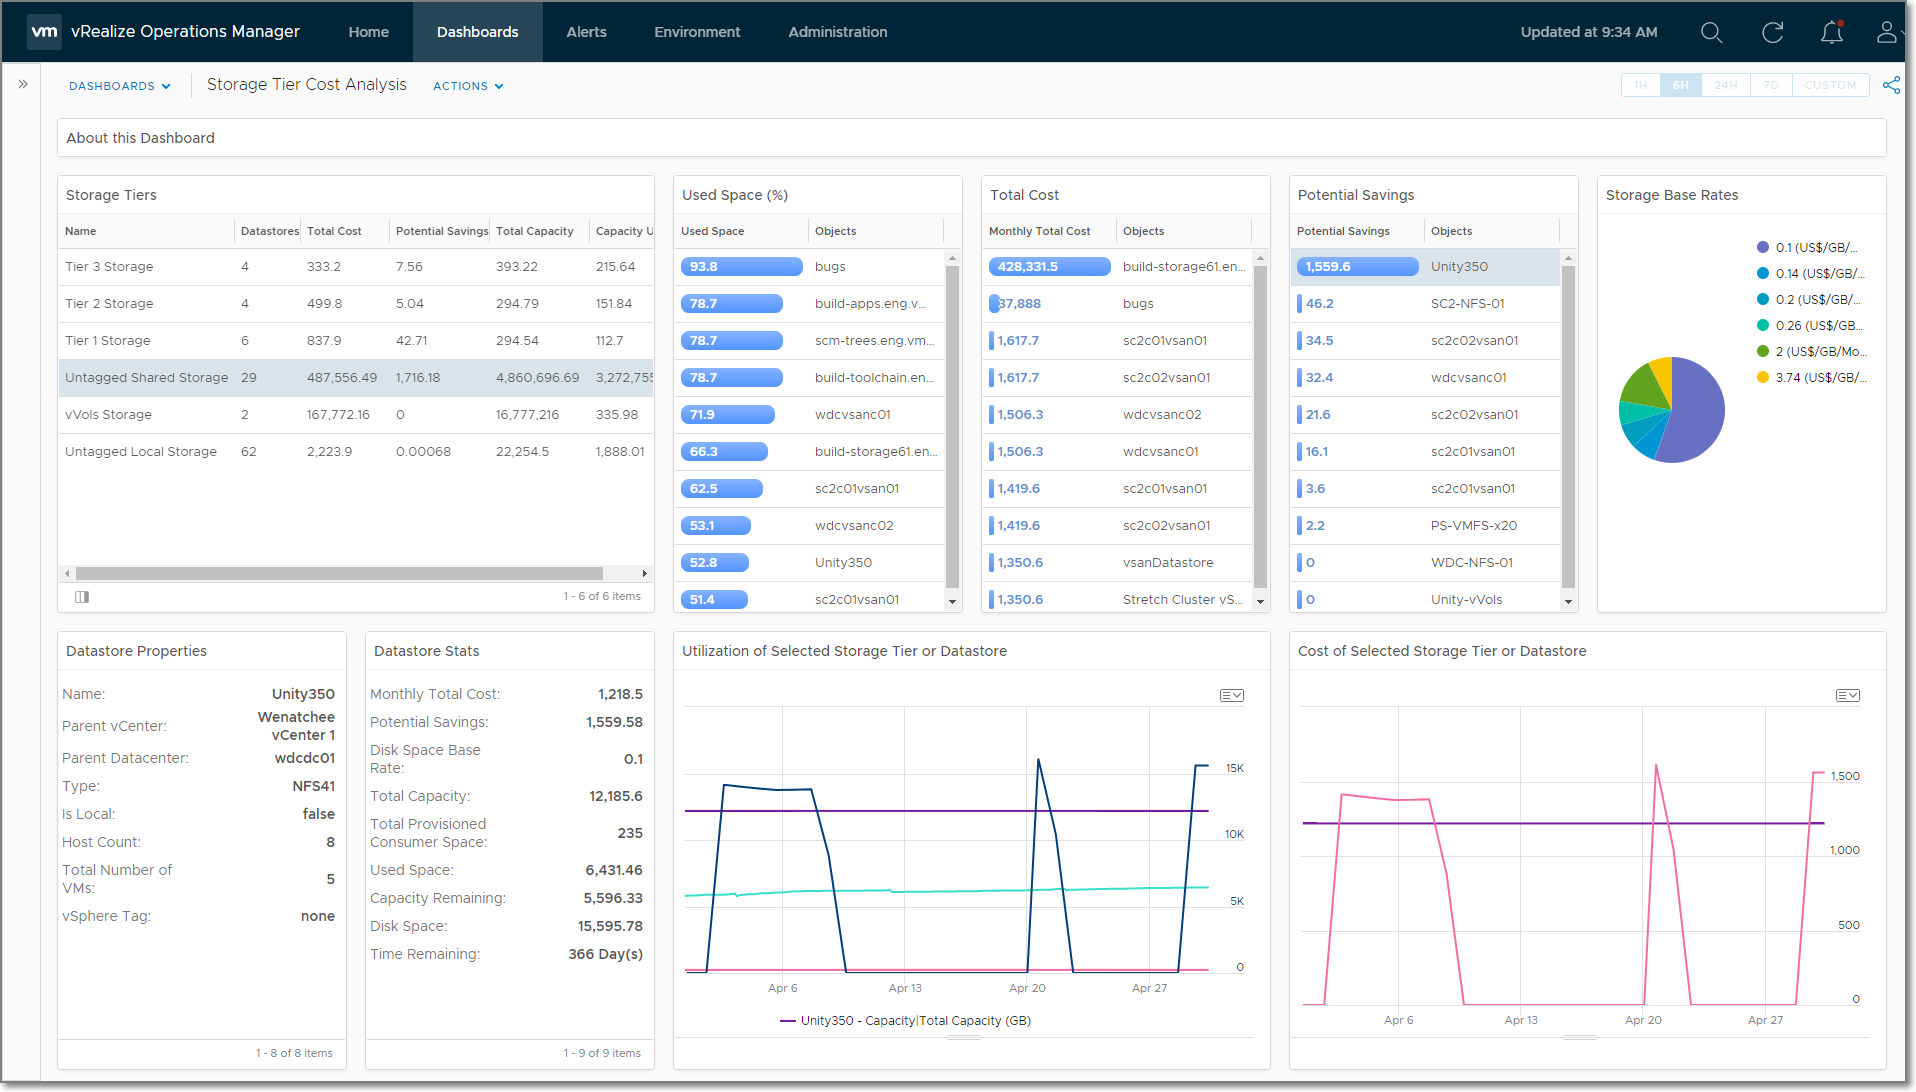
Use this vRealize Operations dashboard to explore storage costs by tiers. The cost engine in vRealize Operations allows setting storage base rates (cost per GB per month) using vSphere Tags. Custom groups based on the same vSphere Tags can be leveraged to provide better insight into storage cost and utilization. To use this dashboard, select a Storage Tier from the list to see utilization, cost, and potential savings for the entire tier. Select a datastore from one of the top-n views to see the details for the specific datastore.
Please note that this dashboard requires additional configuration after importing. Refer to the Configuration section below for details.
- Import the custom groups at
Environment/Custom Groups/Gear Icon/Import Custom Group(s)
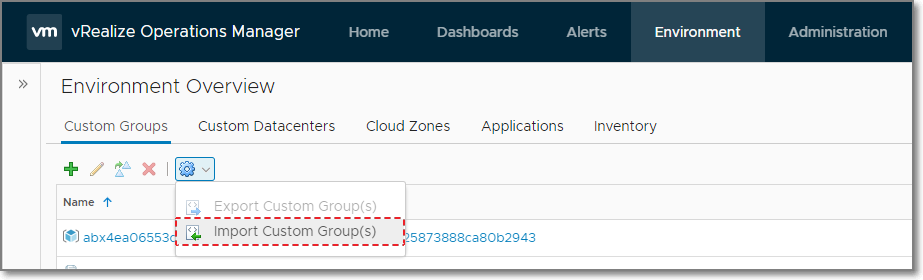
- Click
Browse...then select the file named CustomGroups.json - The included custom groups are listed in the Custom Groups section.
- Import the super metrics at
Administration/Configuration/Super Metrics/Import Super Metric
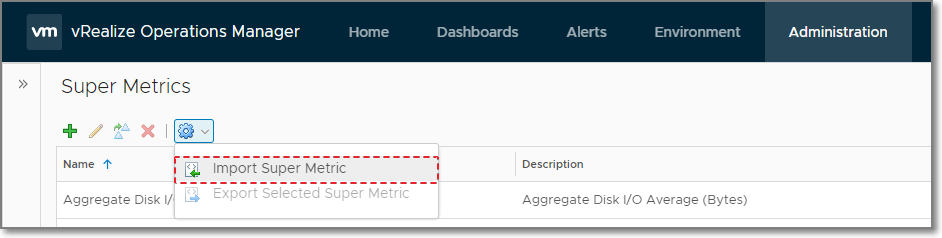
- Click
Browse...then select the file named supermetric.json - For each Super Metric listed in the Super Metrics section, click on the vertical kebab and select edit.
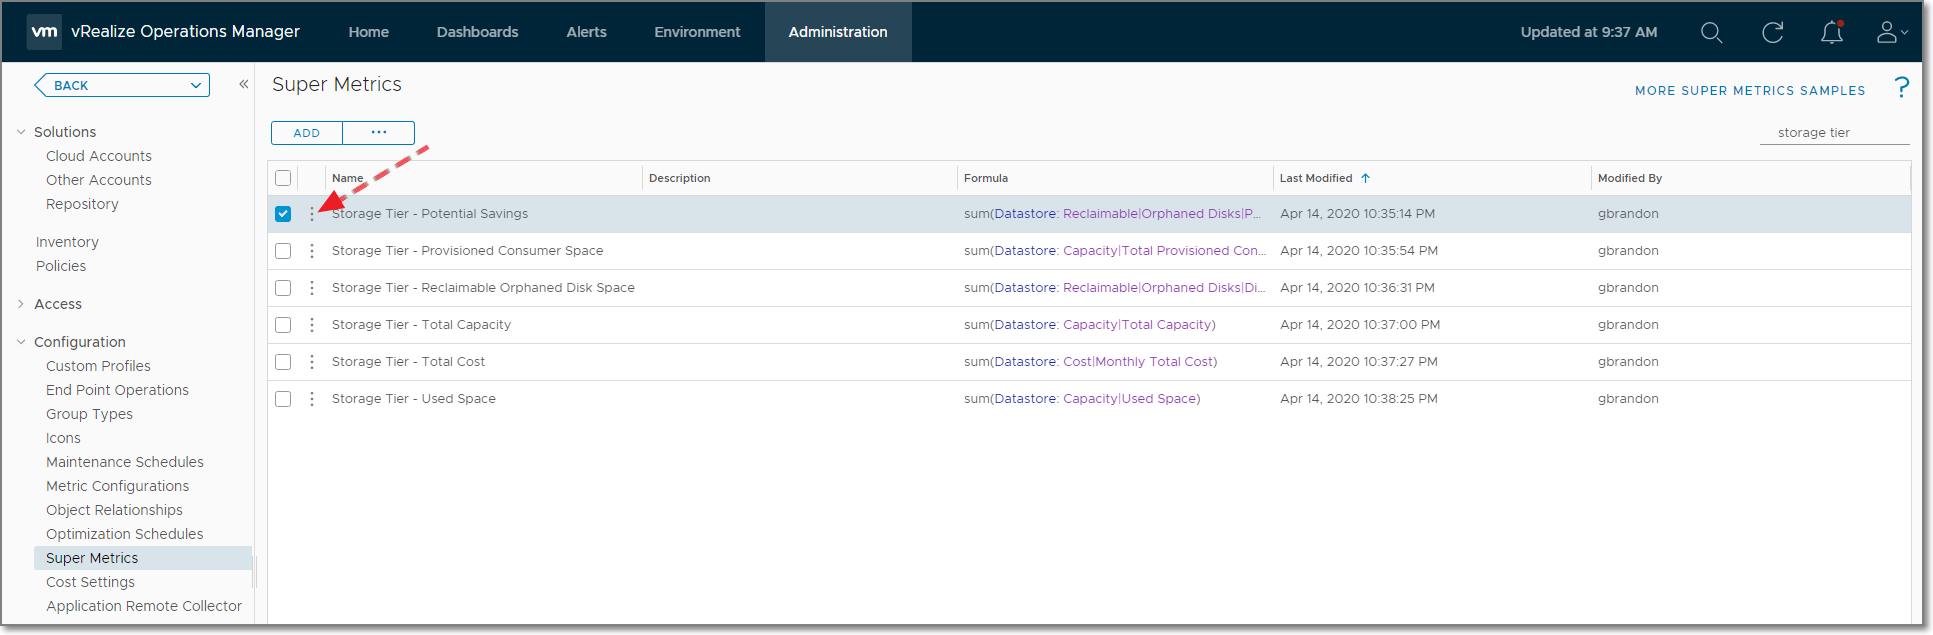
- Enable the Super Metric for each Policy shown in the
Enable in a Policystage of the wizard.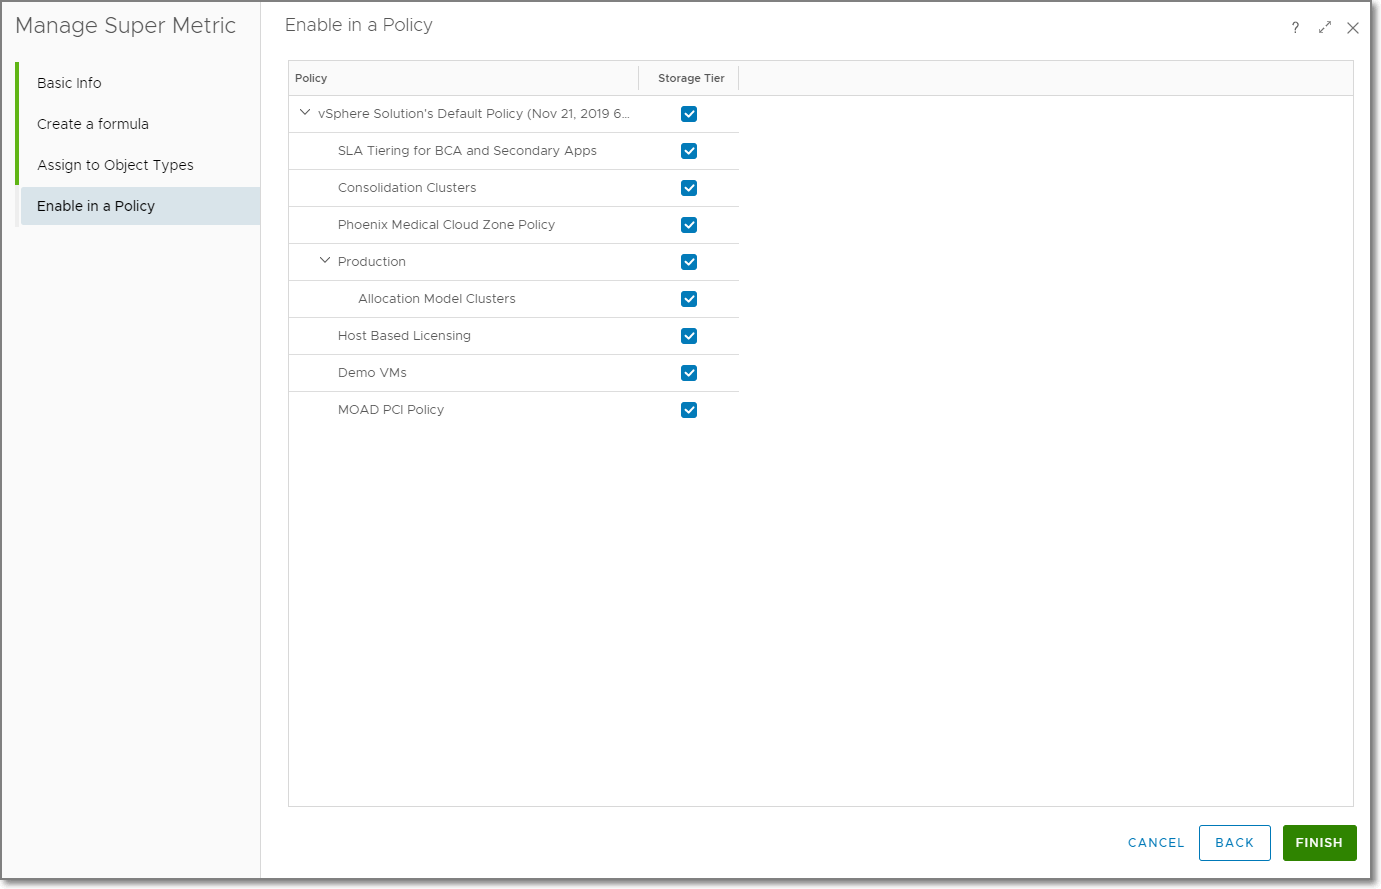
- Repeat the previous 2 steps for the remaining Super Metrics listed in the Super Metrics section.
- Import the view at
Dashboards/Views/Import...
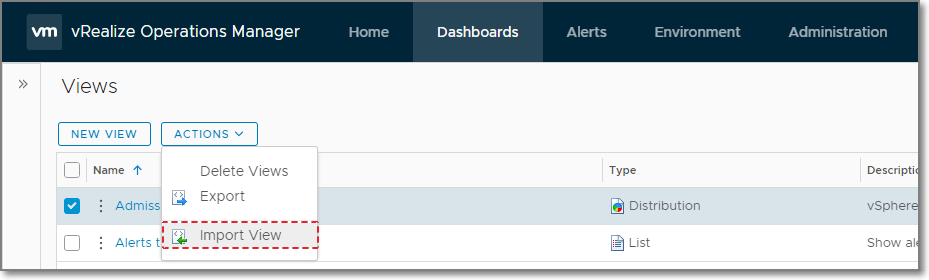
- Click
Browse...then select the file named Views.zip - The included views are listed in the Views section
- Import the dashboard at
Dashboards/Actions/Manage Dashboards/Import Dashboards
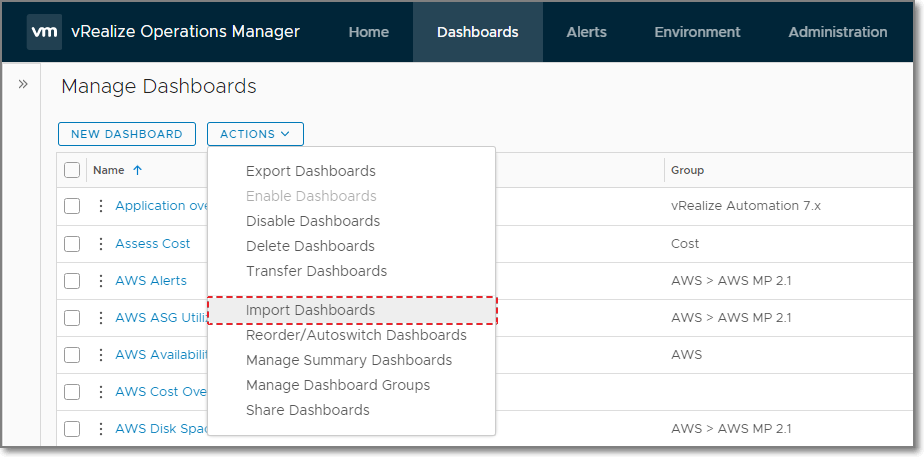
- Click
Browse...then select the file named Dashboard.zip - The dashboard should now be available in in the dashboard list
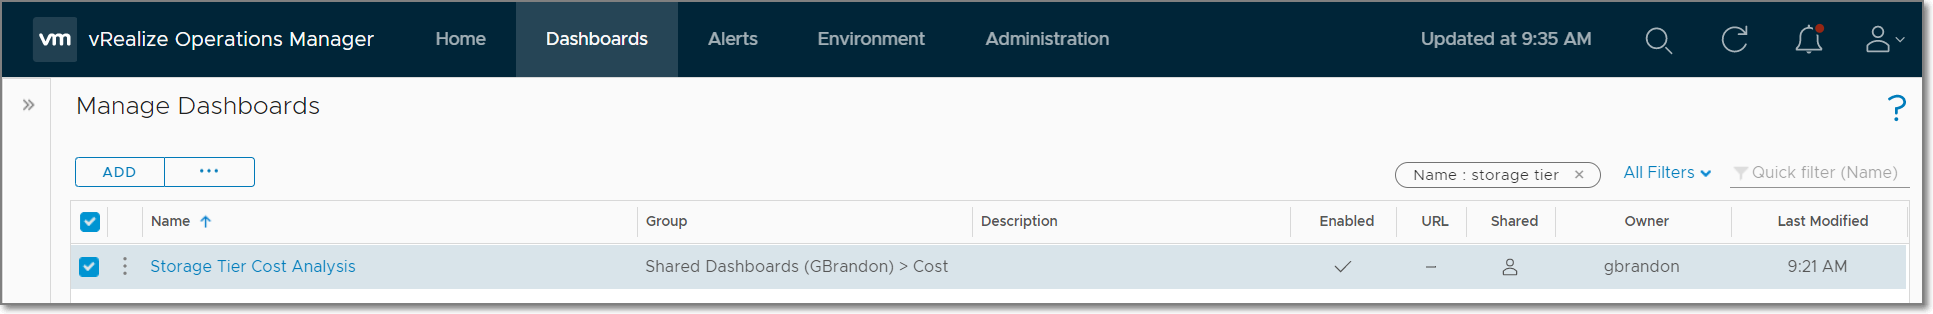
- The included dashboards are listed in the Dashboards section
- Identify the stoage tag category and tag value used in Cost Drivers at
Administration/Configuration/Cost Settings/Cost Drivers/Storage. Take a screenshot if needed as the tags are needed in subsequent steps.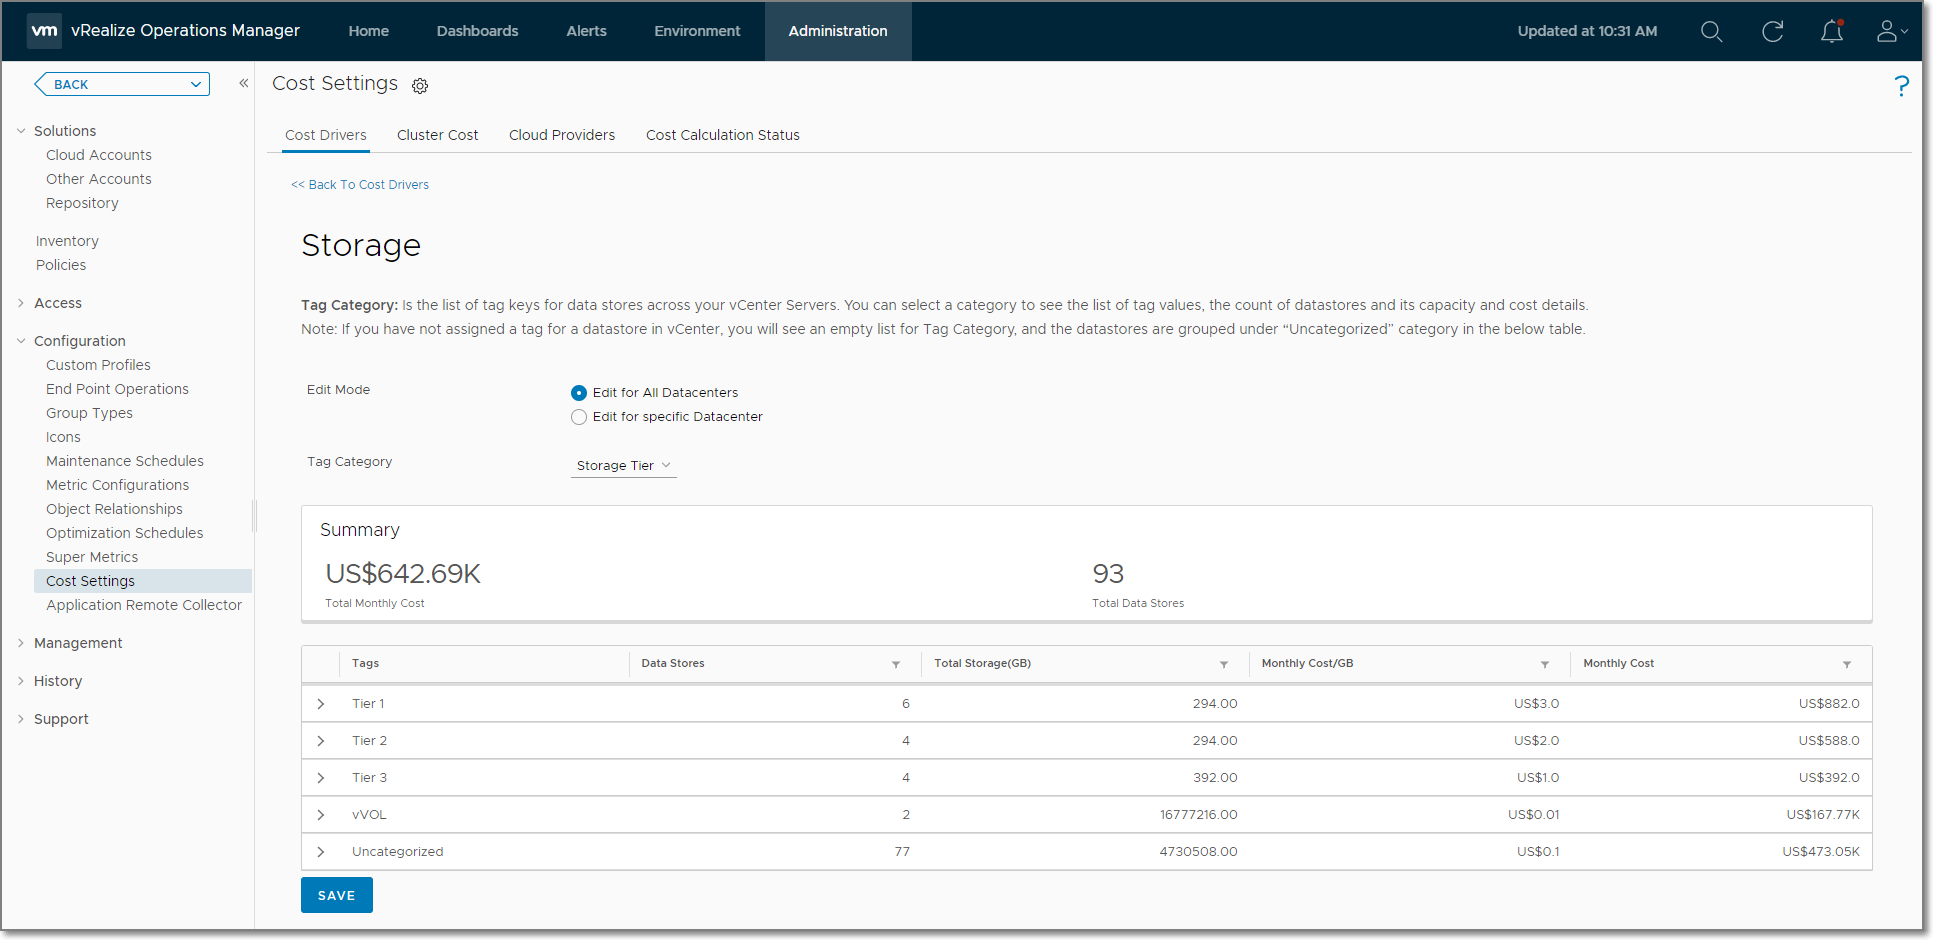
- Navigate to
Environment/Custom Groupsto see the list of custom groups.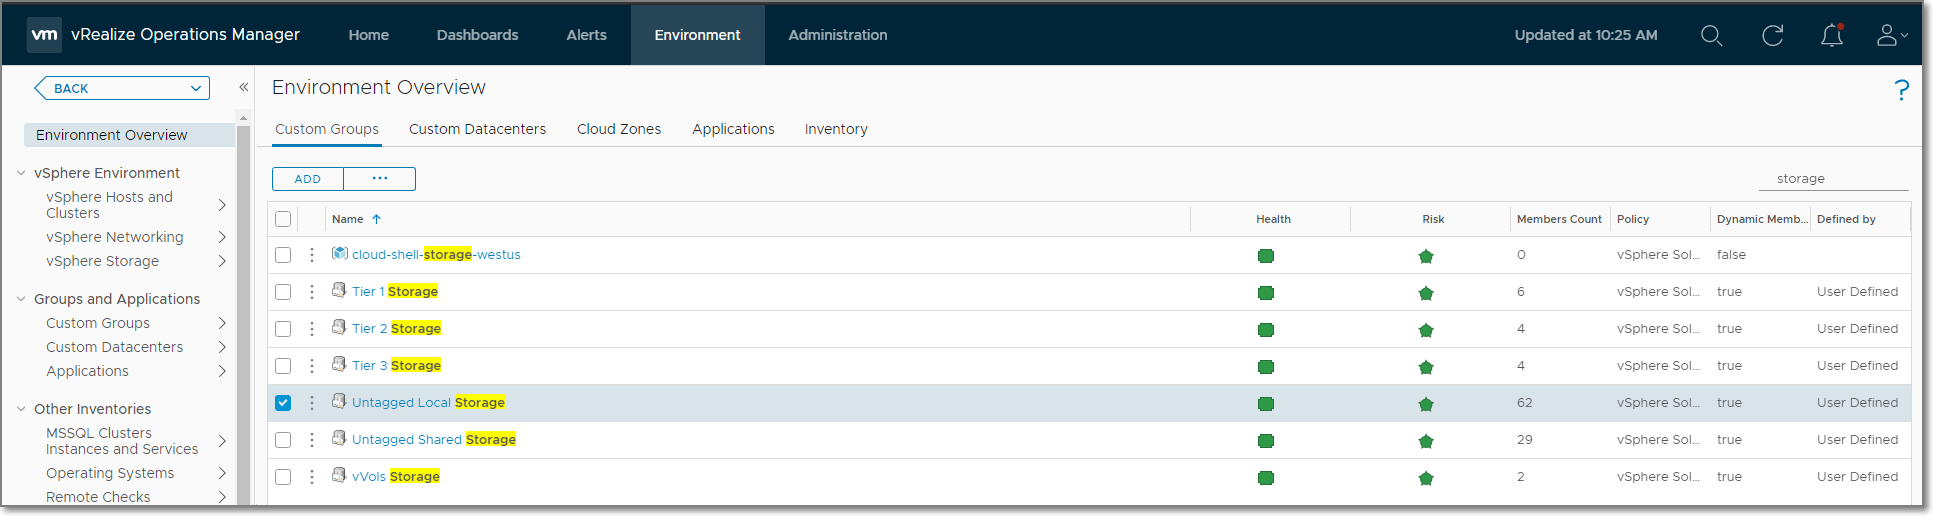
- Edit each custom group in the included Custom Groups and change the category of
Storage Tierto the storage tag category name from step 1.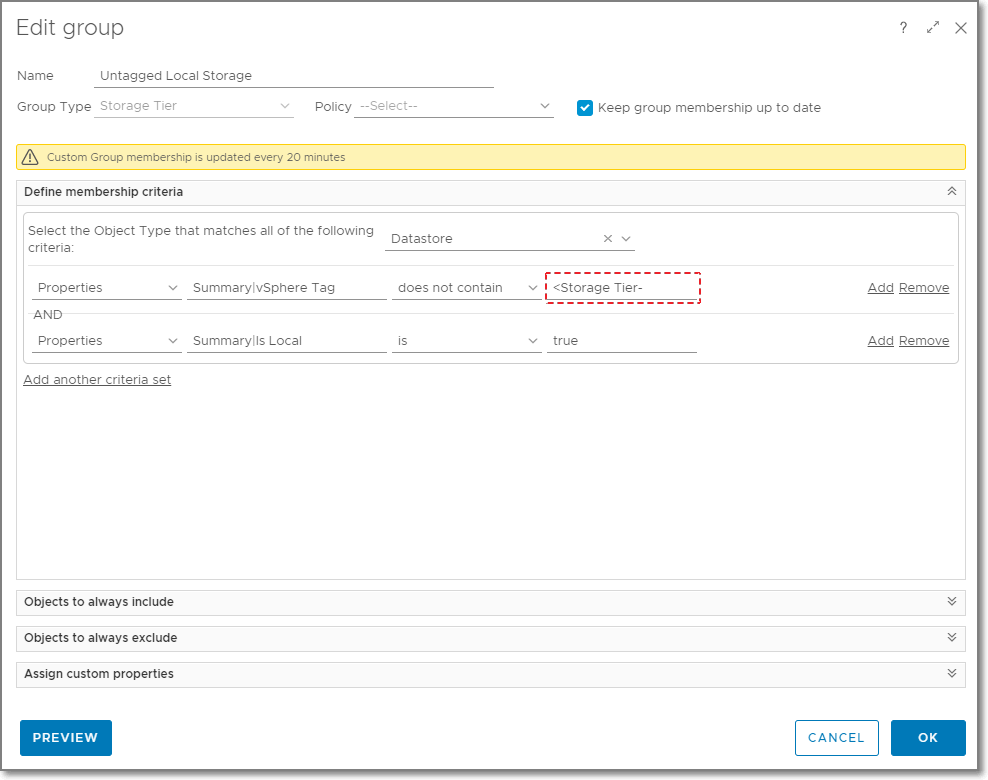
- For each tag value identified in step 1, create a custom group with a group type of
Storage Tier,Keep group membership up to dateenabled, and a rule for datastores that haveSummary|vSphere Tagproperty which contains the tag value. Use the format of<Storage Tier-Tier Name>, whereStorage Tieris the tag category andTier Nameis the tag value. Use thePreviewto validate the rule before saving.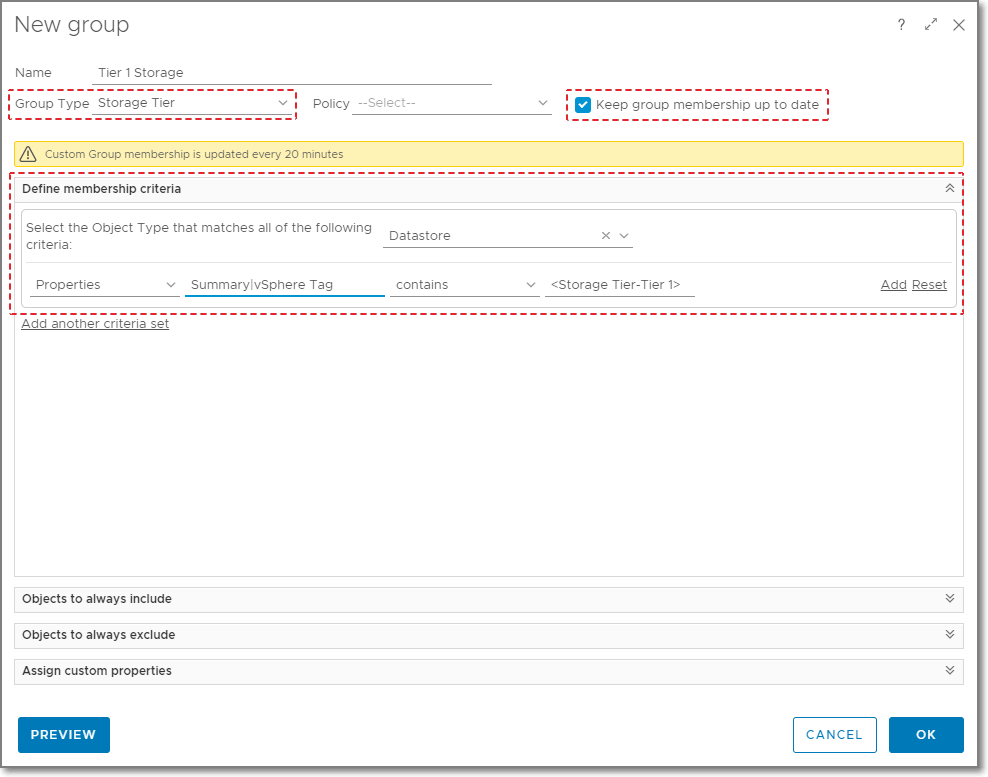
- Repeat the previous step until there is a custom group for each tag value identified in step 1.
- After about 20 minutes the
Storage Tierswidget in the dashboard should start showing the new metrics.
| Dashboard Name | Dashboard Path |
|---|---|
| Storage Tier Cost Analysis | Shared Dashboards (GBrandon)/Cost |
| View Name | Name on Dashboard | View Type |
|---|---|---|
| Storage Base Rates | Storage Base Rate | Distribution |
| Custom Group Name | Group Type |
|---|---|
| Untagged Local Storage | Storage Tier |
| Untagged Shared Storage | Storage Tier |
| Super Metric Name | Object Type |
|---|---|
| Storage Tier - Total Cost | Storage Tier |
| Storage Tier - Potential Savings | Storage Tier |
| Storage Tier - Total Capacity (GB) | Storage Tier |
| Storage Tier - Used Space (GB) | Storage Tier |
| Storage Tier - Provisioned Consumer Space | Storage Tier |
| Storage Tier - Reclaimable Orphaned Disk Space | Storage Tier |
This dashboard requires vRealize Operation 8.1 Advanced or Enterprise edition or vRealize Operations Cloud.
Please open an issue for feedback.
2020-04-30
- Initial release