MUH Ilmava Arduino temperature and humidity sensing hacks,
which idea is to learn from gathering temperature and humidity data how this unit works and what can data analysis do.
Another purpose is to see how much this one heat transfer cell can gather heat and how much is dumped to R4 channel.
See plotting for better image what you can plot with just few DHT22 sensors in each channel.
I am currently just waiting due need to gather a lot of data so this repository code could possibly get some more "features" based on findings, learning curve and analysis of gathered material.
MUH Ilmava is a house ventilation system and this specific unit is very old one from ~1989.
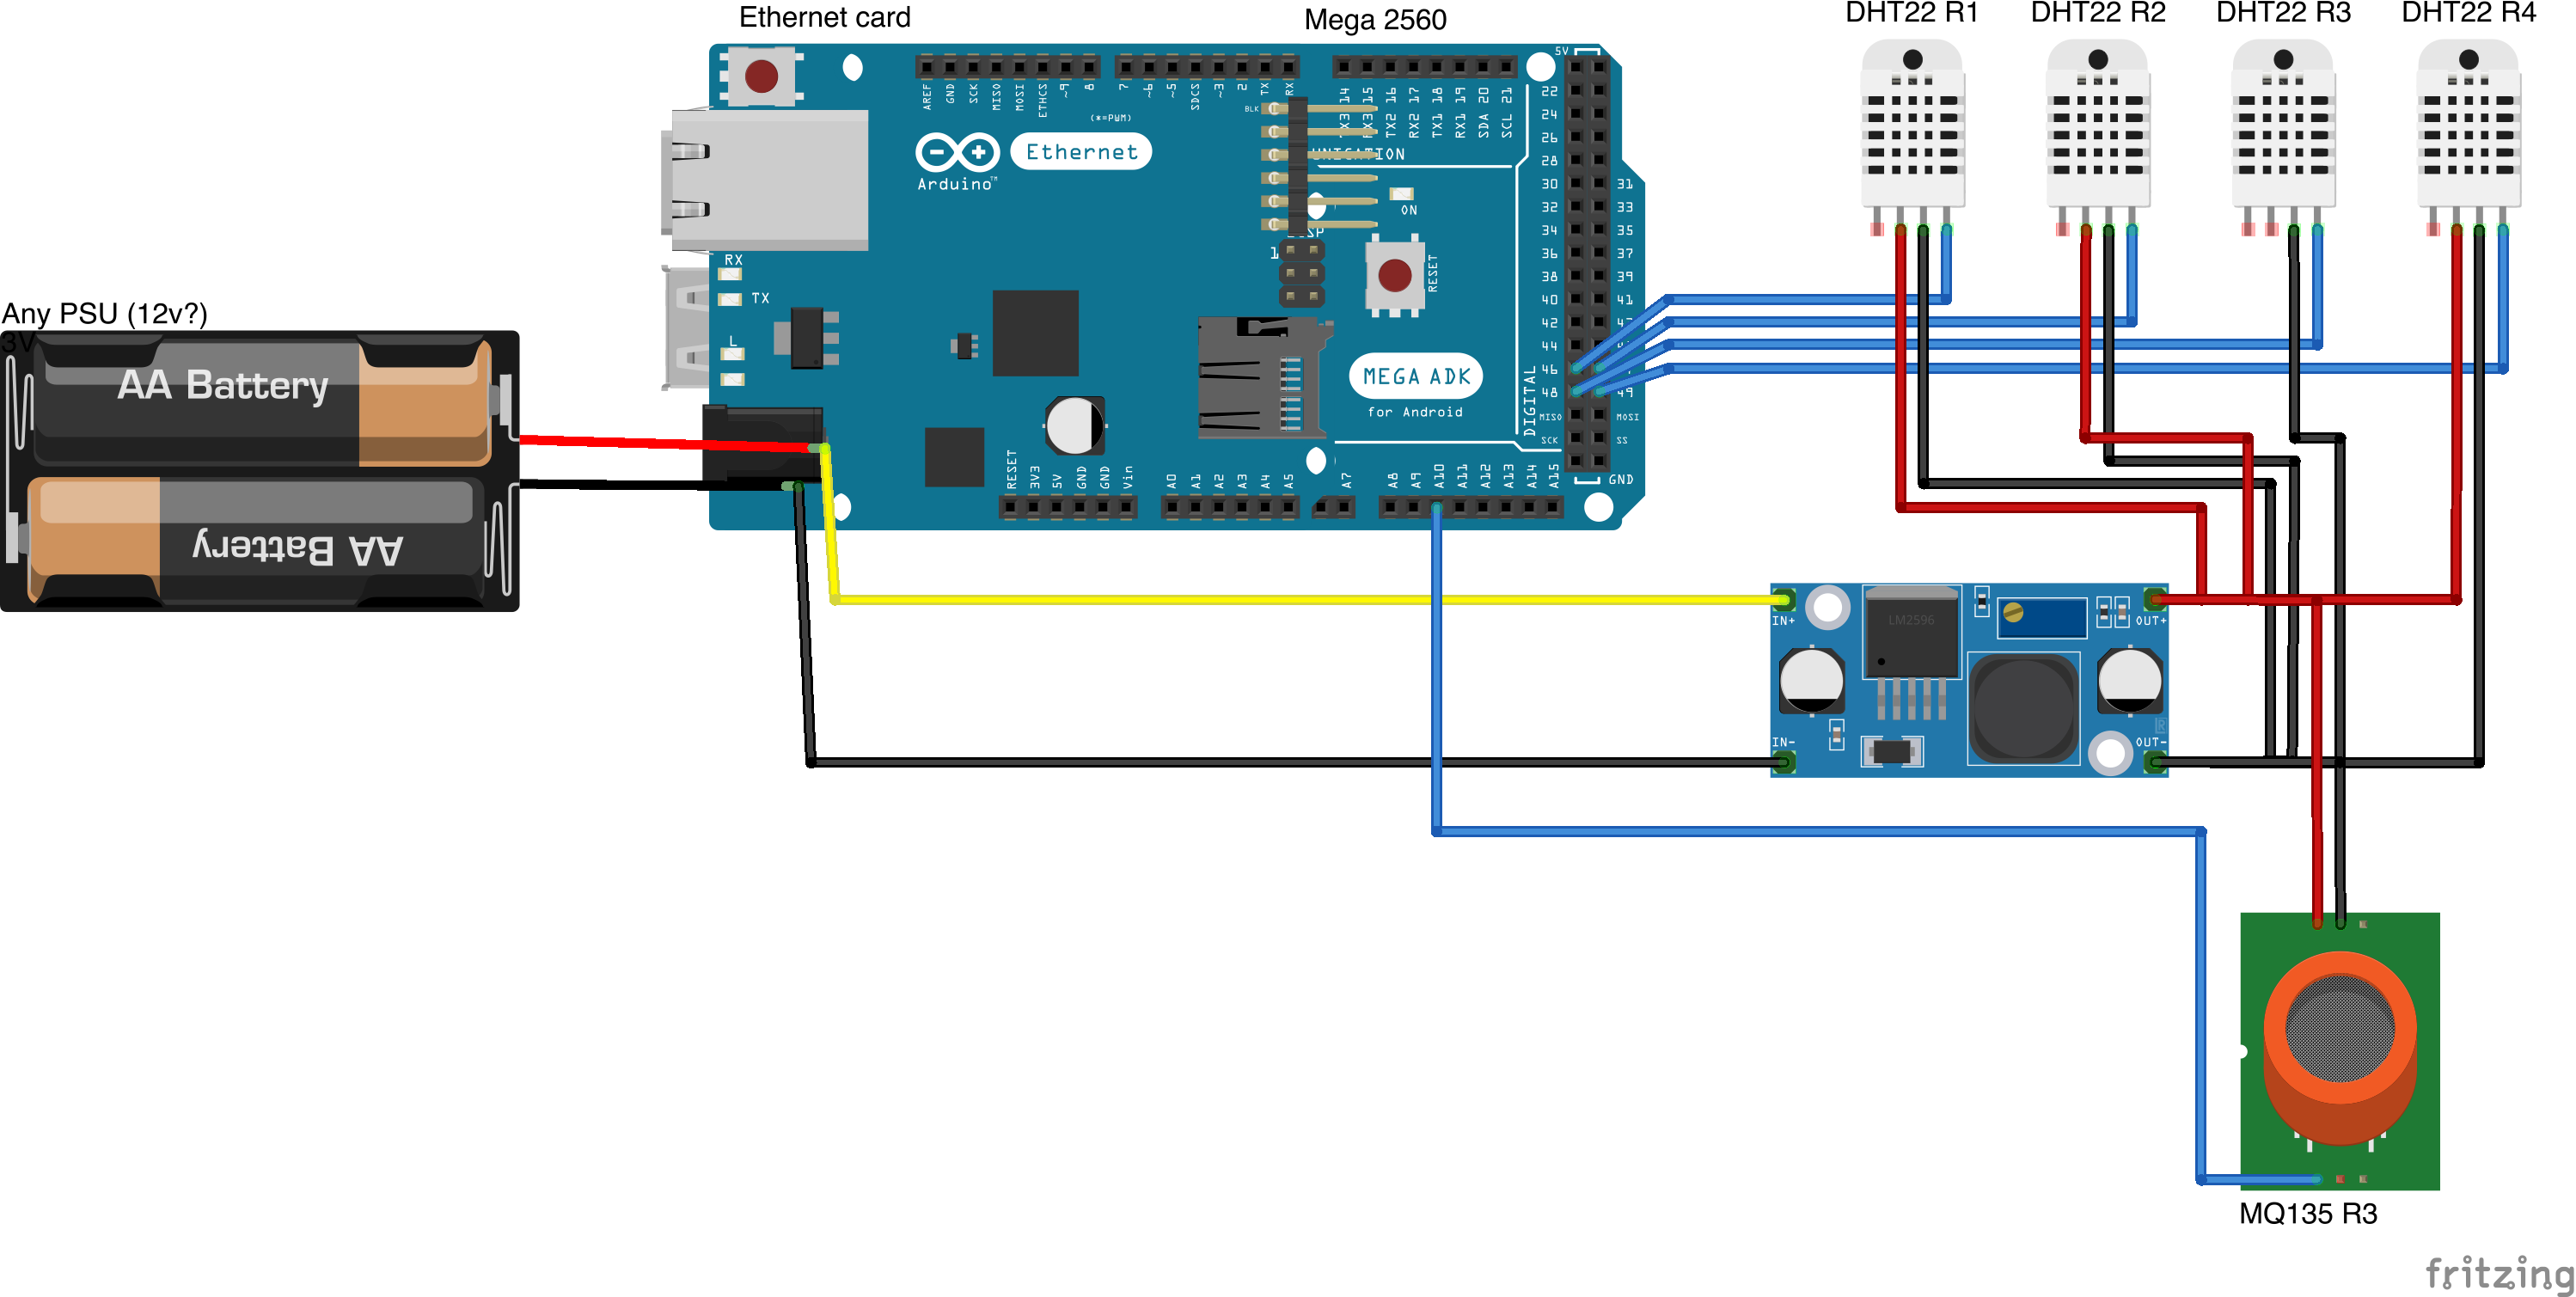
Temperature|humidity sensors labeled as R1, R2, R3, R4 are placed in following way.
R1 - Incoming outside air.
R2 - Outgoing air to rooms.
R3 - Returning air from rooms.
R4 - Waste air outside house.


- I used regular 12v power supply to supply main input power.
- To avoid frying your Arduino regulator, you should use external power regulator like lm2596
to provide 5v out for attached sensors.

Is located at /server folder. It's a simple express backend which takes data and stores it into PostgreSQL database.
Check db schema status
yarn migrate:status
Migrate to latest schema if needed
yarn migrate
Run backend. You should run it with something else like PM2 process manager.
node ilmava.js
For plotting data I used Superset. I run it locally with Docker as their documentation instructs.
Get started with Superset here.
Why Superset?
- It doesn't no longer make sense to create custom plotting front end since Superset just gives you so many possibilities.

is to find out how much heating coil has used kWh's of energy.
500 = coil watt rating.
select
    started::date as date,
    500 * (duration_minutes / 60) / 1000 as used_kwh
from (
         select min("createdAt")                       as started,
                max("createdAt")                       as ended,
                EXTRACT(EPOCH FROM (max("createdAt") - min("createdAt"))::INTERVAL) /
                60                                     as "duration_minutes",
                avg(outgoing_air_to_rooms_temperature) as "avg_temp"
         from measurements
         where outgoing_air_to_rooms_temperature > 21
           and outgoing_air_to_rooms_humidity < 27
         group by "createdAt"::date
     ) as m
Coil is not on the whole time so maybe right value is about 70% of it:
