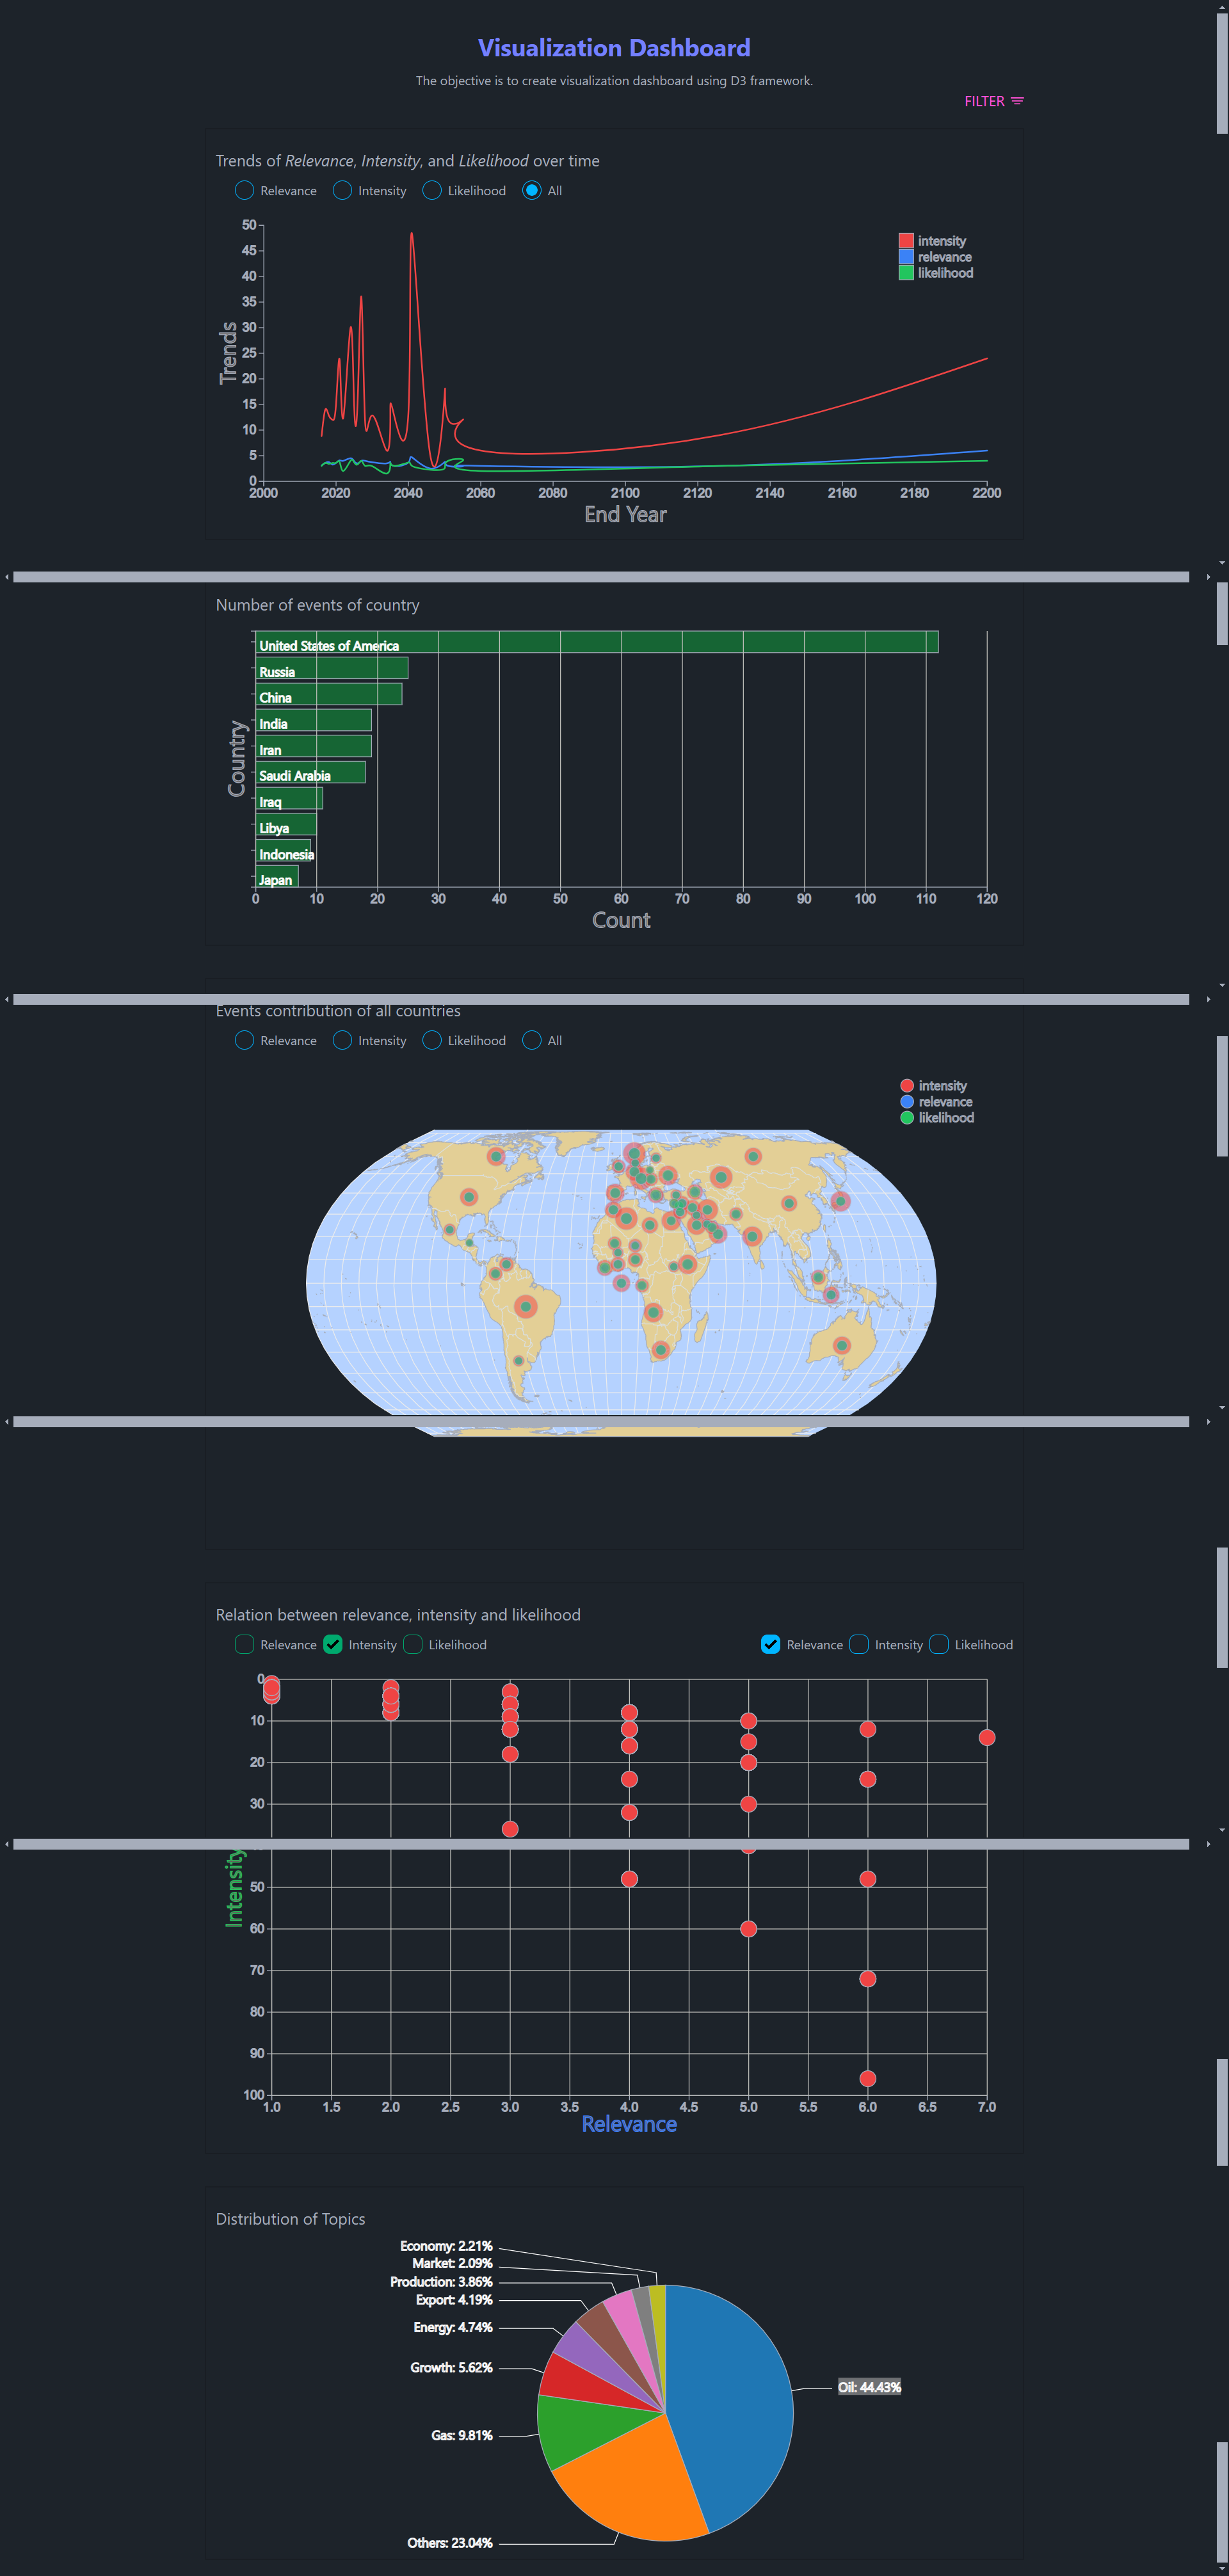
- I am making Visualization dashboard along with d3 framework.
- Mongo db for database
- D3 framework for visualization
- React for frontend
- Made line-chart, bar graph, world map, scatter plot and pie chart to show various relation between data.
Instructions on how to install and set up your project locally.
# Clone the repository
git clone https://github.com/nkp1111/visualization-dashboard.git

# Navigate to the project directory
cd visualization-dashboard

# Install backend dependencies
cd backend
npm install

# Install frontend dependencies
cd ../frontend
npm install

# Run the backend development server
cd ../backend
npm run dev

# Run the frontend development server
cd ../frontend
npm run devvisualization-dashboard/
├── backend/
│ ├── controllers/
│ ├── constant/
│ ├── routes/
│ ├── config/
│ ├── middleware/
│ └── index.js
├── frontend/
│ ├── src/
│ │ ├── components/
│ │ ├── constant/
│ │ ├── services/
│ │ ├── lib/
│ │ ├── main.jsx
│ │ └── App.jsx
│ └── public/
└── README.md
- Backend: mongodb, express, cors, dotenv, http-status-codes
- Frontend: react, d3, tailwind, daisyui, topojson-client, world-countries
- Neeraj Parmar
- GitHub nkp1111
- LinkedIn neeraj
- Twitter @nkp11111507
