A framework for generating statistics, metrics, KPIs, and graphs for Recommender Systems
- Install Conda from here. Tested on conda v 4.10.3.
- Run from terminal:
conda env create -f environment.yml - Run from terminal:
conda activate rsmetrics - Run from terminal:
chmod +x ./preprocessor.py ./preprocessor_common.py ./rsmetrics.py
- Configure
./preprocessor_common.py,./preprocessor.pyand./rsmetrics.pyby editting theconfig.yamlor providing another with-c. - Run from terminal:
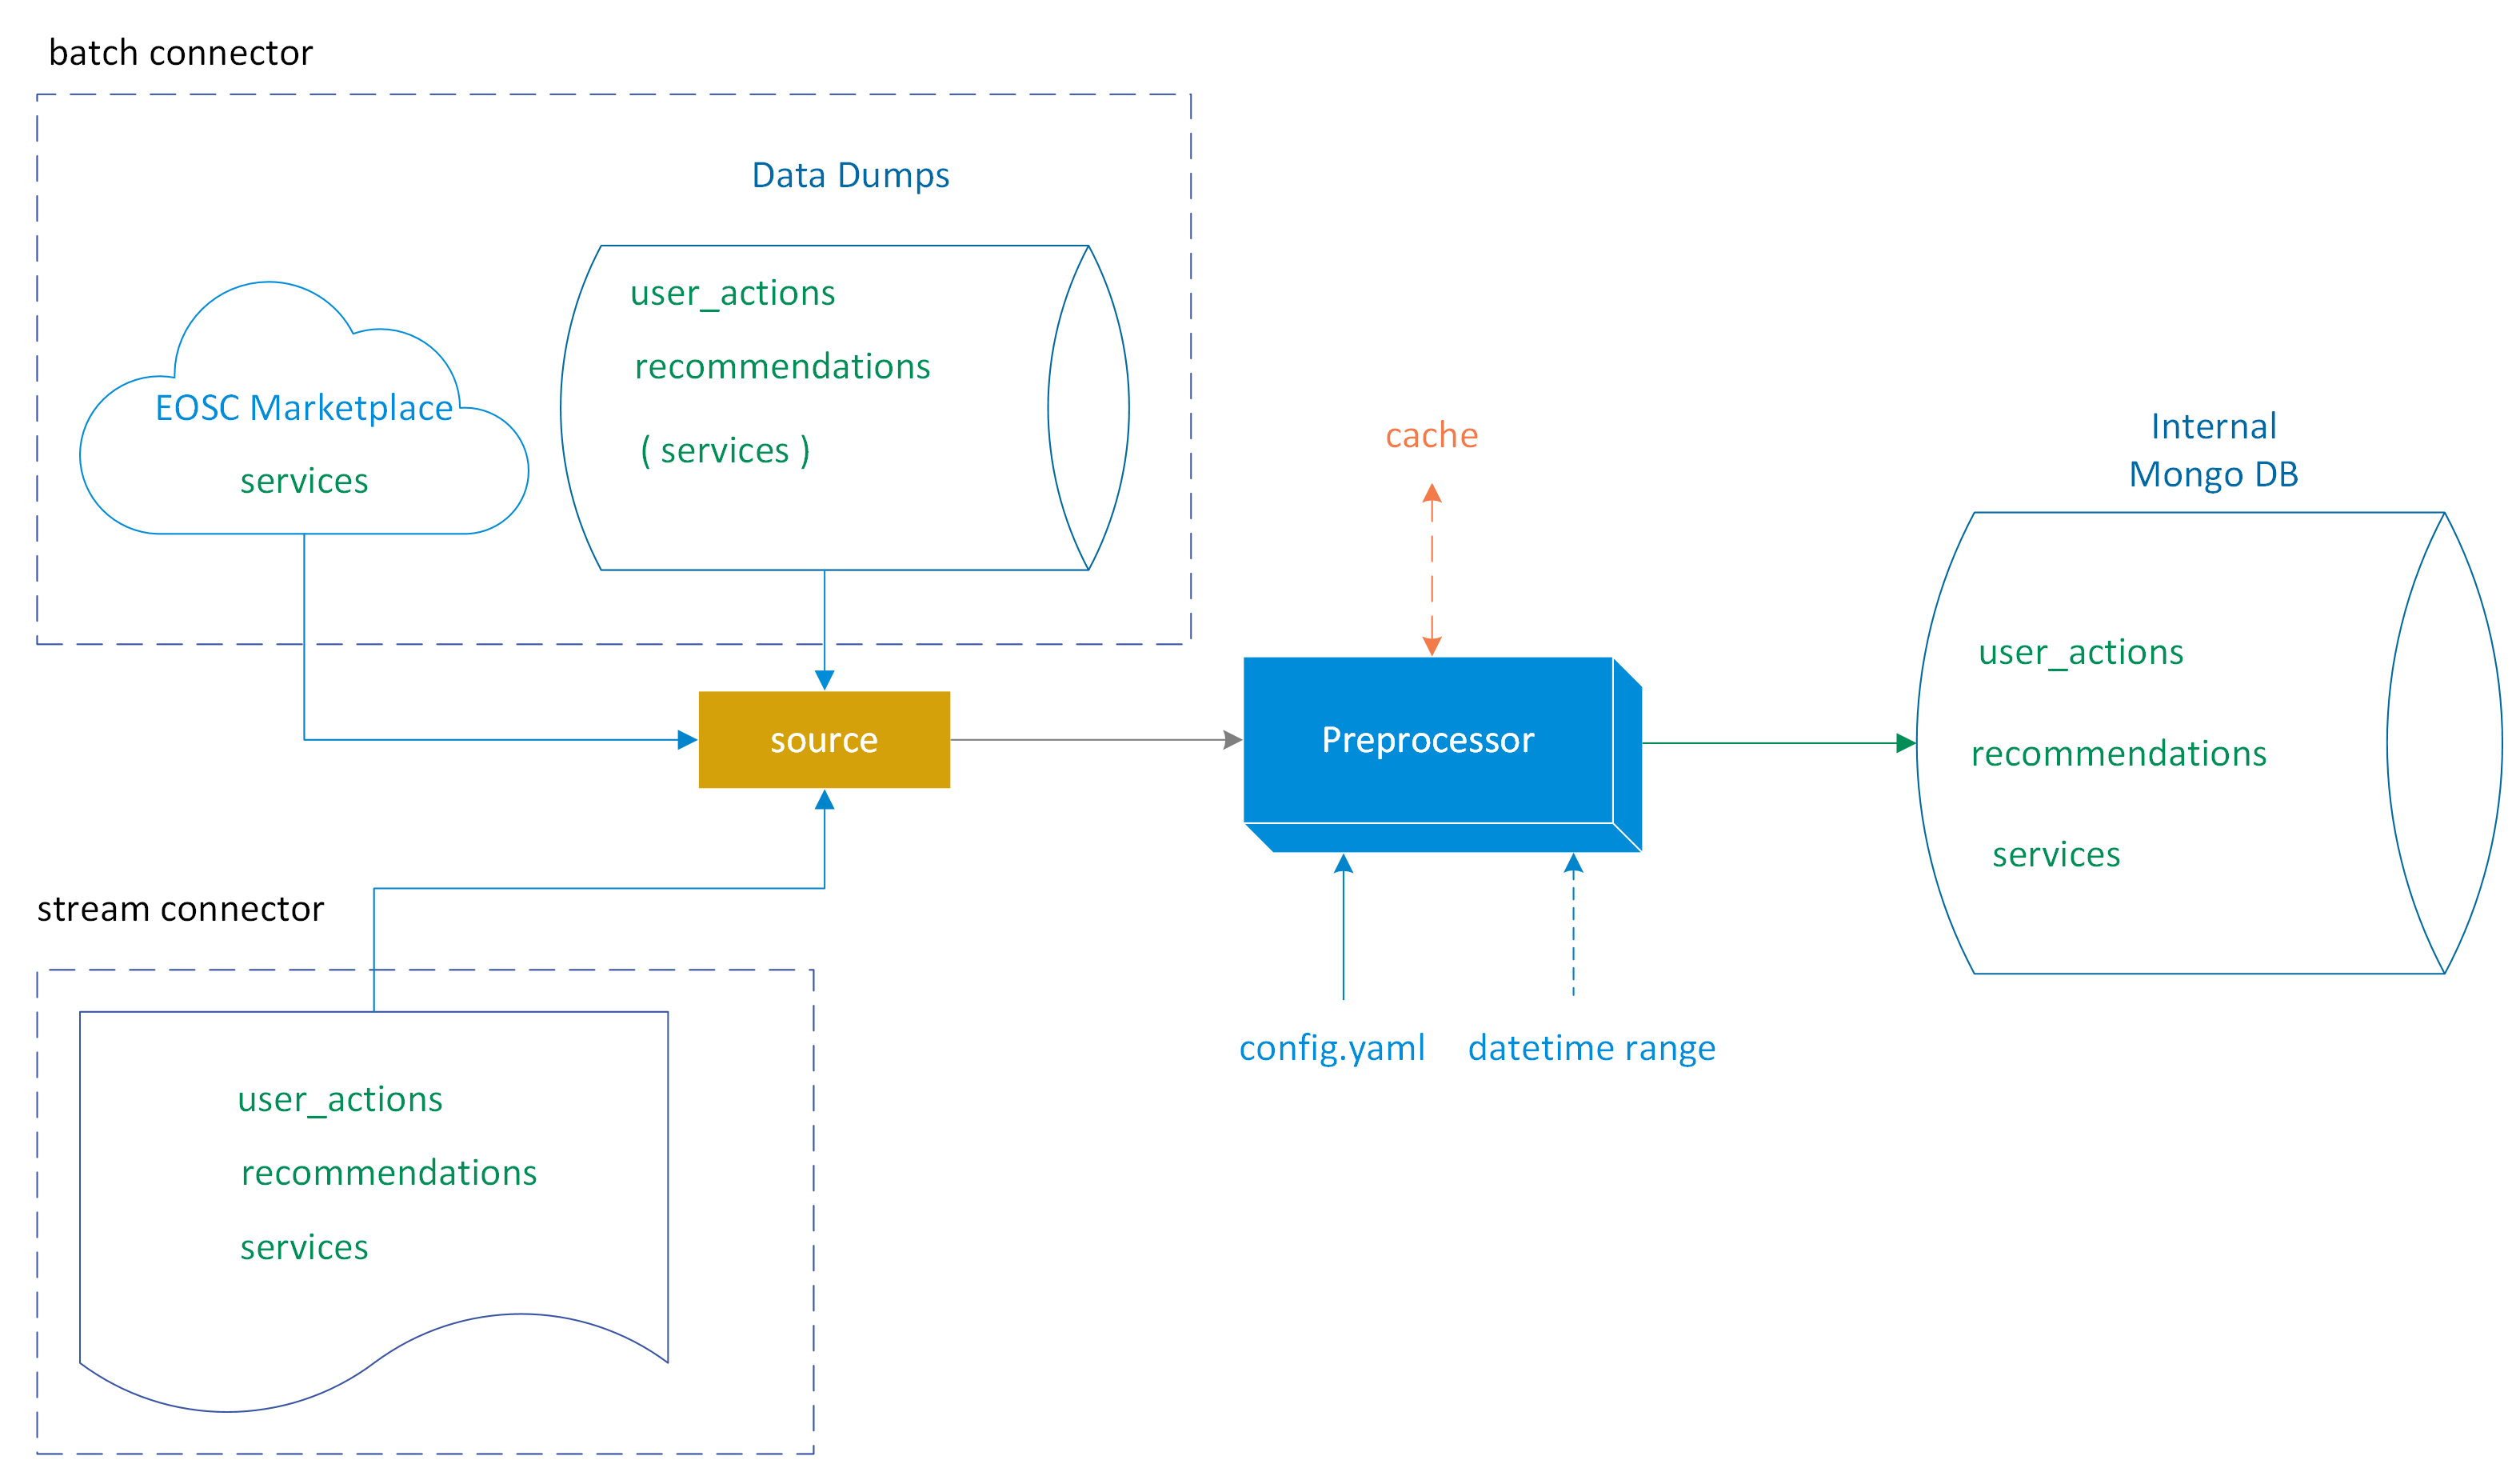
./preprocessor_common.pyin order to gatherusersandresourcesand store them in theDatastore:
./preprocessor_common.py # this will ingest users and resources [from scratch] by retrieving the data from 'marketplace_rs' provider (which is specified in the config file
./preprocessor_common.py -p marketplace_rs # equivalent to first one
./preprocessor_common.py -p marketplace_rs --use-cache # equivalent to first one but use the cache file to read resources instead of downloading them via the EOSC Marketplace
./preprocessor_common.py -p athena # currently is not working since users collection only exist in 'marketplace_rs'- Run from terminal:
./preprocessor.py -p <provider>in order to gatheruser_actionsandrecommendationsfrom the particular provider and store them in theDatastore:
./preprocessor.py # this will ingest user_actions and recommendations [from scratch] by retrieving the data from 'marketplace_rs' provider (which is specified in the config file
./preprocessor.py -p marketplace_rs # equivalent to first one
./preprocessor.py -p athena # same procedure as the first one but for 'athena' provider- Run from terminal:
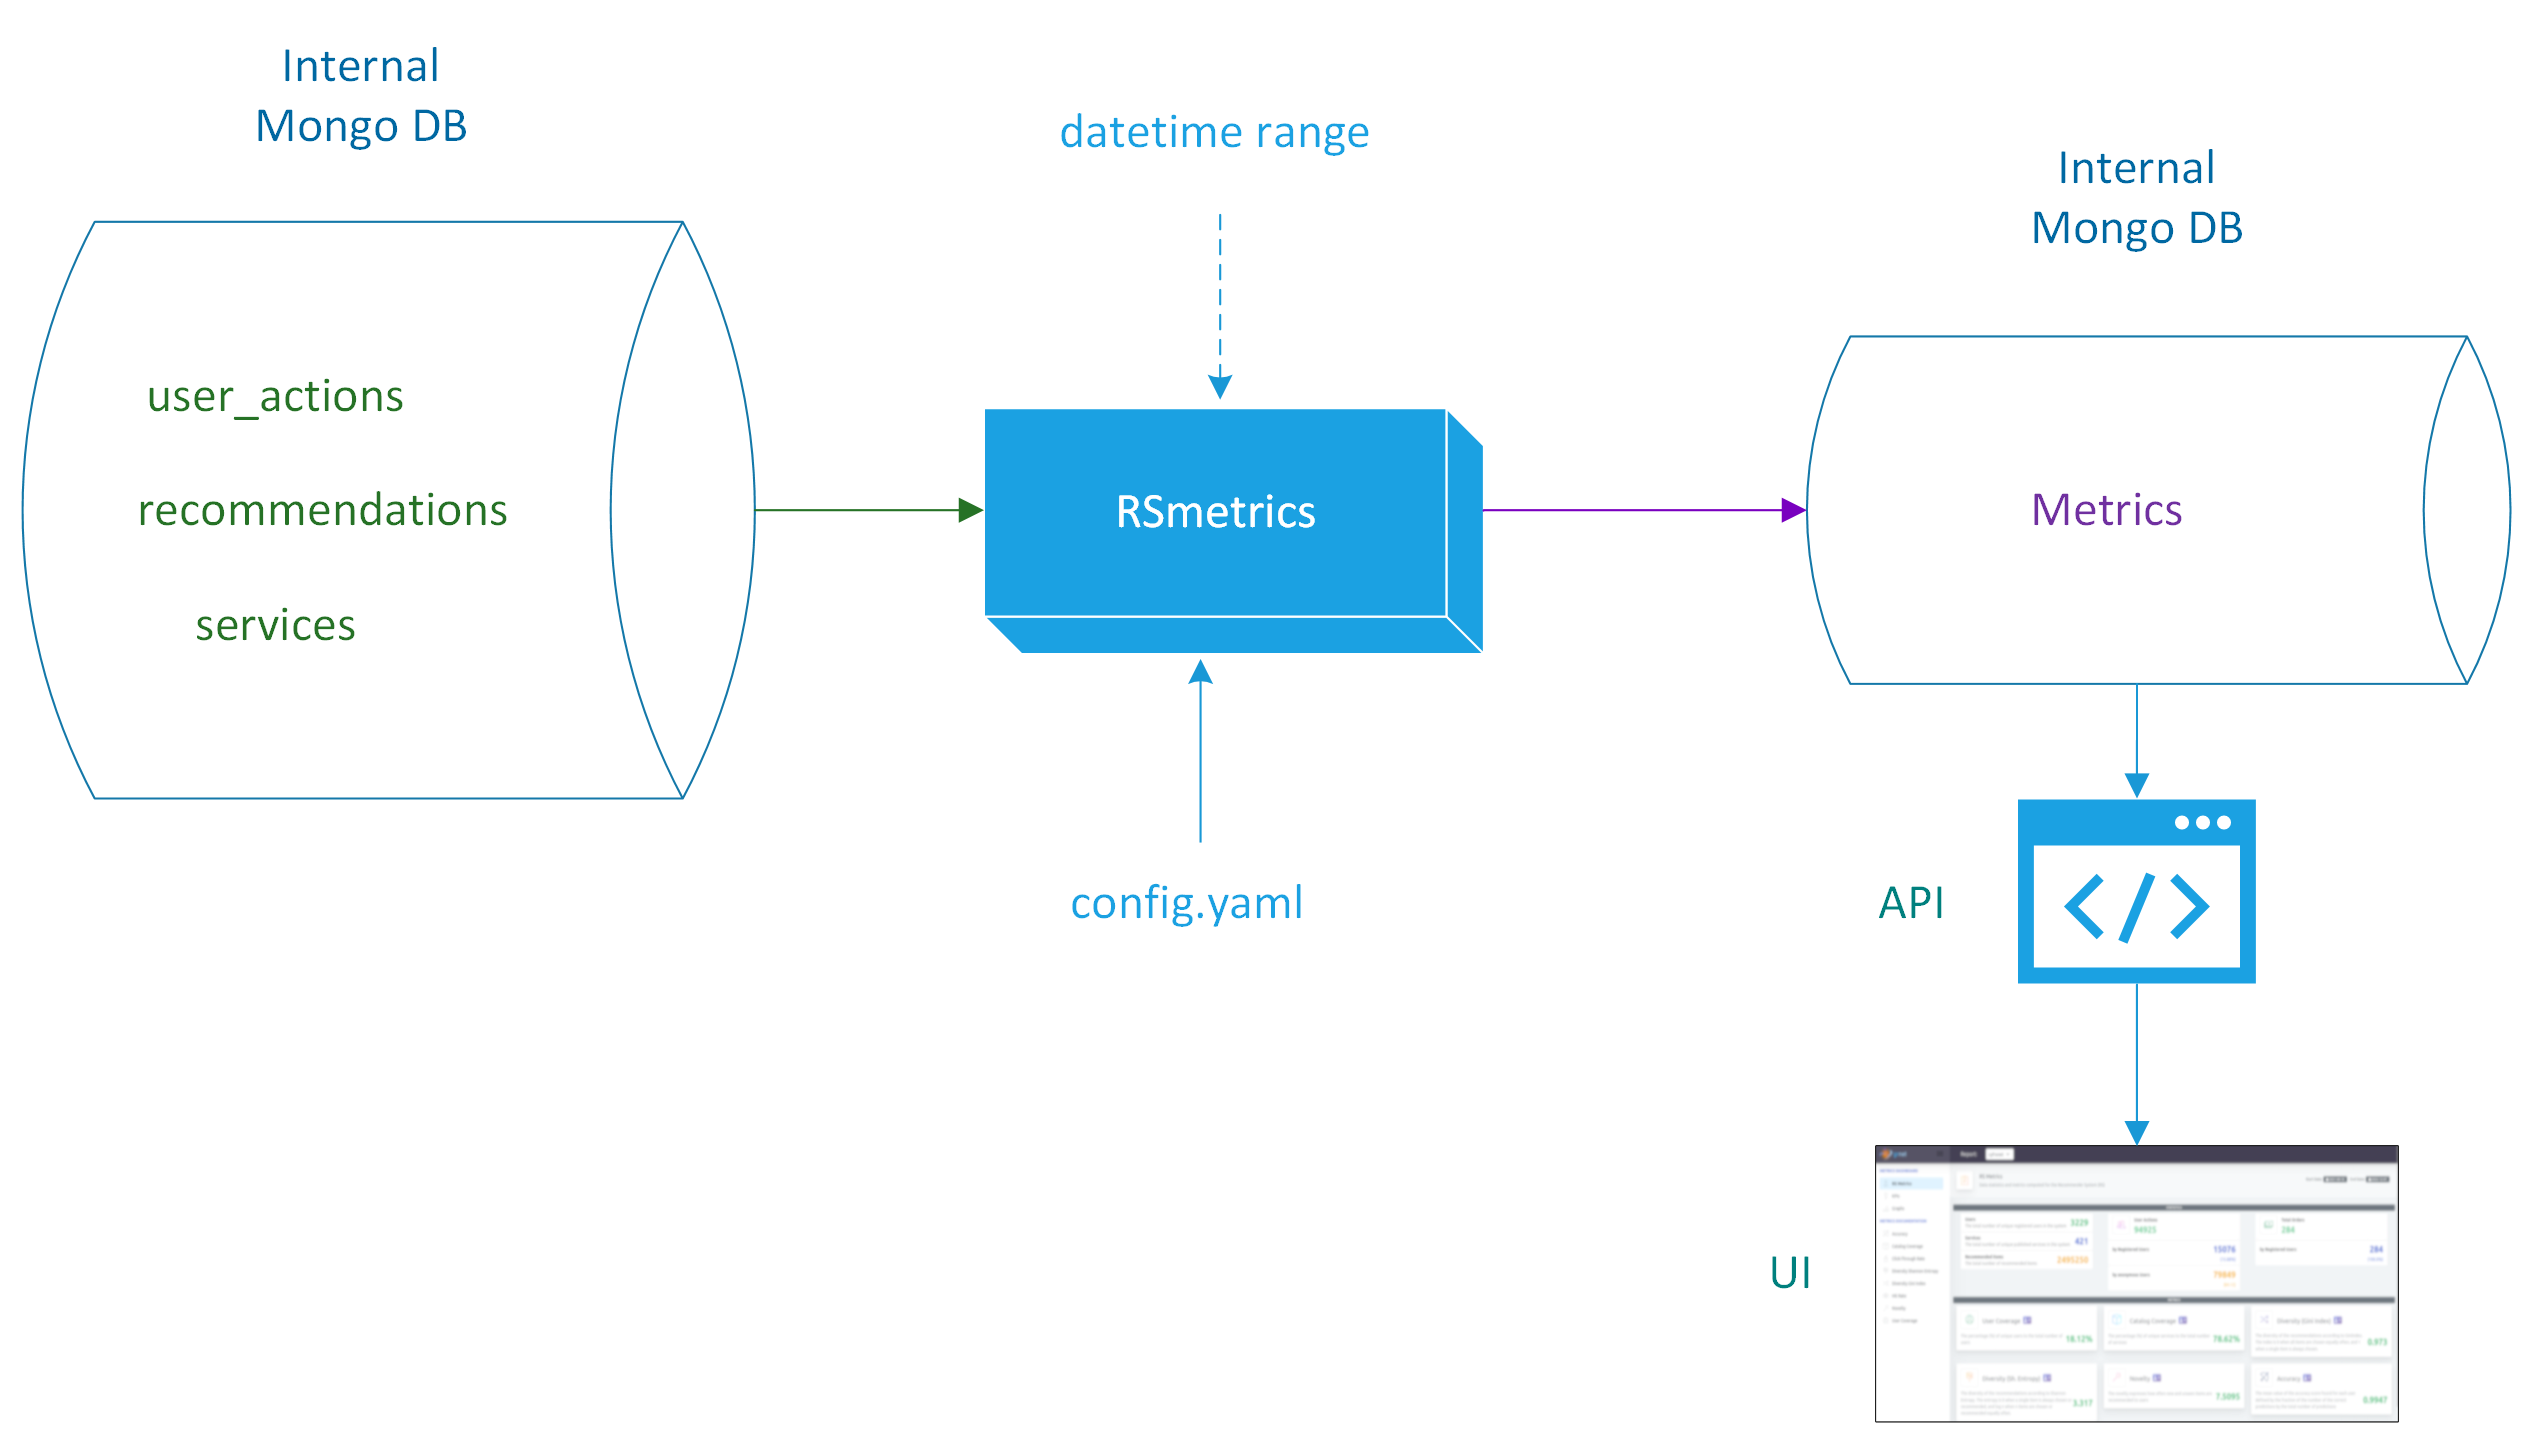
./rsmetrics.py -p <provider>in order to gather the respective data (users,resources,user_actionsandrecommendations), calculatestatisticsandmetricsand store them in theDatastore, concerning that particular provider:
./rsmetrics.py # this will calculate and store statistics and metrics concerning data (users, resources, user_actions and recommendations) concerning the specified provider (which by default is 'marketplace_rs')
./rsmetrics.py -p marketplace_rs # equivalent to first one
./rsmetrics.py -p athena # same procedure as the first one for 'athena' provider- A typical
rsmetrics.pycommand for a monthly report, would be:
./rsmetrics.py -p provider -s $(date +"%Y-%m-01") -e $(date +"%Y-%m-%d") -t "$(date +"%B %Y")"- Run from terminal
./rs-stream.pyin order to listen to the stream for new data, process them, and store them in theDatastore, concerning that particular provider:
./rs-stream.py -a username:password -q host:port -t user_actions -d ""mongodb://localhost:27017/datastore"" -p provider_nameThe reporting script generates an evalutation report in html format automatically served from a spawed localserver default: localhost:8080 and automatically opens the default browser to present the report.
To execute the script issue:
chmod u+X ./report.py
report.py
The script will automatically look for evaulation result files in the default folder ./data and will output the report in the default folder: ./report
The report.py script can be used with the --input parameter: a path to a folder that the results from the evaluation process have been generated (default folder:./data). The report script can also take an --output parameter: a path to an output folder where the generated report will be served automatically.
Note: the script copies to the output folder all the necessary files such as pre_metrics.json, metrics.json as well as report.html.prototype renamed to index.html
usage: report.py [-h] [-i STRING] [-o STRING] [-a STRING] [-p STRING]

Generate report

optional arguments:
  -h, --help            show this help message and exit
  -i STRING, --input STRING
                        Input folder
  -o STRING, --output STRING
                        Output report folder
  -a STRING, --address STRING
                        Address to bind and serve the report
  -p STRING, --port STRING
                        Port to bind and serve the report
This script contacts EOSC Marketplace remote service api and generates a csv with a list of all available items of a specific catalog (e.g. services, datasets, trainings, publications, data_sources, ), their name, id and url
To execute the script issue:
chmod u+x ./get_catalog.py
./get_catalog.py -u https://remote.example.foo -c service -b 100 -l 2000 -o `my-catalog.csv`
Arguments:
-uor-url: the endpoint url of the marketplace search service-oor--output: this is the output csv file (e.g../service_catalog.csvor./training_catalog.csv) - optional-bor--batch: because search service returns results with pagination this configures the batch for each retrieval (number of items per request) - optional-lor--limit: (optional) the user can specify a limit of max items to be retrieves (this is handy for large catalogs if you want to receive a subset) - optional-cor--category: the category of list of items you want to retrieve-dor--datastore: mongodb destination database uri to store the results into (e.g.mongodb://localhost:27017/rsmetrics) - optional-por--providers: state in a comma-separated list wich providers (engines) handle the items of the specific category currently supported category types for marketplace:servicetrainingdataset(this is for items of theDATAcatalog)data_source(this is for items of theDATASOURCEScatalog)publicationguideline(this is for items of theINTEROPERABILITY GUIDELINEScatalog)softwarebundleother
The webservice folder hosts a simple webservice implemented in Flask framework which can be used to host the report results.
Note: Please make sure you work in a virtual environment and you have already downloaded the required dependencies by issuing
pip install -r requirements.txt
The webservice application serves two endpoints
/: This is the frontend webpage that displays the Report Results in a UI/api: This api call returns the evaluation metrics in json format
To run the webservice issue:
cd ./webservice
flask run
The webservice by default runs in localhost:5000 you can override this by issuing for example:
flask run -h 127.0.0.1 -p 8080
There is an env variable RS_EVAL_METRIC_SOURCE which directs the webservice to the generated metrics.json file produced after the evaluation process.
This by default honors this repo's folder structure and directs to the root /data/metrics.json path
You can override this by editing the .env file inside the /webservice folder, or specificy the RS_EVAL_METRIC_SOURCE variable accordingly before executing the flask run command
Tested with python 3.9
A typical example that counts the documents found in user_actions, recommendations, and resources for 1 day ago would be:
./monitor.py -d "mongodb://localhost:27017/rsmetrics" -s "$(date -u -d '1 day ago' '+%Y-%m-%d')" -e "$(date -u '+%Y-%m-%d')"E-mail send over SMTP for the above example:
./monitor.py -d "mongodb://localhost:27017/rsmetrics" -s "$(date -u -d '1 day ago' '+%Y-%m-%d')" -e "$(date -u '+%Y-%m-%d')" --email "smtp://server:port" sender@domain recipient1@domain recipient2@domain
A typical example that counts the documents found in user_actions, recommendations, and resources for 1 year ago would be:
./monitor.py -d "mongodb://localhost:27017/rsmetrics" -s "$(date -u -d '1 day ago' '+%Y-%m-%d')" -e "$(date -u '+%Y-%m-%d')" --capacitywhich will return results in CSV format of year,month,user_actions,recommendations
Additionally, capacity can be plotted:
./monitor.py -d "mongodb://localhost:27017/rsmetrics" -s "$(date -u -d '1 day ago' '+%Y-%m-%d')" -e "$(date -u '+%Y-%m-%d')" --capacity --plotInstallation and configuration documents can be found here.


