News • Features • QuickStart • Cases • Community • Contributors
🧗 Database administrators (DBAs) play a crucial role in managing, maintaining and optimizing a database system to ensure data availability, performance, and reliability. However, it is hard and tedious for DBAs to manage a large number of database instances. Thus, we propose DBAgent, a LLM-based database administrator that can acquire database maintenance experience from textual sources, and provide reasonable, well-founded, in-time diagnosis and optimization advice for target databases.
-
[2023/8/22] Support tool retrieval for 60+ APIs.
-
[2023/8/16] Support multi-level optimization functions.
-
[2023/8/15] Initialize solid response mechanism.
-
[2023/8/10] Our vision paper is released (中文解读).
-
Well-Founded Diagnosis: DBAgent can provide founded diagnosis by utilizing relevant database knowledge (with document2experience).
-
Practical Tool Utilization: DBAgent can utilize both monitoring and optimization tools to improve the maintenance capability (with tool learning and tree of thought).
-
In-depth Reasoning: Compared with vanilla LLMs, DBAgent will achieve competitive reasoning capability to analyze root causes (with multi-llm communications).
A demo of using DBAgent
db_diag.mp4
Current version is developed from agentverse and bmtools, to which we previously contributed.
-
PostgreSQL v12 or higher
Add database settings into config.ini and rename into my_config.ini:
[postgresql]
host = xxx.xxx.xxx.xxx
port = 5432
user = xxx
password = xxx
dbname = postgres
Additionally, install extensions like pg_stat_statements (track slow queries), pg_hint_plan (optimize physical operators), and hypopg (create hypothetical Indexes).
-
Prometheus and Grafana (tutorial)
Step1: Install python packages.
pip install -r requirements.txtStep2: Configure environment variables.
- Export your OpenAI API key
# Export your OpenAI API key
export OPENAI_API_KEY="your_api_key_here"- If accessing openai service via vpn, execute this command:
export https_proxy=http://127.0.0.1:7890 http_proxy=http://127.0.0.1:7890 all_proxy=socks5://127.0.0.1:7890Within the anomaly_scripts directory, we offer scripts that could incur typical anomalies, e.g.,
(1) ./run_benchmark_tpcc.sh or ./run_db_exception.sh
Example Anomalies: INSERT_LARGE_DATA, IO_CONTENTION
(2) ./run_benchmark_job.sh
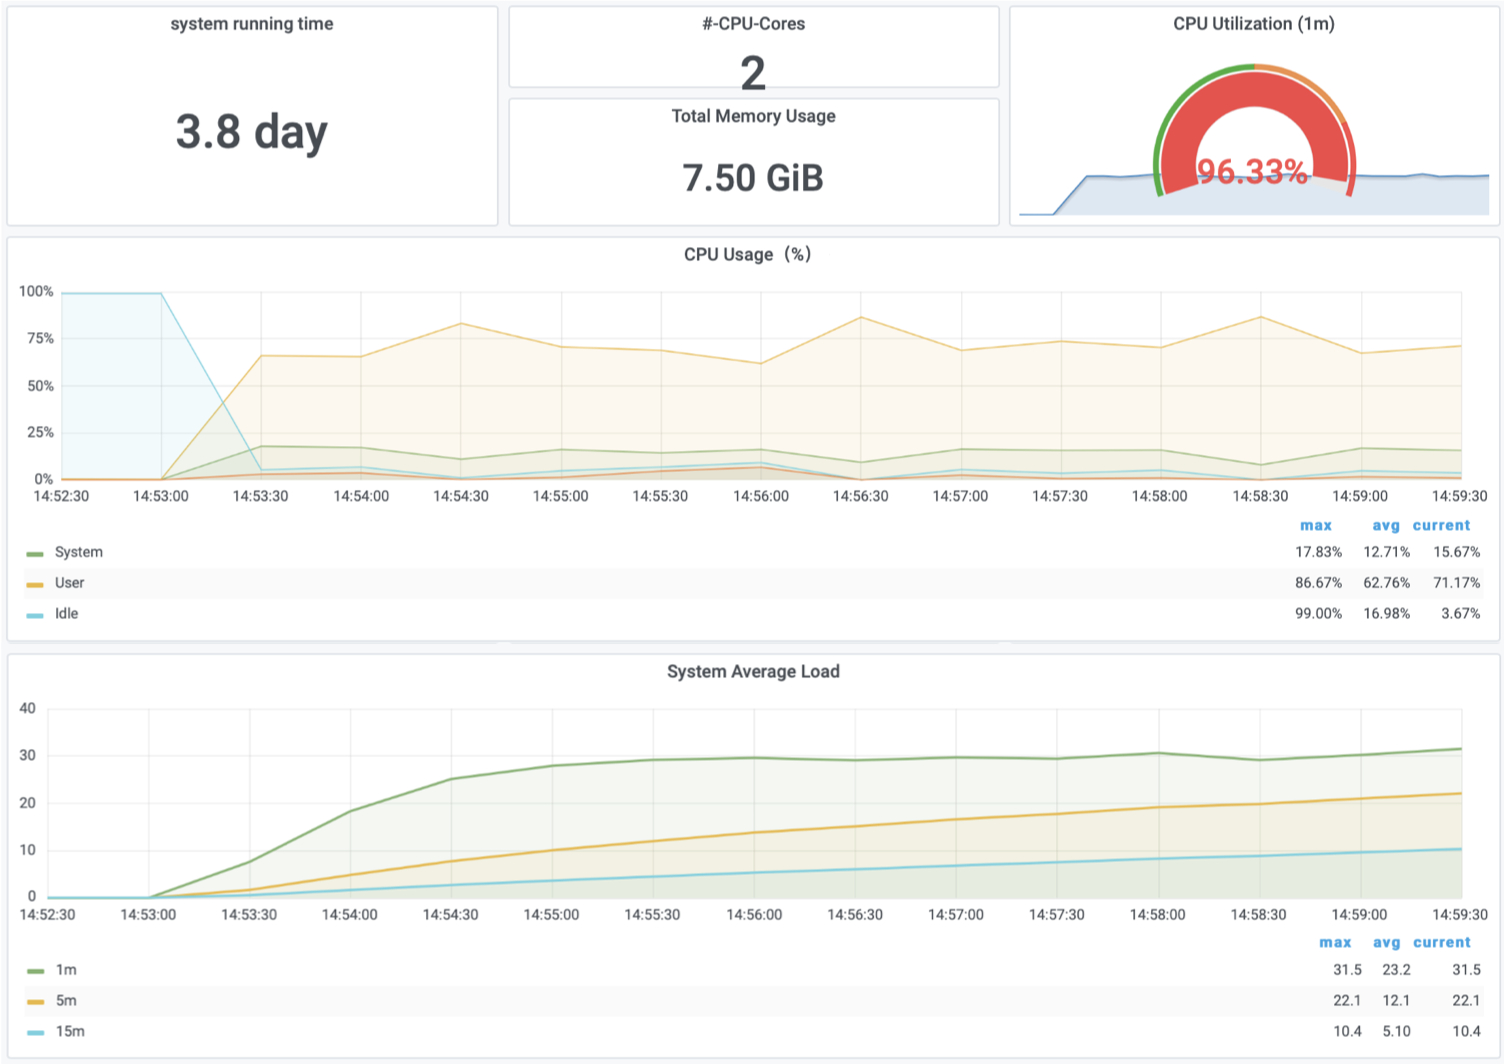
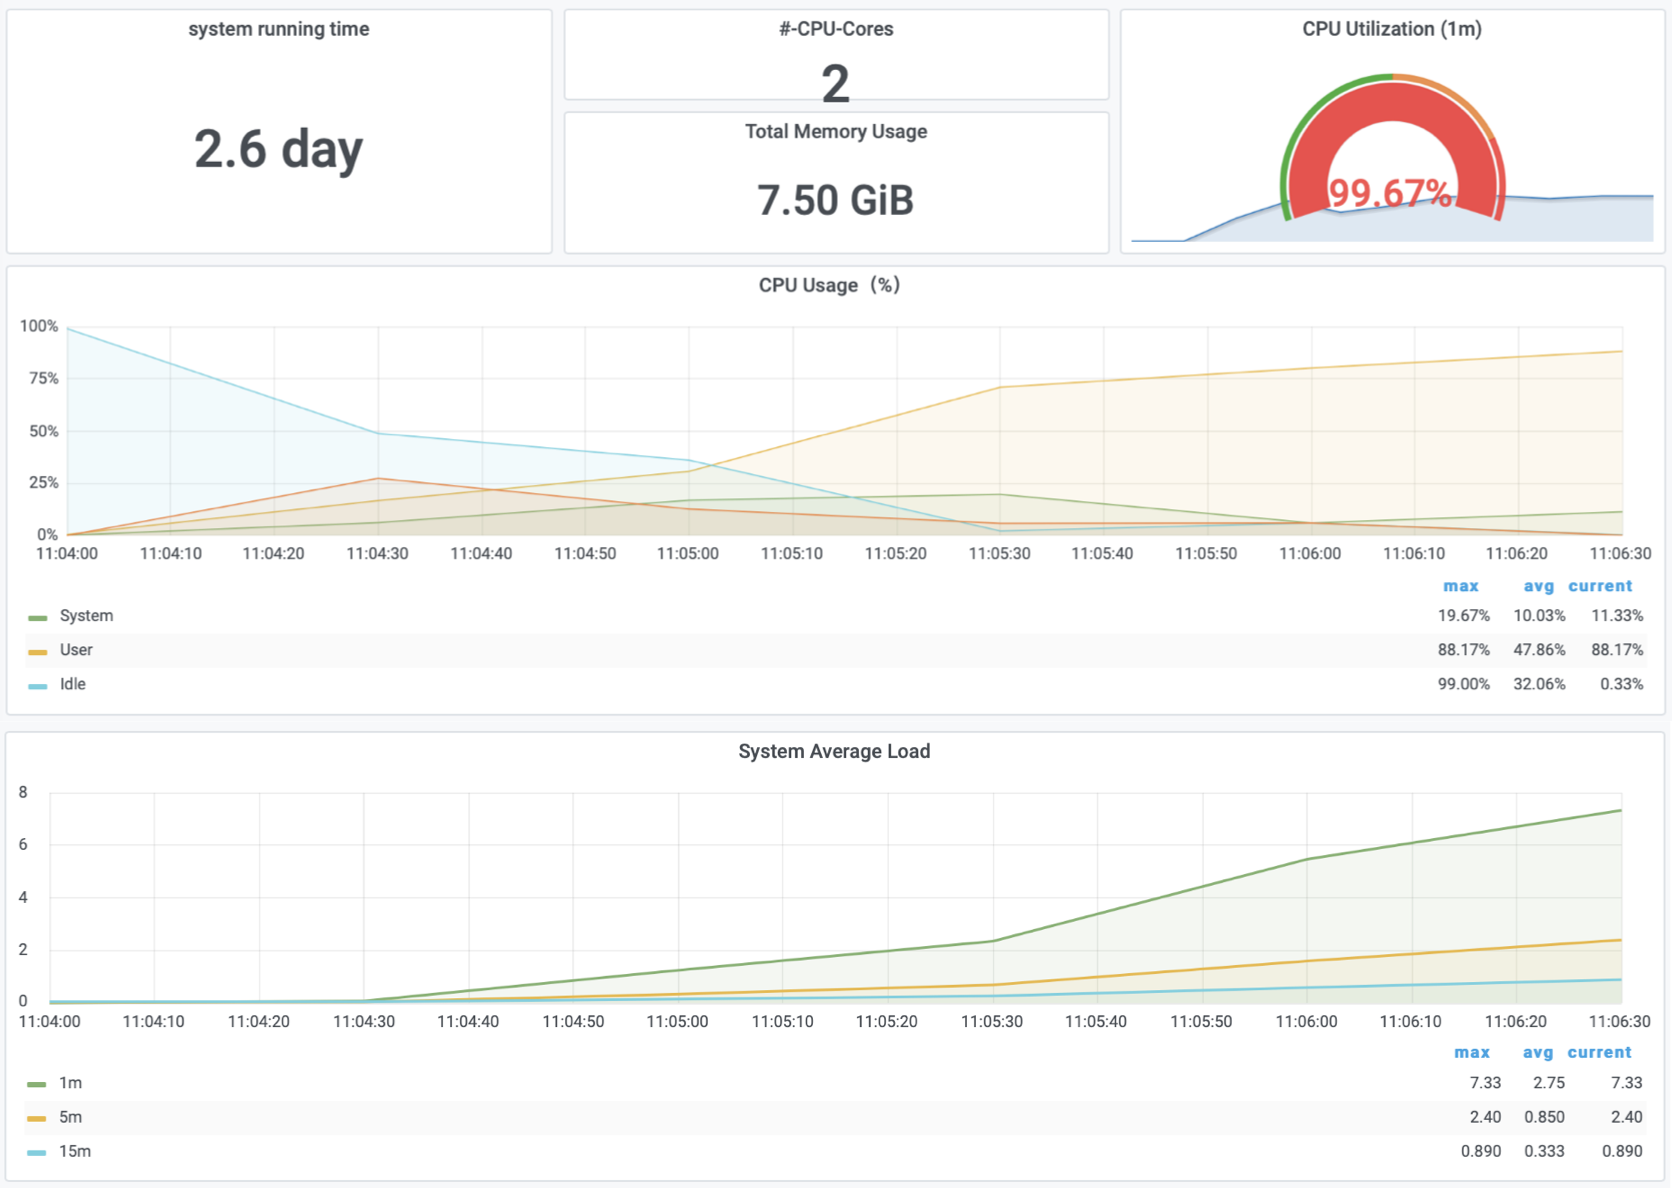
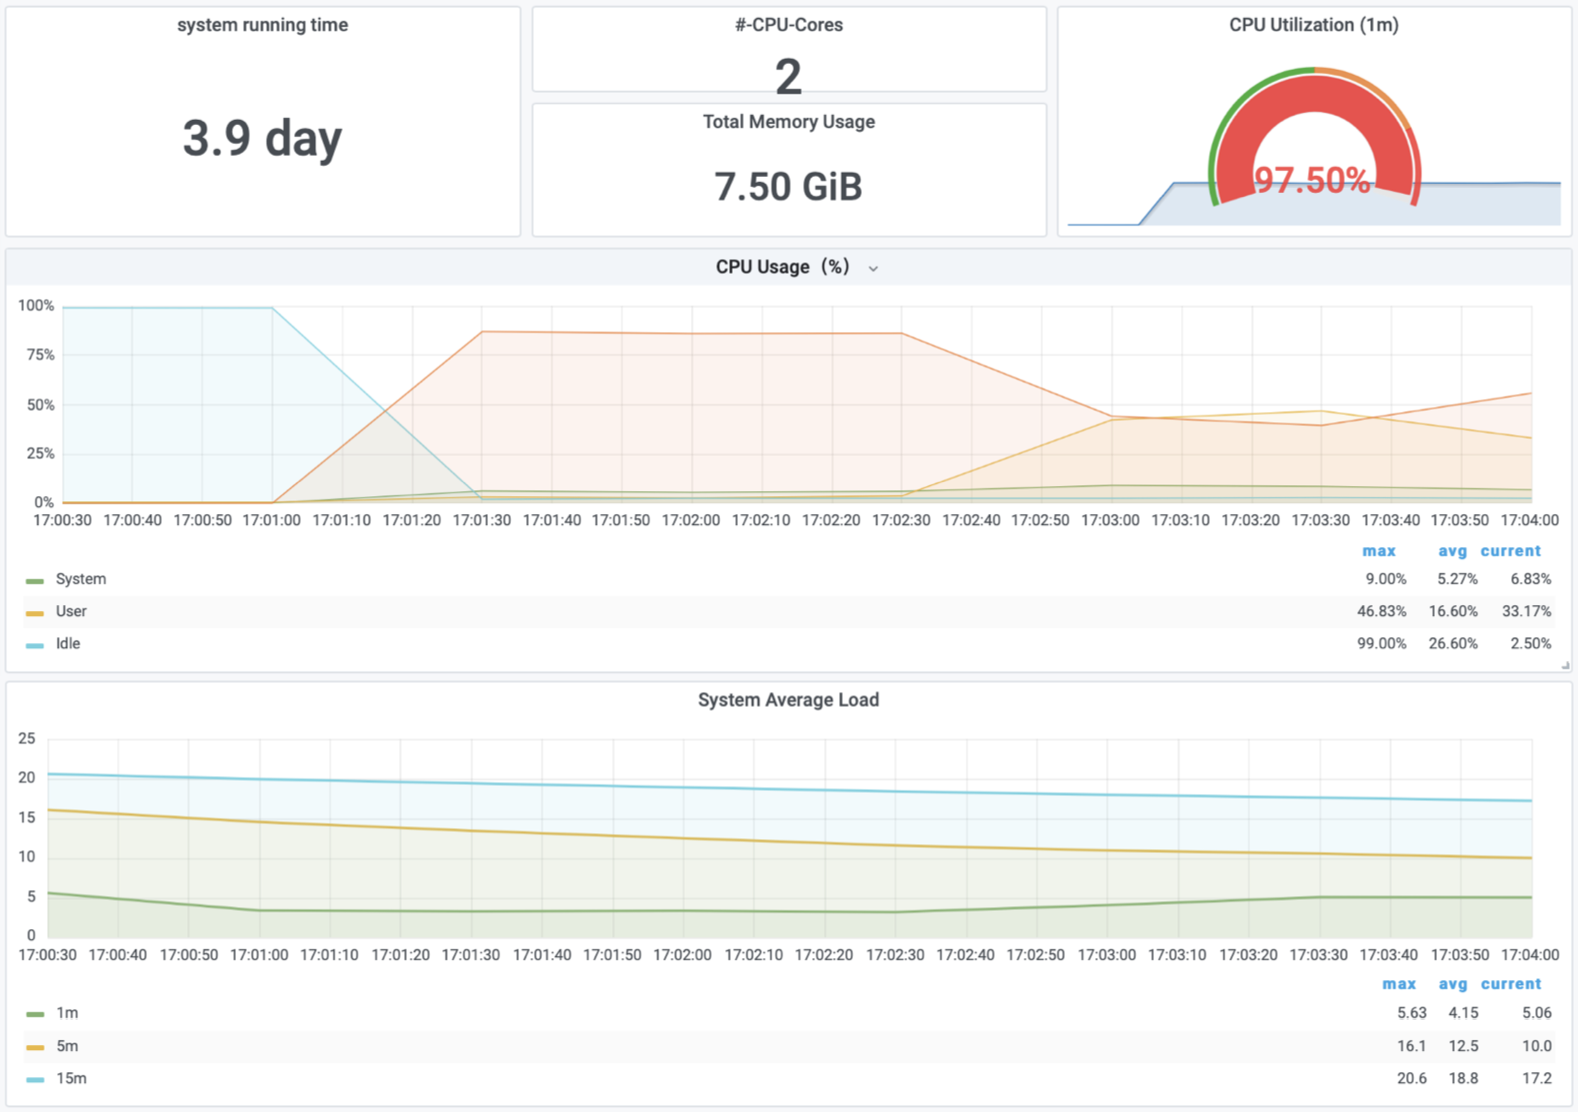
Example Anomalies: POOR_JOIN_PERFORMANCE, CPU_CONTENTION
(3) ./run_benchmark_tpch.sh
Example Anomalies: FETCH_LARGE_DATA (lineitem with 28GB); CORRELATED_SUBQUERY
Start bmtools service (kept alive for diagnosis and tree of thought).
cd tool_learning
python host_local_tools.py
python main.py --task db_diagWe also provide a local website demo for this environment. You can launch it with
python main_demo.py --task db_diagAfter successfully launching the local server, you can visit http://127.0.0.1:7860/ to trigger the diagnosis procedure (click the Start Autoplay button).
-
Extract knowledge from both code (./knowledge_json/knowledge_from_code) and documents (./knowledge_json/knowledge_from_document).
- Add code blocks into diagnosis_code.txt file -> Rerun the extract_knowledge.py script -> Check the update results and sync to root_causes_dbmind.jsonl.
-
Tool APIs (for optimization)
Module Functions index_selection (equipped) heuristic algorithm query_rewrite (equipped) 45 rules physical_hint (equipped) 15 parameters For functions within [query_rewrite, physical_hint], you can use api_test.py script to verify the effectiveness.
If the function actually works, append it to api.py.
-
Tool Usage Algorithm (tree of thought)
cd tool_learning/tree_of_thought
python test_database.py
History messages may take up many tokens, and so carefully decide the turn number.
Derive high-quality prompt templates from a small number of collected samples (splitting into training and evaluation sets), e.g.,
- Prompts for index tuning optimization
cd prompt_template_scripts/index_tuning
./run.sh- Prompts for query rewrite optimization
cd prompt_template_scripts/query_rewrite
./run.sh
python ./response_formalize_scripts/combine_similar_answer.py # test Before Cleaning
[Chief DBA]: The identified root causes of the anomaly are high CPU usage due to the high number of running processes and high load averages, slow queries, and high memory usage due to complex queries, insufficient memory allocation, and the possibility of disk spill.
Optimize the slow queries by analyzing their execution plans, identifying any missing indexes, and tuning the queries accordingly
Polisih the slow queries by checking their execution plans, identifying any missing indexes, and tuning the queries accordingly
Monitor and manage the number of running processes on the node, ensuring that it remains within acceptable limits
Investigate and address any system or infrastructure issues that may be contributing to the high load averages
Consider scaling up or adding more resources to the system if the current CPU usage is consistently high and impacting performance
Add the recommended indexes: ['movie_info#movie_id', 'movie_companies#movie_id', 'keyword#keyword', 'aka_name#person_id'] to reduce cost
Further investigate and optimize the slow queries for better memory utilization
Monitor and adjust the memory allocation parameters like 'work_mem' and 'shared_buffers' to optimize memory usage
Analyze the query plans and consider adjustments to parameters like 'work_mem' and 'shared_buffers' to help reduce or eliminate disk spilling
After Cleaning
[Chief DBA]: The identified root causes of the anomaly are high CPU usage due to the high number of running processes and high load averages, slow queries, and high memory usage due to complex queries, insufficient memory allocation, and the possibility of disk spill.
Polisih the slow queries by checking their execution plans, identifying any missing indexes, and tuning the queries accordingly.
Monitor and manage the number of running processes on the node, ensuring that it remains within acceptable limits.
Add the recommended indexes: ['movie_info#movie_id', 'movie_companies#movie_id', 'keyword#keyword', 'aka_name#person_id'] to reduce cost.
MISSING_INDEXES → INDEX_SELECTION
Note optimize_index_selection takes minutes to explore beneficial index combinations.
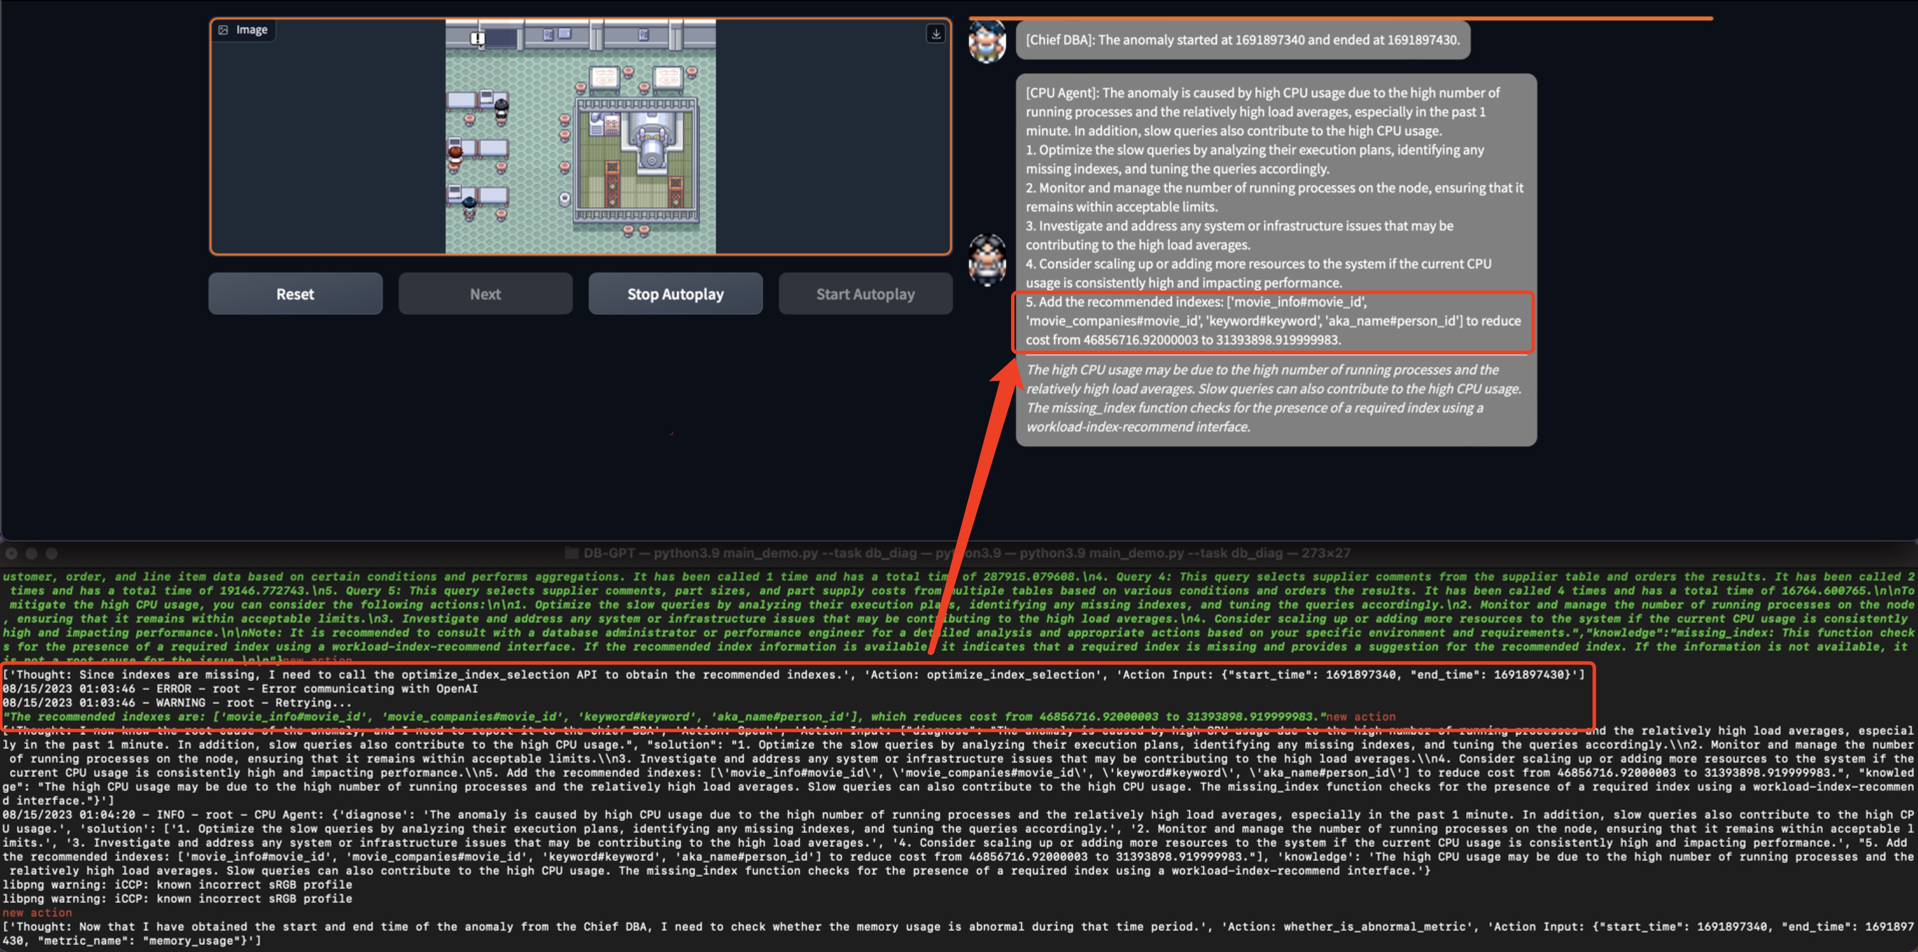
[Chief DBA]: The anomaly started at 1691897340 and ended at 1691897430.

[CPU Agent]: The anomaly is caused by high CPU usage due to the high number of running processes and the relatively high load averages, especially in the past 1 minute. In addition, slow queries also contribute to the high CPU usage.
1. Optimize the slow queries by analyzing their execution plans, identifying any missing indexes, and tuning the queries accordingly.
2. Monitor and manage the number of running processes on the node, ensuring that it remains within acceptable limits.
3. Investigate and address any system or infrastructure issues that may be contributing to the high load averages.
4. Consider scaling up or adding more resources to the system if the current CPU usage is consistently high and impacting performance.
5. Add the recommended indexes: ['movie_info#movie_id', 'movie_companies#movie_id', 'keyword#keyword', 'aka_name#person_id'] to reduce cost from 46856716.92000003 to 31393898.919999983.
----------------------------
(matched knowledge) The high CPU usage may be due to the high number of running processes and the relatively high load averages. Slow queries can also contribute to the high CPU usage. The missing_index function checks for the presence of a required index using a workload-index-recommend interface.

[Memory Agent]: The potential causes of high memory usage could be complex queries, insufficient memory allocation, and possibility of disk spill. The slow queries mentioned involve complex operations such as filtering, grouping, and joining multiple tables, which can consume a significant amount of memory, especially if they involve large data sets. The abnormal memory metric values suggest that the available memory might be insufficient to handle the workload. Adjusting parameters like 'work_mem' and 'shared_buffers' might help alleviate memory issues. The complexity and size of the slow queries could potentially lead to disk spill during execution, which can significantly impact performance.
1. Further investigate and optimize the slow queries mentioned above for better memory utilization.
2. Monitor and adjust the memory allocation parameters like 'work_mem' and 'shared_buffers' to optimize memory usage.
3. Analyze the query plans and consider adjustments to parameters like 'work_mem' and 'shared_buffers' to help reduce or eliminate disk spilling.
----------------------------
(matched knowledge) Disk spill is a function that checks whether there is a possibility of disk spill during the execution of SQL. If the plan parse information is not available, it checks whether the sort spill count or hash spill count exceeds the sort rate threshold. If the plan parse information is available, it calculates the total cost of the plan and checks whether the cost rate of the sort or hash operators exceeds the cost rate threshold. If abnormal operator details are found and the sort or hash spill count is greater than 0, it indicates that the SORT/HASH operation may spill to disk. The suggestion is to analyze whether the business needs to adjust parameters like work_mem and shared_buffers. If disk spill is detected, it is a root cause, otherwise it is not a root cause.

[Chief DBA]: The identified root causes of the anomaly are high CPU usage due to the high number of running processes and high load averages, slow queries, and high memory usage due to complex queries, insufficient memory allocation, and the possibility of disk spill.
----------------------------
(solution) 1. Monitor and manage the number of running processes on the node, ensuring that it remains within acceptable limits.
2. Add the recommended indexes: ['movie_info#movie_id', 'movie_companies#movie_id', 'keyword#keyword', 'aka_name#person_id'] to reduce cost.
3. Analyze the query plans and consider adjustments to parameters like 'work_mem' and 'shared_buffers' to help reduce or eliminate disk spilling.
4. Investigate and address any system or infrastructure issues that may be contributing to the high load averages.
INSUFFICIENT_MEMORY_ALLOCATION
[Chief DBA]: The anomaly started at 1691897340 and ended at 1691897430.

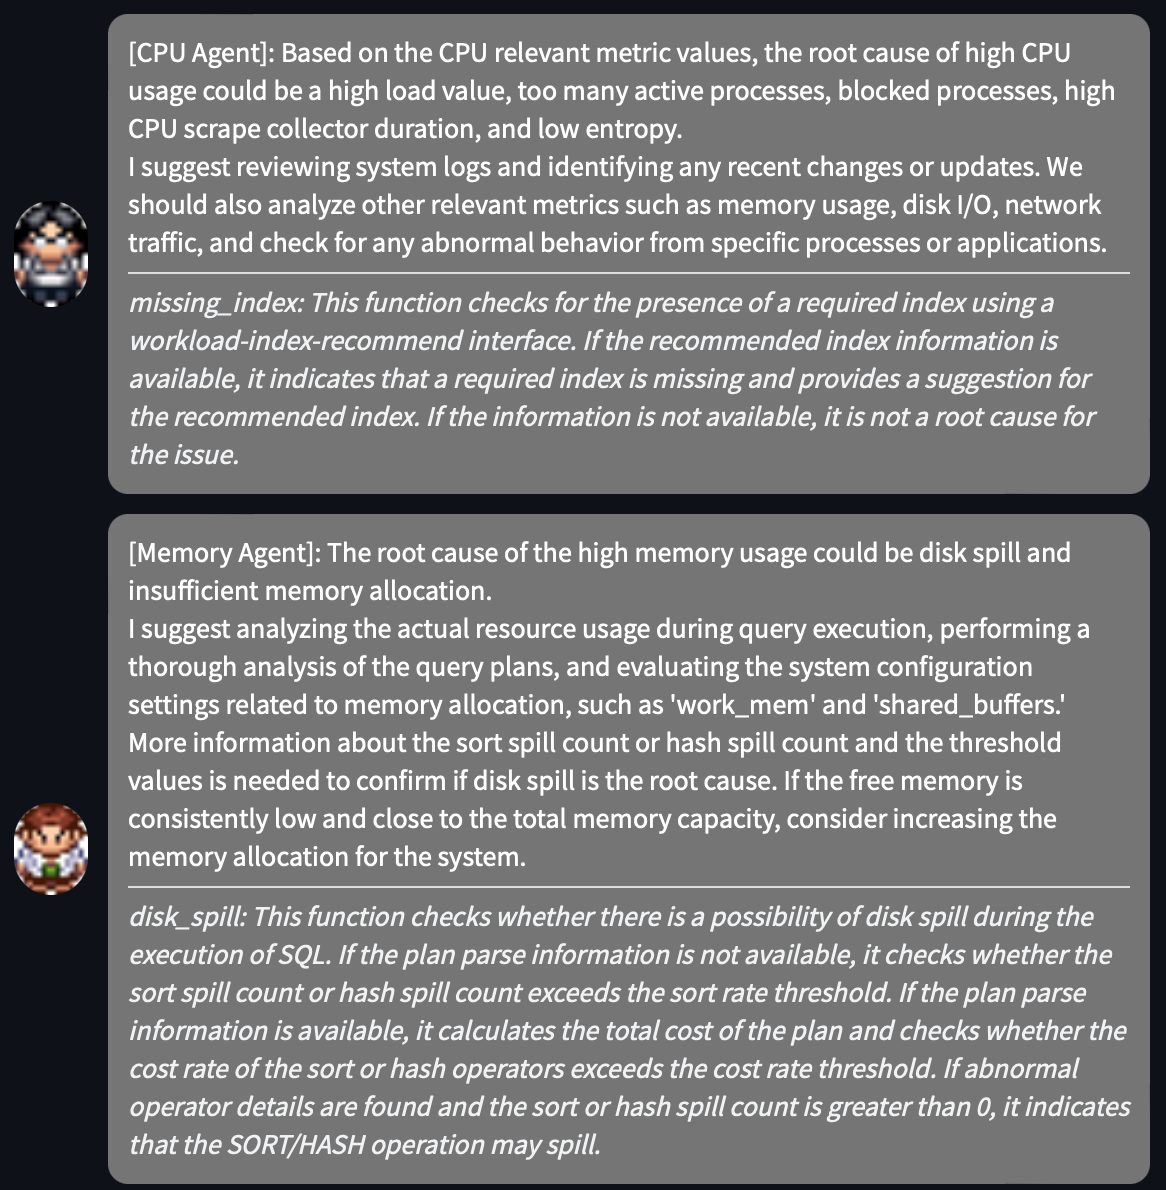
[CPU Agent]: Based on the CPU relevant metric values, the root cause of high CPU usage could be a high load value, too many active processes, blocked processes, high CPU scrape collector duration, and low entropy.
I suggest reviewing system logs and identifying any recent changes or updates. We should also analyze other relevant metrics such as memory usage, disk I/O, network traffic, and check for any abnormal behavior from specific processes or applications.
----------------------------
(matched knowledge) missing_index: This function checks for the presence of a required index using a workload-index-recommend interface. If the recommended index information is available, it indicates that a required index is missing and provides a suggestion for the recommended index. If the information is not available, it is not a root cause for the issue.

[Memory Agent]: The root cause of the high memory usage could be disk spill and insufficient memory allocation.
I suggest analyzing the actual resource usage during query execution, performing a thorough analysis of the query plans, and evaluating the system configuration settings related to memory allocation, such as 'work_mem' and 'shared_buffers.' More information about the sort spill count or hash spill count and the threshold values is needed to confirm if disk spill is the root cause. If the free memory is consistently low and close to the total memory capacity, consider increasing the memory allocation for the system.
----------------------------
(matched knowledge) disk_spill: This function checks whether there is a possibility of disk spill during the execution of SQL. If the plan parse information is not available, it checks whether the sort spill count or hash spill count exceeds the sort rate threshold. If the plan parse information is available, it calculates the total cost of the plan and checks whether the cost rate of the sort or hash operators exceeds the cost rate threshold. If abnormal operator details are found and the sort or hash spill count is greater than 0, it indicates that the SORT/HASH operation may spill.

[Chief DBA]: The identified root causes of the anomaly are high CPU usage due to high load value, too many active processes, blocked processes, high CPU scrape collector duration, and low entropy. The high memory usage could be due to disk spill and insufficient memory allocation.
----------------------------
(solution) To resolve the high CPU usage, we should review system logs and identify any recent changes or updates. We should also analyze other relevant metrics such as memory usage, disk I/O, network traffic, and check for any abnormal behavior from specific processes or applications.
To mitigate the high memory usage, we should analyze the actual resource usage during query execution, perform a thorough analysis of the query plans, and evaluate the system configuration settings related to memory allocation, such as 'work_mem' and 'shared_buffers.' More information about the sort spill count or hash spill count and the threshold values is needed to confirm if disk spill is the root cause. If the free memory is consistently low and close to the total memory capacity, consider increasing the memory allocation for the system.
POOR_JOIN_PERFORMANCE
case_poor_join5.mp4
- Change to vue frontend
- More powerful anomaly trigger
- Project cleaning
- (framework update) Integrate components as a whole
- Public generated anomaly training data
- Fine-tune open-source Model
- Support other databases like MySQL
- Collect more knowledge and store in vector db (./knowledge_vector_db)
The listed items are urgent, which we will fix within this month.
https://github.com/OpenBMB/AgentVerse
https://github.com/OpenBMB/BMTools
https://github.com/OpenBMB/ToolBench
Feel free to cite us if you like this project.
@misc{zhou2023llm4diag,
      title={LLM As DBA},
      author={Xuanhe Zhou, Guoliang Li, Zhiyuan Liu},
      year={2023},
      eprint={2308.05481},
      archivePrefix={arXiv},
      primaryClass={cs.DB}
}
Other Collaborators: Wei Zhou, Kunyi Li.
We thank all the contributors to this project. Do not hesitate if you would like to get involved or contribute!


