This repository contains sample code to run experiments and demos with hindsight. You can run the code here using the mozilla/hindsight docker container, as follows:
$ docker pull mozilla/hindsight

$ chmod 777 output run -R

$ docker run -it \
    -v $(pwd)/cfg:/app/cfg \
    -v $(pwd)/logs:/app/logs \
    -v $(pwd)/run:/app/run \
    -v $(pwd)/output:/app/output \
    mozilla/hindsight
This will mount the local directories into the Docker container and execute
hindsight. Resulting data will be put into the output directory.
When developing, plugins should be put in the run directory.
Hindsight is the successor of Heka, a high performance log processing pipeline built to process logs and telemetry from Firefox Services. Heka was written in Go and eventually ran into the limits of the runtime. The Heka developers decided to rewrite it into two components: a light weight data processing kernel, written in C, that controls Lua plugins executed inside a sandbox. The project, called Hindsight, is available at github.com/mozilla-services/hindsight.
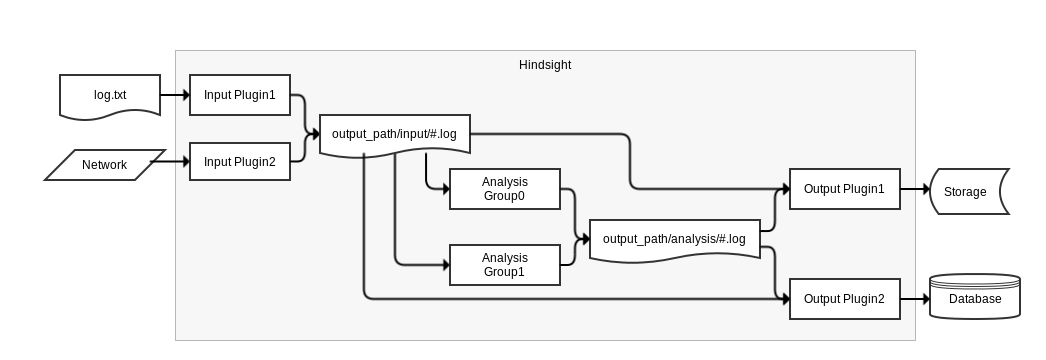
Hindsight sits behind the streaming layer of the logging pipeline, typically consuming logs from a Kafka broker. It can also be used to read local log files, which is what this tutorial uses. The processing works as follows:
-
First, hindsight consumes incoming messages coming using input plugins. The plugins can read the data from local files, message brokers or database, anything that can run in the lua sandbox. Fields can be standardized, timestamps converted, etc. Standardized messages are stored in a Heka protocol buffer message and injected into the next layer of processing.
-
Standardized messages are then forwarded to analysis plugins. Routing and multiplexing happens to allow several plugins to receive a copy of a given message. Plugins run arbitrary code written to achieve very specific tasks: compute statistics, flag events containing a given string, etc. New data created by analysis plugin is injected into the payload buffer for incremental construction of the final payload output.
-
Output plugins process the payload buffer and write data out to files, database, message brokers, etc.
In this repository, input plugins are stored in run/input, analysis plugins in
run/analysis and output plugins in run/output.
$ tree run/
run/
├── input
│   ├── input_nginx.cfg               # Input plugin to load
│   └── input_nginx.lua               # an nginx log file
├── analysis
│   ├── counter.cfg                   # Analysis plugin to count
│   ├── counter.lua                   # log entries
│   ├── suspicious_signatures.cfg     # Analysis plugin to detect
│   └── suspicious_signatures.lua     # suspicious signatures
└── output
    ├── heka_debug.cfg                # Output plugin to print debug data while running Hindsight
    └── heka_inject_payload.cfg       # Output plugin to write output data to a local file
When running the docker container of hindsight with the local directories
mounter, global configuration is loaded from cfg/hindsight.cfg. Samples logs
files are taken from logs/ and output plugins write their data to output/.
$ tree -L 1
.
├── cfg
├── logs
├── output
└── run
Let's take a quick look at some of these files to understand how Hindsight uses
them. Our input is an Nginx access log file stored under logs/nginx_access.log.
The configuration at run/input/input_nginx.cfg instructs the plugin at
run/input/input_nginx.lua to read this file, standardizes its fields and
passes each log entry over to the analysis layer.
$ cat run/input/input_nginx.cfg
filename          = "input_nginx.lua"
input_file        = "logs/nginx_access.log"
instruction_limit = 0
The Lua source code of the plugin can be seen here. It reads the logs file line by line and parses each line using a custom grammar configured to understand the Nginx log format. The parser uses a Lua library called lpeg which transforms a log line into a map of fields. The map is then stored into a Hindsight message and injected into the analysis queue.
require "io"

local clf = require "lpeg.common_log_format"

local msg = {
Timestamp   = nil,
Type        = "logfile",
Hostname    = "localhost",
Logger      = "nginx",
Payload     = nil,
Fields      = nil
}

local grammar = clf.build_nginx_grammar('$remote_addr - $remote_user [$time_local] "$request" $status $body_bytes_sent "$http_referer" "$http_user_agent"')
local cnt = 0;
local fn = read_config("input_file")

function process_message()
    local fh = assert(io.open(fn, "rb"))

    for line in fh:lines() do
        local fields = grammar:match(line)
        if fields then
            msg.Timestamp = fields.time
            fields.time = nil
            msg.Fields = fields
            inject_message(msg, fh:seek())
            cnt = cnt + 1
        end
    end
    fh:close()

    return 0, tostring(cnt)
end
Hindsight takes care of forwarding the message to the next layer, where analysis plugins will perform further work. In an environment that processes many different types of messages, a routing operation must happen to allows analysis plugins to only receive the type of message they care about. Let's take a look at the counter analysis plugin, whose only task is to count the number of messages that pass through it. Its configuration file can be seen here. Note the message_matcher directive in this file. It contains a matching rule that gets applied to every message entering the analysis queue of Hindsight.
filename        = "counter.lua"
message_matcher = "Logger == 'nginx' && Type == 'logfile' && Fields[request] =~ '^GET ' && Fields[remote_addr] != '172.21.0.2'"
ticker_interval = 5
When a message matches the rule, Hindsight sends it for processing to the plugin located here.
The source code of the counter analyzer couldn't be more simple. That analyzer only counts messages it receives into a msgcount variable and periodically publishes the latest total over to the output queue through the inject_payload function.
The timer_event function is only executed periodically, as defined by the ticker_interval set in the plugin configuration. In our case, it will run every 5 seconds.
require "string"
msgcount = 0

function process_message()
    msgcount = msgcount + 1
    return 0
end

function timer_event()
    inject_payload("txt", "count", string.format("%d message analysed", msgcount))
end
When the counter plugin injects a payload, Hindsight forwards that payload to the output queue. We're in the last part of the processing logic, where plugins take data and write it to a destination. Here again, an output plugin takes a configuration file and a Lua file. This is where you'd want to write a plugin that inserts events into a database, or sends email to people. For development purpose, we will limit ourselves to output plugins that write data to disk, like the heka_inject_payload plugin that is provided with Hindsight.
As defined by its configuration,
this output plugin will receive payloads injected by the analysis plugins and
write them under the output/payload directory, effectively storing a count of
Nginx logs whose request and remote IP addresses matched the filter of the
counter plugin.
$ cat run/output/heka_inject_payload.cfg
filename        = "heka_inject_payload.lua"
message_matcher = "Type == 'inject_payload'"
output_dir      = "output/payload"
The output can be seen in output/payload/analysis.counter.count.txt.
$ cat output/payload/analysis.counter.count.txt
1731 message analysed
This is it for a quick overview of how Hindsight works. For more complex
analyzers, take a look at the content of the run/analysis directory. For extra
documentation, refer to these links:
-
Lua Sandbox, including documentation of input, analysis and output interfaces.