DesignStartTrace
An Arm Coresight trace sniffer designed for use with the ChipWhisperer side channel analysis platform.
DesignStartTrace allows you to leverage Arm trace technology to non-intrusively learn what your target is doing at what time. You can then combine this information with power traces collected by ChipWhisperer hardware to facilitate and speed up your side-channel analysis.
Examples
First, here's a few examples of what you can do with DesignStartTrace:
-
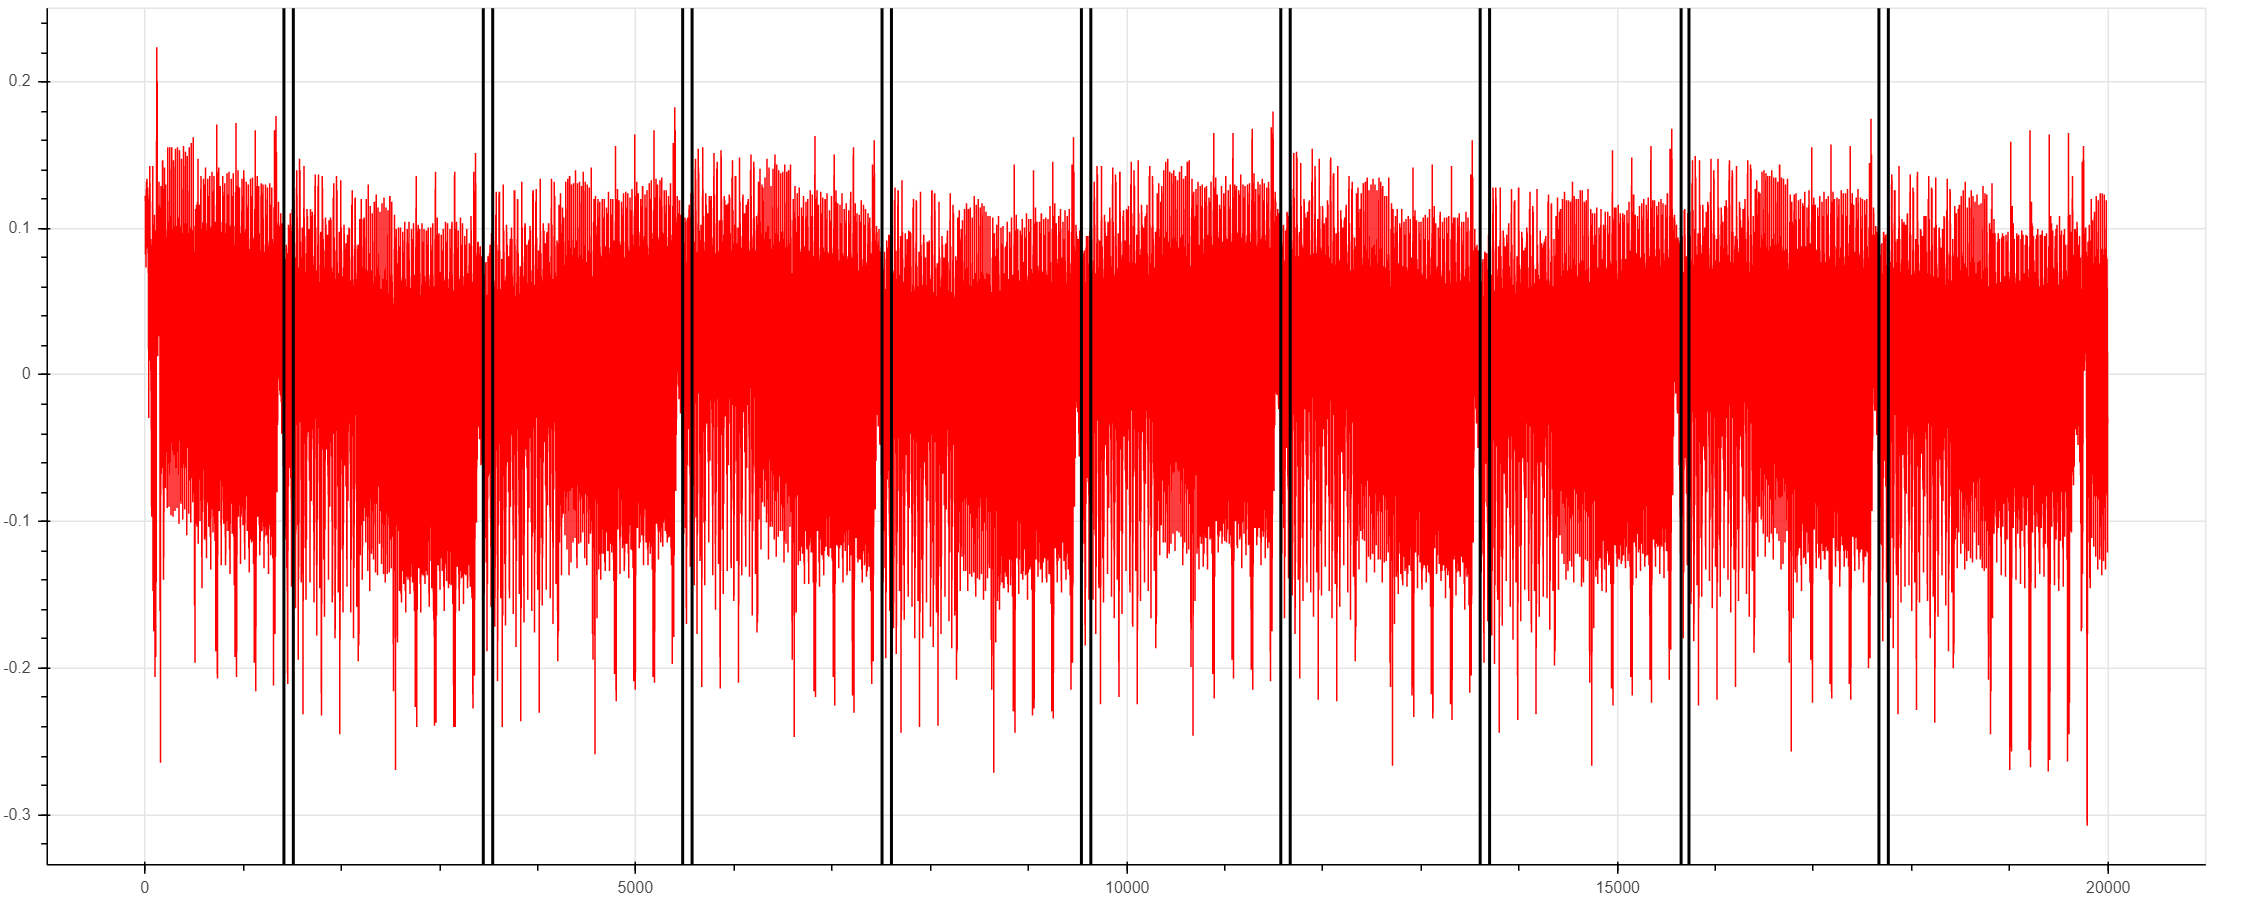
Identify when a specific instruction is being executed. The ETM can generate trace packets when a specific PC value is reached. Here, the target is executing AES, and trace packets are emitted at the start and end of the ShiftRows operation:
-
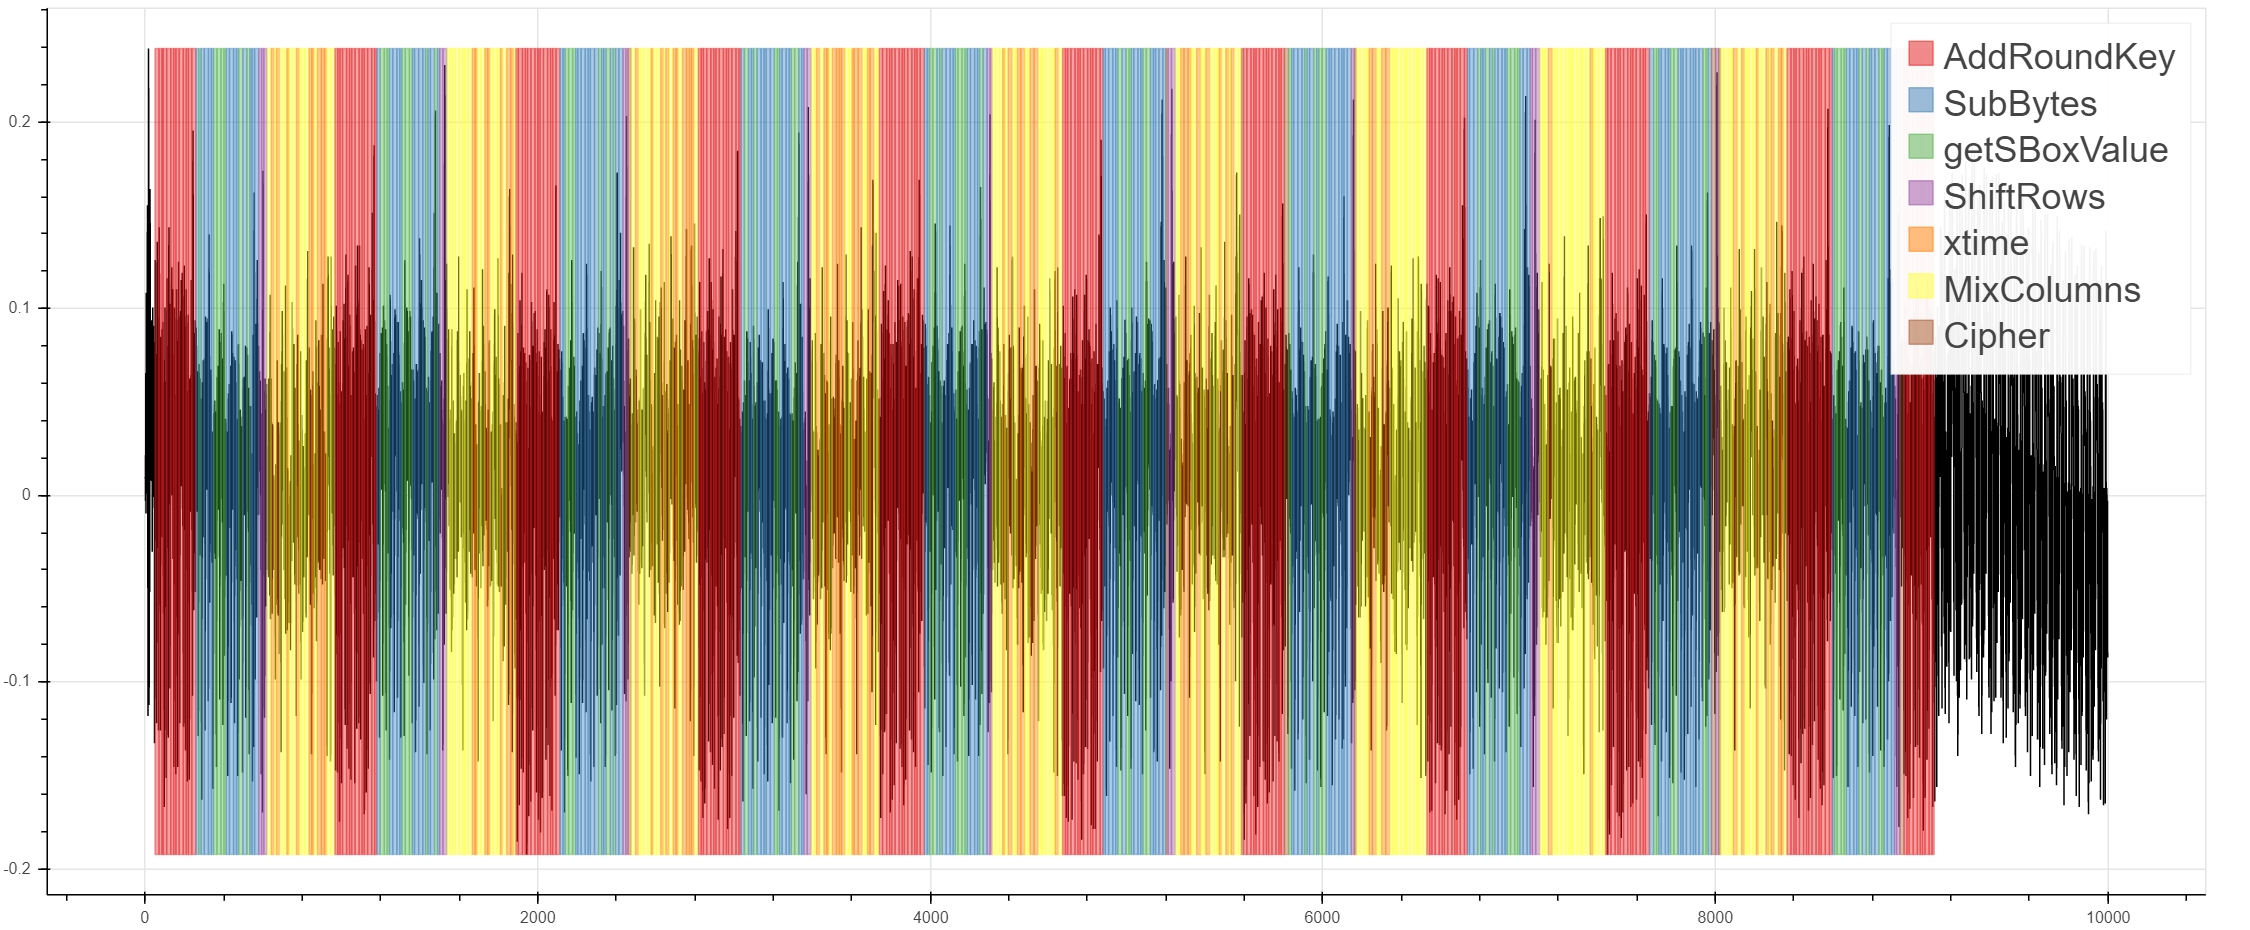
Identify functions or code segments with periodic PC sampling. The DWT can emit periodic PC samples. This allows you to easily visualize and find functions on your power trace:
-
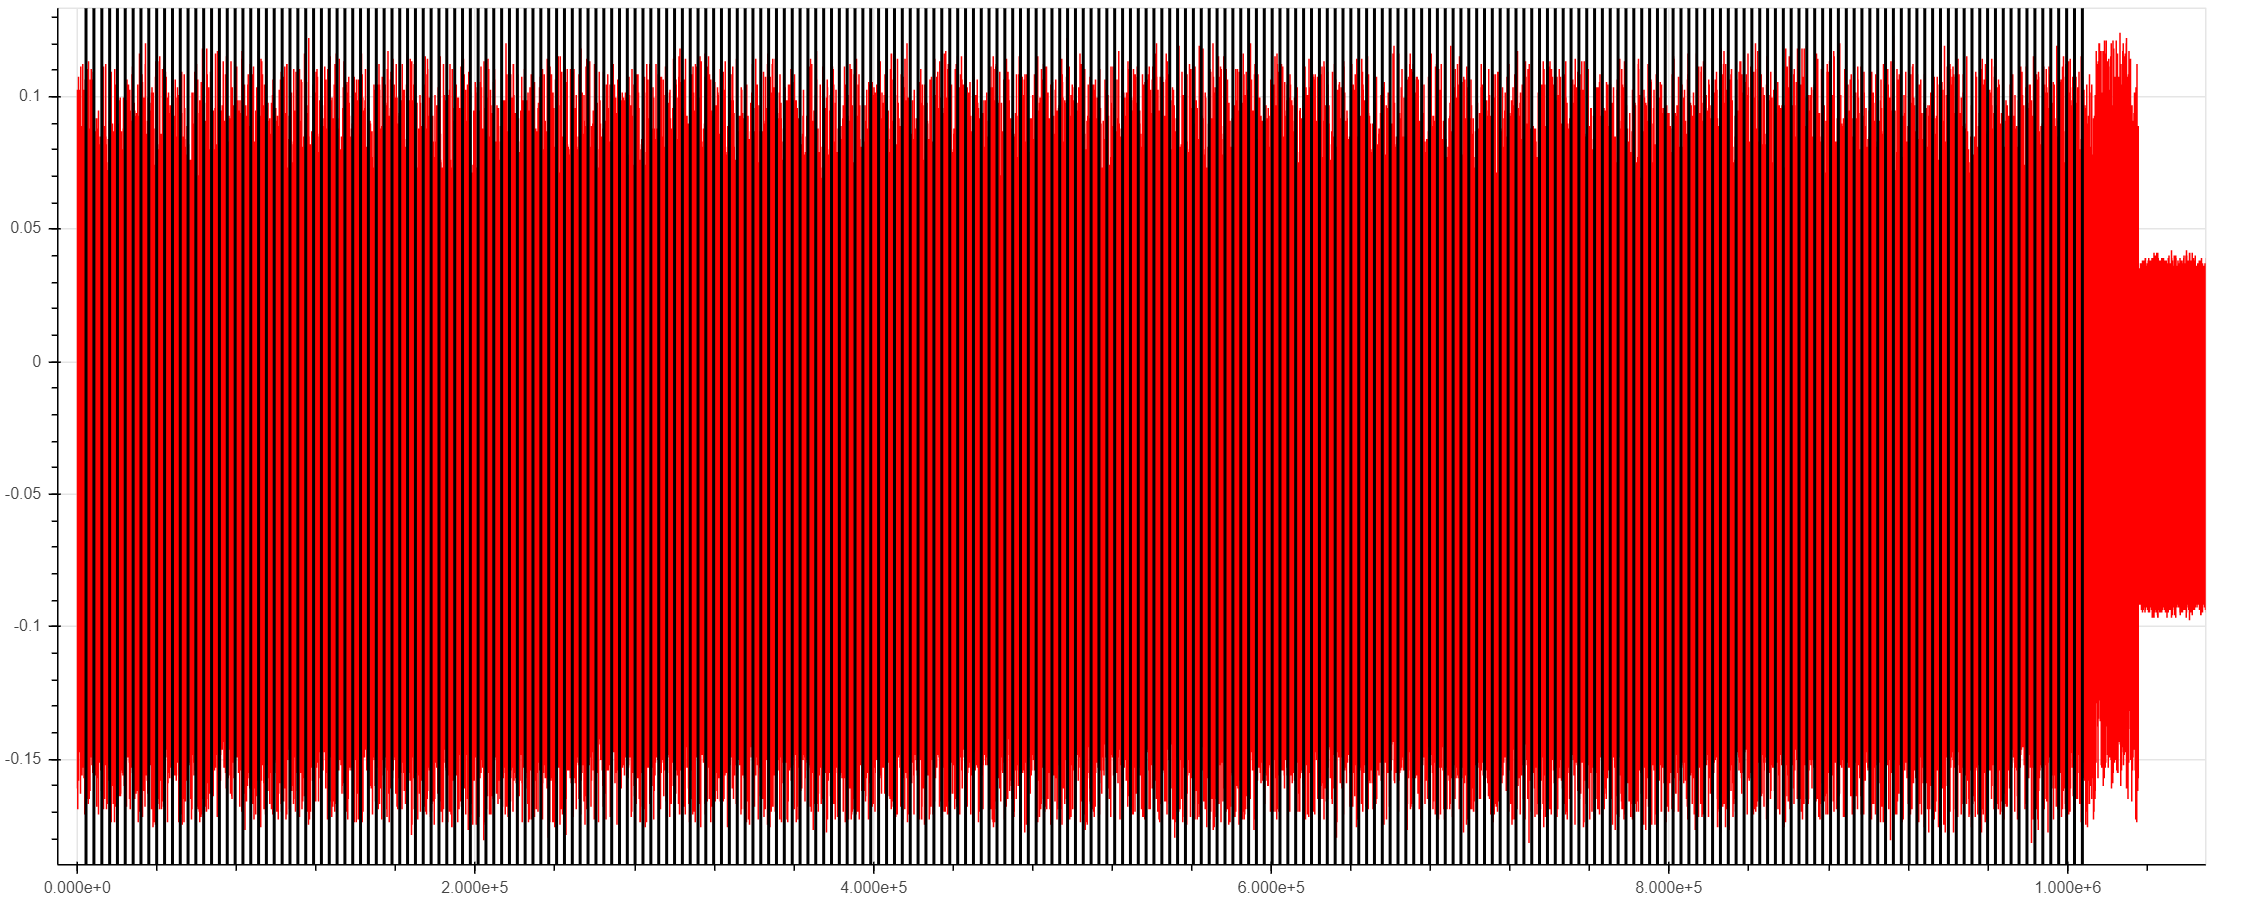
Identify time leakage. Non-intrusively and quickly check whether sensitive code segments are time constant. Here we show the start of every point addition in an ECC P-256 point multiplication. You can't see it here because there's so many point additions, but there is in fact a significant time variance in the length of each point addition, which could be useful for a timing attack...
-
Use any given trace packet as a power trace capture trigger. If inserting
trigger_high()in your source code is a problem, this could be the solution for you! Move the trigger anywhere you want, as many times as you want, without ever having to recompile! -
Use any given trace packet as a time reference for fault attacks. Speed up evaluation of glitch-tolerant code by using trace to quickly get a time reference to when sensitive code is executing. Again you could do this without trace via
trigger_high(), but this requires modifying source code and recompiling -- unlike trace which is completely transparent and can be enabled, disabled, or moved around without touching the source code at all.


Arm trace can generate tons of information about what your target is doing. These examples are just scratching the surface of what's possible!
Targets and Platforms
As its name implies, DesignStartTrace was first developed for the Arm DesignStart FPGA platform, which is a free evaluation platform for Arm Cortex M1 and M3 processors. We ported the reference design to our CW305 side-channel FPGA target board. Detailed instructions for porting are available here: https://github.com/newaetech/CW305-Arm-DesignStart.
We then added trace sniffing logic to this to create "DesignStartTrace". When implemented on our CW305 target board, this provides you with a Cortex M3 along with our trace sniffing logic, co-located on the CW305's Xilinx Artix 7 FPGA. If you're already familiar with the ChipWhisperer target framework, this target looks like any of our ChipWhisperer reference targets, and so any existing target application can very easily be ported to this platform and gain the power of trace.
If your target cannot be implemented on the CW305 platform, the trace sniffing logic has been ported to the PhyWhisperer-USB and ChipWhisperer-Husky. This can support any target with a parallel trace port or SWO pin. Look to TraceWhisperer repository for this variant. Both of these platforms provide all the same capabilities of trace, but with some gotchas related to power trace noise which are discussed here.
How it Works
The trace sniffer runs completely in hardware on the FPGA. It is basically like PhyWhisperer-USB, but for trace. (In fact, about half of the Verilog source code is shared with PhyWhisperer-USB.) Raw trace data is time-stamped and stored internally in the FPGA. Up to 16Kbytes of trace data can be stored. The cycle-accurate timestamping is what allows the collected trace information to be usefully combined with power traces, as shown in the examples above.
How to Use It
If you're already familiar with ChipWhisperer, just add this to your notebook:
from chipwhisperer.capture.trace.TraceWhisperer import TraceWhisperer
trace = TraceWhisperer(target, scope)
and start having fun. This example Jupyter notebook shows a bunch of examples. This notebook supports the CW305, CW610 (PhyWhisperer), and ChipWhisperer-Husky platforms. If you're using trace on the CW305 or CW610 platform, you'll also need ChipWhisperer capture hardware (e.g. ChipWhisperer-Lite). The target may be the CWLITEARM; other targets with SWO and/or parallel trace ports (such as the CW308 K82F target) can also be used.
Use help(TraceWhisperer) to see which methods are available. At a low
level, trace is configured on the sniffing side via configuration and status
registers in the FPGA, all of which are accessible via the fpga_read() and
fpga_write() methods. On the target side, "There's More Than One Way To Do
It", but the method supported by TraceWhisperer.py uses additional
SimpleSerial commands to set the trace registers on the target. See the
simpleserial-trace
example, which can easily be ported to any SimpleSerial target.
Triggering
Once you've gone through the example notebook, read this note on triggering to learn all the triggering options and possibilities that are added by trace.
Trace Jitter
Debug trace data has some jitter: if the same operation is run multiple times on the target processor, and this operation generates the same debug trace data each time, there will be small differences in the timing of this trace data.
This jitter can be observed by running the example notebook and using trace as the trigger. To use trace for side-channel analysis effectively, this jitter must be understood and possibly dealt with.
The observations that follow are just that, observations made during the development of this tooling; there is nothing in Arm's specifications which guarantees some permissible range for this jitter.
Jitter from Parallel Trace Port
When there is no trace data to output, synchronization frames are produced continuously. These frames are 16 or 32 bits wide. It follows that with any trace port width less than 32 bits, jitter is unavoidable. In practice, up to 6 clock cycles of jitter have been observed with a 4-bit trace port.
In many cases, this jitter can be corrected / eliminated in post-processing, e.g. by re-aligning the power traces.
Jitter from SWO Pin
When there is no trace data to output on the SWO pin, the link can be
idle, as long as the SYNCTAP field of the DWT.CTRL register is set to 0
(reference: ARM DDI 0403E.d, section C1.8.7). If these bits are not zero, a
periodic synchronization frame is emitted every 16M, 64M, or 256M cycles. If
a synchronization frame is being emitted when a trace event occurs, the
observation of the trace event could be delayed by hundreds of clock cycles!
Unless your application needs the synchronization frames, disable them to
avoid this situation.
The SWO baudrate sets a lower bound on jitter; for minimum jitter, set the
TPI.ACPR register to 0: this makes the baud rate equal to the target clock
rate. With this setting, it may be possible for there to be no jitter at all.
In practice, some jitter is frequently observed. The uecc.ipynb attack
notebook
illustrates this and shows how jitter can be dealt with.
In addition, if trace acquisition is clocked from PhyWhisperer's SAM3U clock, instead of the target clock, the asynchronous nature of these clocks can result in small jitter on a small scale (1-2 cycles was observed with a 24 MHz target clock), and frequency drift which can build up on longer captures. For example, for a trace that is 20 million clock cycles long at 24 MHz, jitter is sometimes seen to increase linearly throughout the capture, starting a 2 cycles and ending at 8 cycles. The solution to this is to source the trace acquisition from the target clock, not the SAM3U clock.
Orbuculum
Raw trace data has somewhat complex layers of formatting. Fortunately, Orbuculum is a very nice open-source trace parser which can be used to transform raw trace data into something more useful.
For example, the raw trace data for two alternating matching PC addresses looks like this, which is a bit of a mess to understand:
03 08 20 af 3a 00 00 84
03 08 20 b3 3a 00 00 22 01 84
03 08 20 af 3a 00 00 84
03 08 20 b3 3a 45 00 00 01 84
03 08 20 af 3a 00 00 84
03 08 20 8a b2 3a 00 00 01 84
03 08 20 af 3a 00 00 84 01 15
03 08 20 b3 3a 00 00 84
03 08 20 af 3a 00 00 22 01 84
After feeding this through Orbuculum, you can clearly see the two alternating addresses:
0x00003aae
0x00003ab2
0x00003aae
0x00003ab2
0x00003aae
0x00003ab2
0x00003aae
0x00003ab2
0x00003aae
(If you must know, section D4.2 of ARM IHI 0029E will show you why the raw trace data looks the way it does... don't say I didn't warn you!)
Development Notes
There is a Verilog simulation environment here.
In order to generate a new bitfile, you'll need to first build the Arm DesignStart core, following the instructions here.
When you generate a new bitfile, don't forget to update the .mmi file and
run the make_prog_files.bat script, as described
here.
Similarly if you wish to modify the firmware, follow the instructions here.