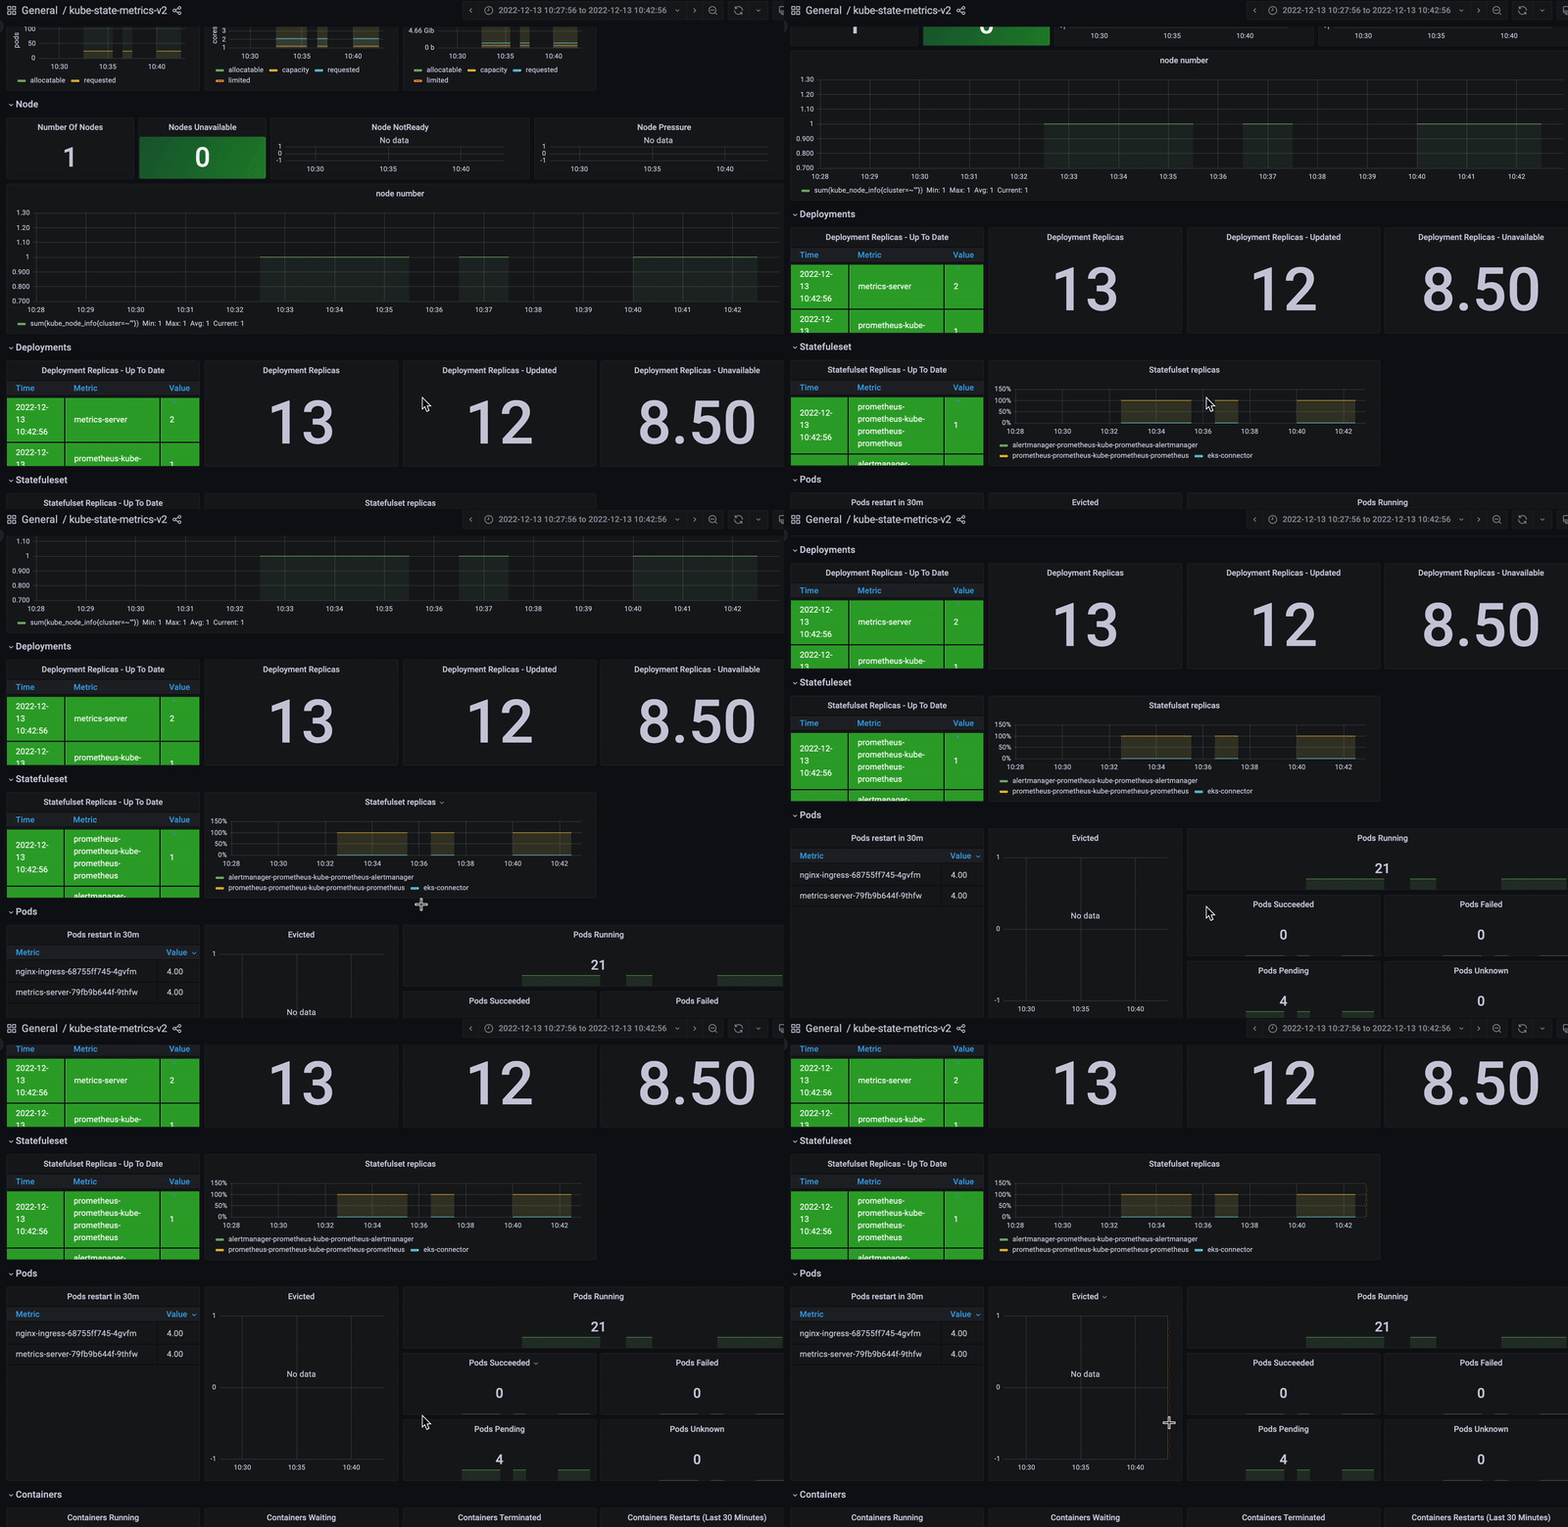
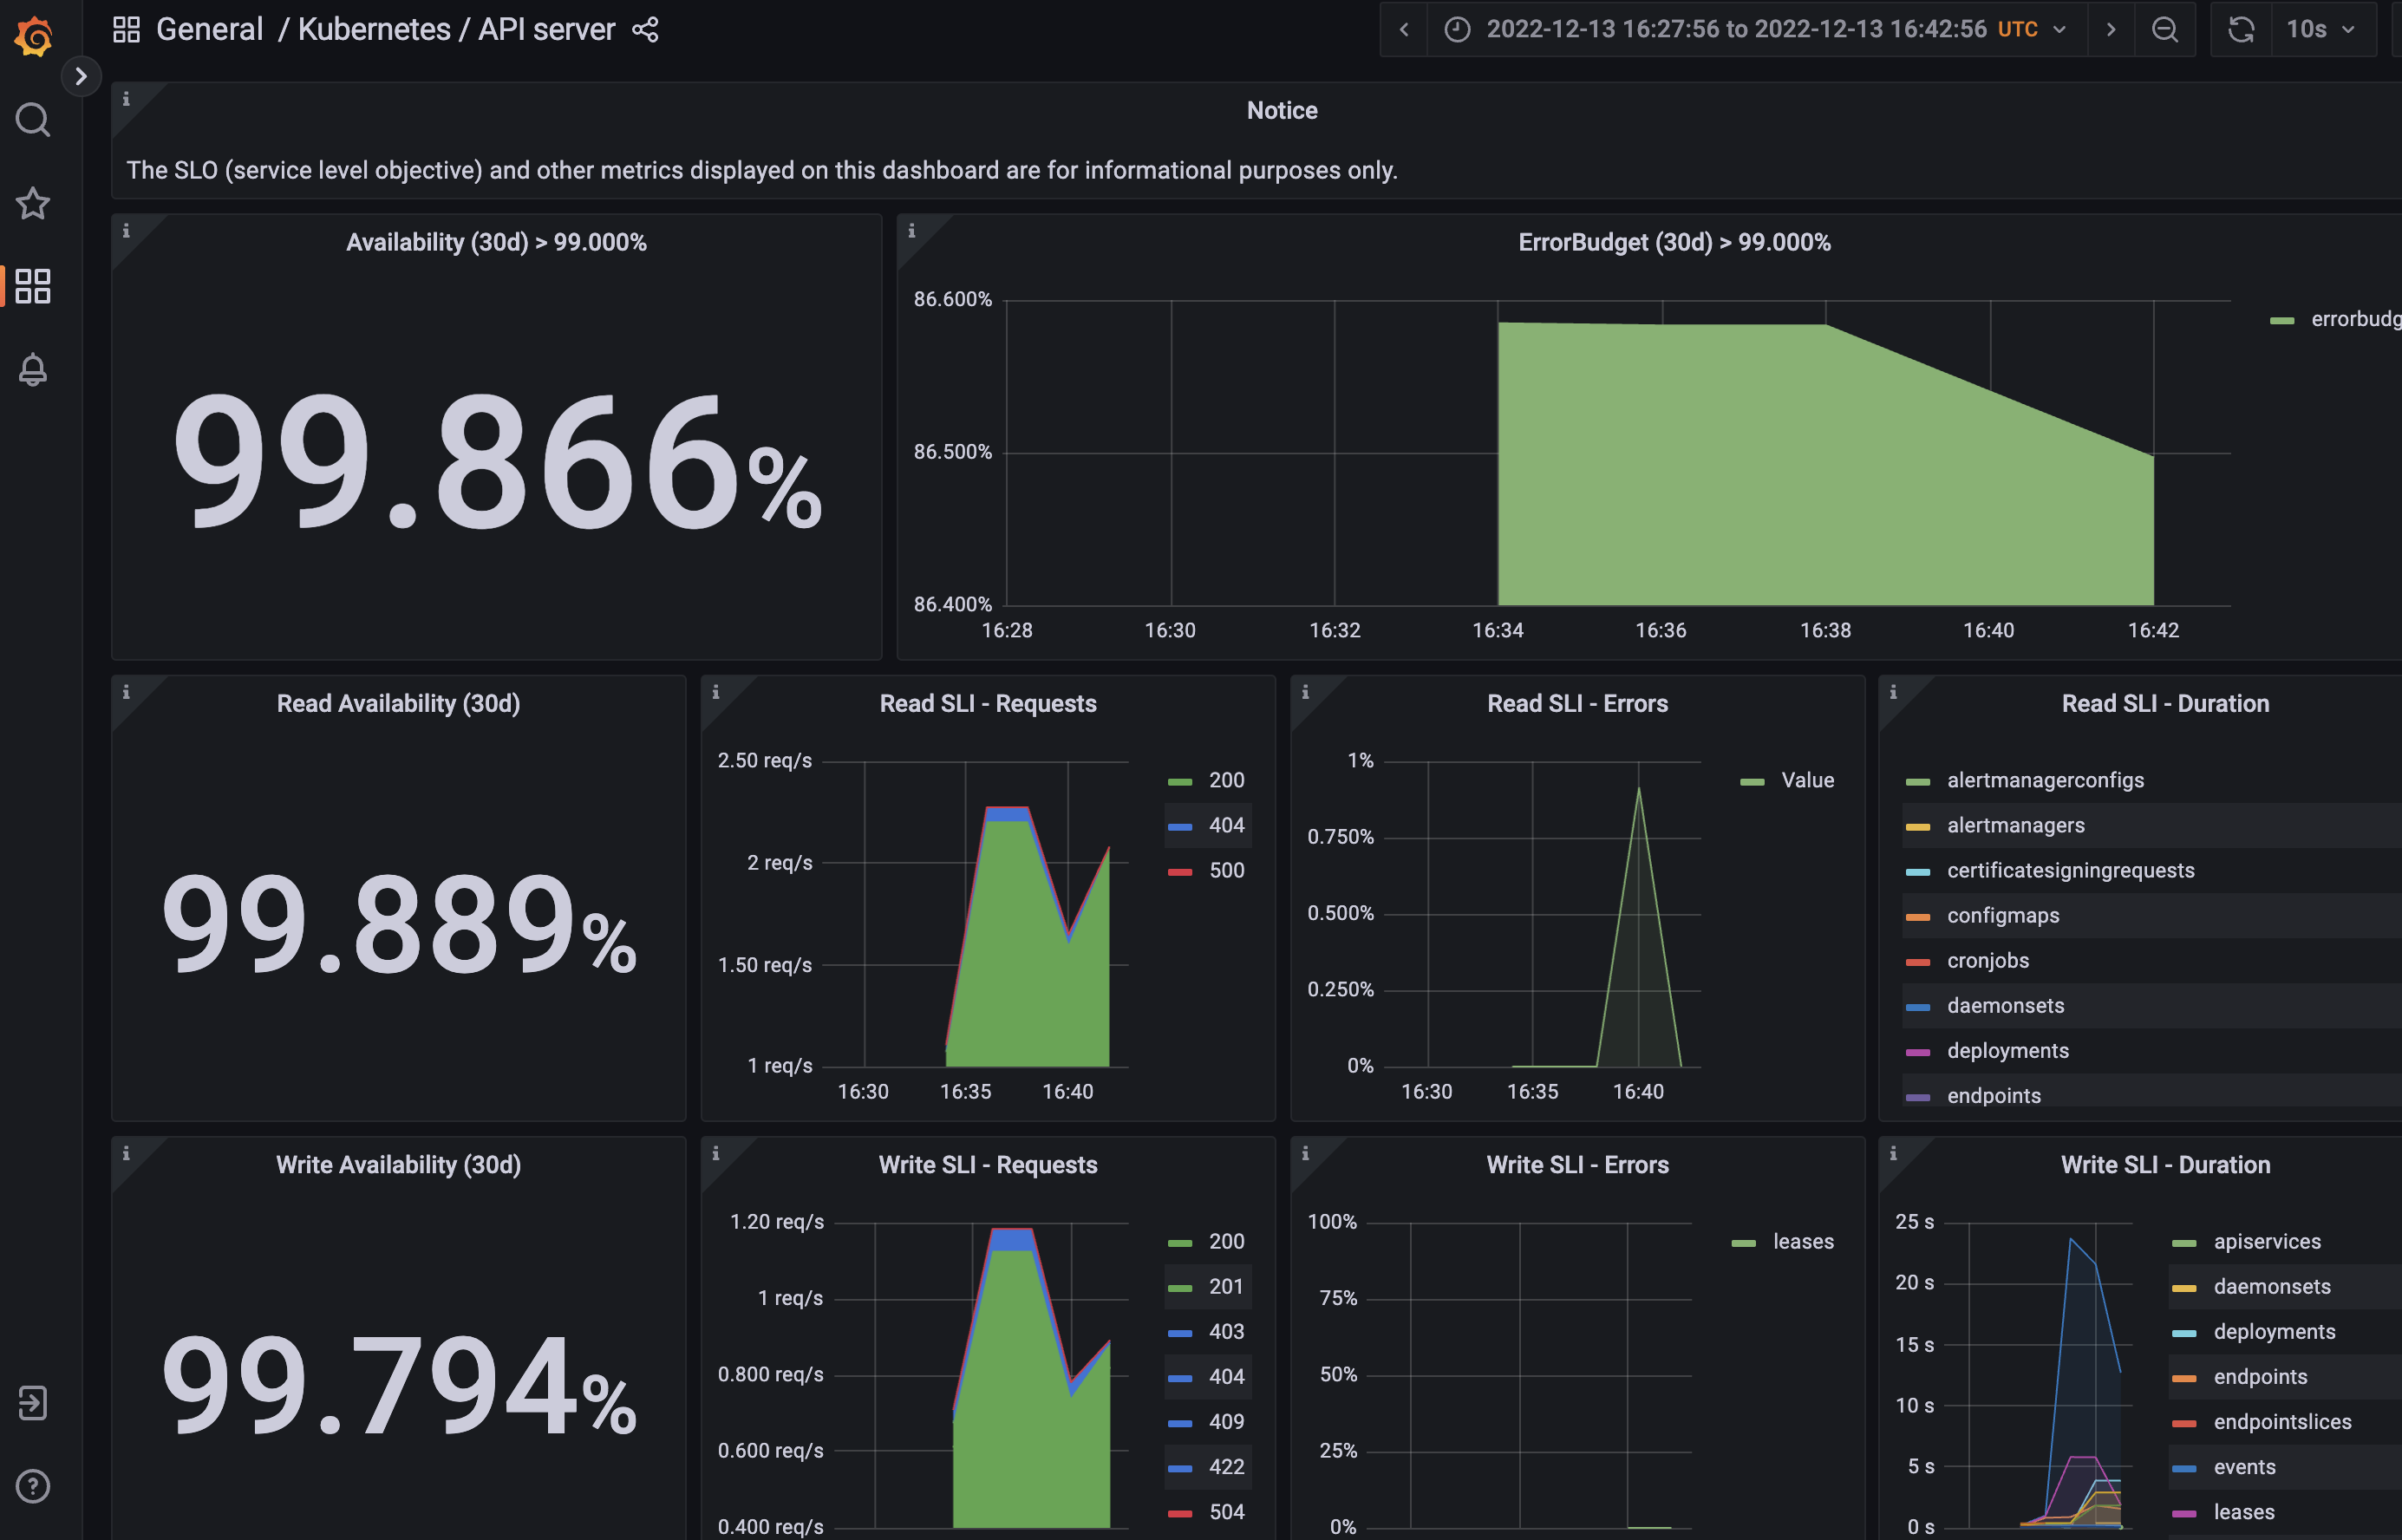
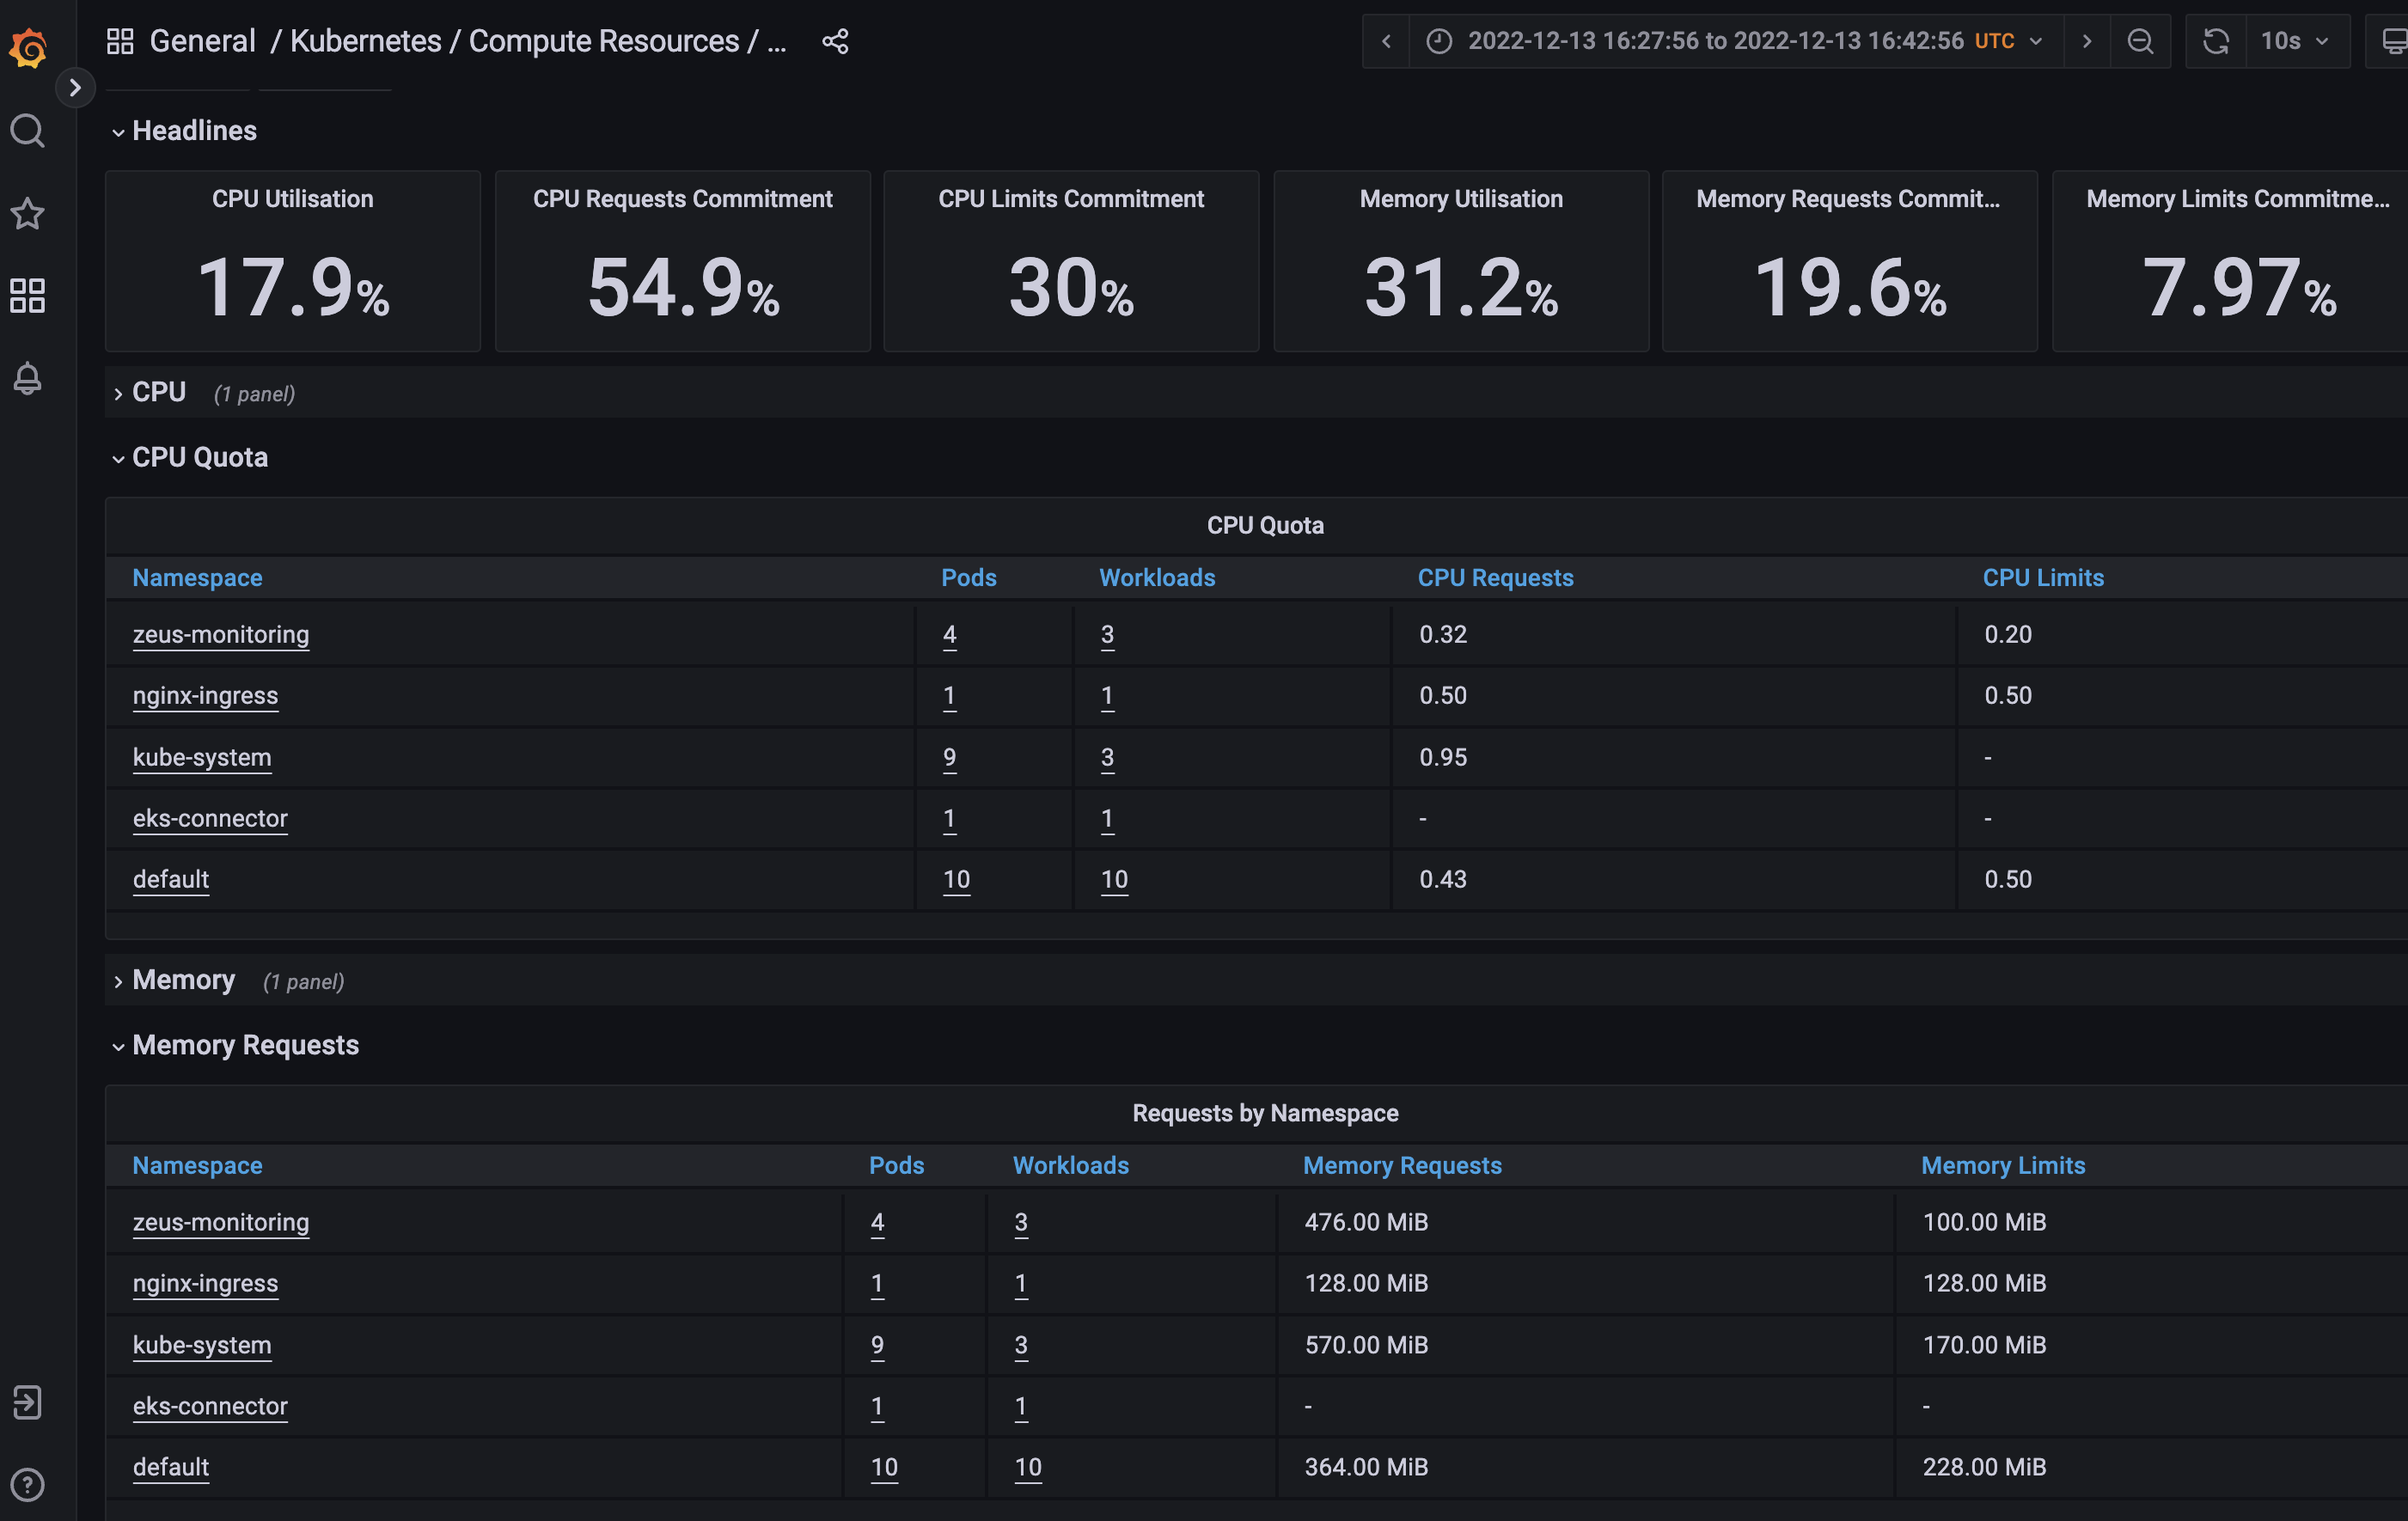
-
Minikube 🧊 documentation
- Run minikube with the following command:
minikube start - p [name of your cluster]
-
Install kubectl Download here
-
Docker Desktop 🐋 Download here
-
Helm Charts, to set up Prometheus Operator Clone git repo here
-
Make sure your pods are running in your cluster by entering the following in your terminal:
kubectl get podsor
kubectl get po -A -
Ensure sufficient computational resources are available to build and user clusters 🖥️
- Run minikube with the following command:
💡 In chronological order: Install minikube and kubectl ⇒ Deploy Helm ⇒ Deploy Prometheus & Grafana
-
You will need to obtain the stateful set of your clusters.
kubectl get statefulset -
Copy the stateful set outputted from your terminal to create the yaml files. Below is an example of the syntax to create your files. You can name the files any way you want.
kubectl describe statefulset prometheus-prometheus-kube-prometheus-prometheus > prometheus.yaml
kubectl describe statefulset prometheus-prometheus-kube-operator-alertmanager > prometheus-alertmanager.yaml -
To get deployments enter the following command into your terminal:
kubectl get deployment -
Create a deployment yaml file with the following command below. Note, you can name this file however you want. Below is an example:
kubectl describe deployment prometheus-kube-prometheus-operator > prometheus-operator.yaml -
Create another deployment yaml file with the following command. Note that you can name this file however you want. Below is an example:
kubectl describe deployment prometheus-kube-prometheus-operator > prometheus-secret.yaml -
Obtain the list of all services in your cluster, by entering the following command in your terminal:
kubectl get services > services -
Look for the pod deploying to 'prometheus-grafana' followed by the ID of the pod. Below is an example:
kubectl logs prometheus-grafana-6fdd6868b4-hgtp4 -c grafana -
Open Grafana to a port of your choosing with the command:
kubectl port-forward deployment/prometheus-grafana [port of your choosing]:3000 -
You will be prompted to login into Grafana. By default, the username and password is set to
adminandprom-operator, respectively.
-
To ensure all your pods are accessible and running, enter in the following command into your terminal:
kubectl get po -Akubectl get pods -
Obtain the specific deployments in your cluster with the following command:
kubectl get deployment --namespace=[name of your namespace] -
Open Prometheus to a port of your choosing with the following command:
kubectl port-forward prometheus-prometheus-kube-prometheus-prometheus-0 9090 -
Repeat for the Prometheus alert managers:
kubectl port-forward service/prometheus-kube-prometheus-alertmanager [port #]
-
Fork and clone the
devbranch onto your local branch.https://github.com/oslabs-beta/Zeus.git
-
Install all the dependencies
npm install
-
Create
process.envfile at the root directoryroot ├─ process.env ├─ electron └─ src
-
Connect to NoSQL database in .env
mongoURI = "Your NoSQL URI string"
-
Ensure your cluster is running and then you can start the desktop application with:
npm run electron
For more information regarding how to contribute, please refer to the CONTRIBUTING.md guidelines from this repo.
-
Fork and clone the
devbranch onto your local branch.https://github.com/oslabs-beta/Zeus.git
-
Create a new a feature branch
[your-name]/AWESOME-FEATURES
-
Install all the dependencies
npm install
-
Create
process.envfile at the root directoryroot ├─ process.env ├─ electron └─ src
-
Connect to NoSQL database in .env
mongoURI = "Your NoSQL URI string"
-
Please ensure you are following eslint conventions.
-
Please ensure to create tests for your feature and that it passes your test suite.
-
Please be detailed in your pull request.
- Harvey Li LinkedIn | GitHub
- Amy (Aimée) Nguyen LinkedIn | GitHub
- John Wroge LinkedIn | GitHub
- Ed Cho LinkedIn | GitHub
