This project utilizes Create React App for the frontend and Flask for the backend.
Ensure the following dependencies and third-party libraries are installed on your system before running the project:
- Node.js
- npm
- Flask
- flask-cors
- scikit-learn (sklearn)
- pandas
Follow these steps to set up and run the project:
-
Installing Node Modules:
Open a terminal in the project folder and run the following command:
npm install
This will install all the required Node modules for the application.
-
Run Flask Server:
Open a terminal in the project folder and navigate to the
/serverfolder:cd serverSet the debug mode to on:
export FLASK_DEBUG=1Now, run the Flask server (by default, it will run on port 5000):
flask run
The server is now accessible at http://localhost:5000.
-
Setup React App:
Open a terminal in the project folder:
cd ..Now, you are back in the project folder. Run the following command to set up your React app (by default, it will run on port 3000):
npm start
Open http://localhost:3000 to view the app in the browser.
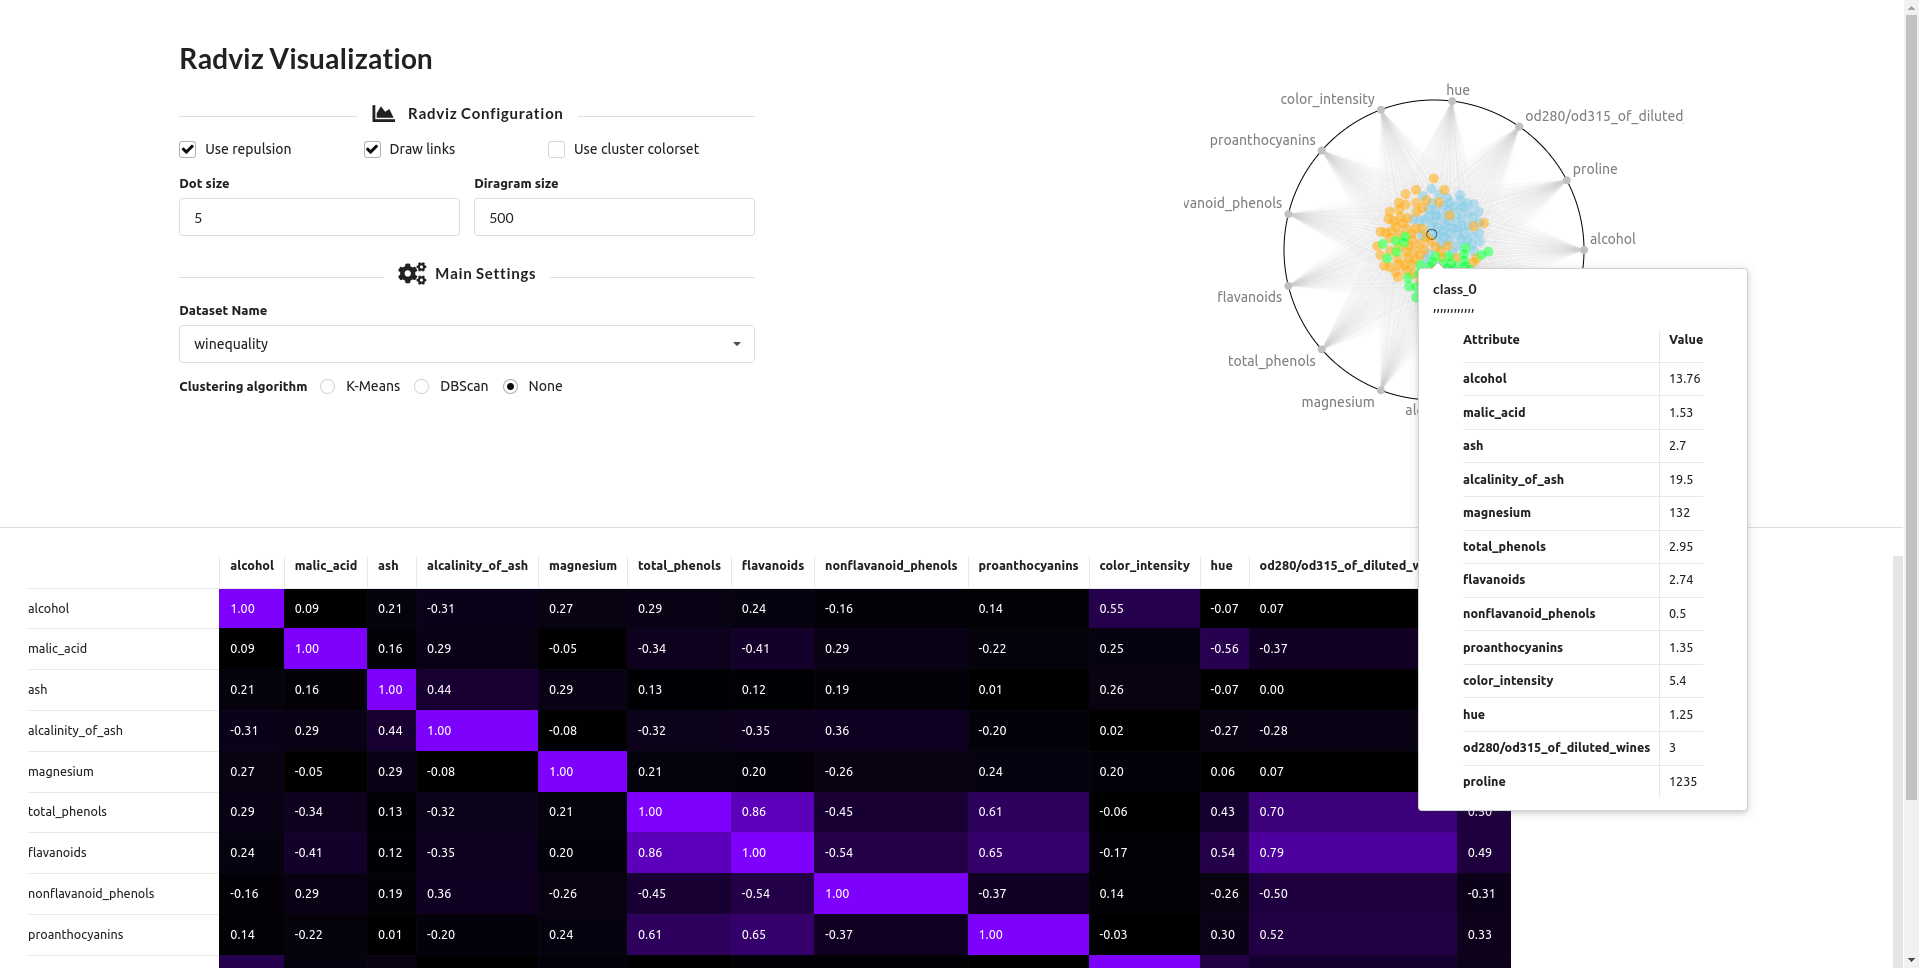
I used biovisualize/radviz as a reference for radviz.js and d3.js.