Spring Boot application sending logs to "Elastic Search Logstash Kibana" demo
With use of microservices, we have been able to overcome many traditional problems and it allow us to create stable distributed applications with desired control on the code, team size, maintenance, release cycle, cloud ennoblement , automation, etc. But it has also introduced few challenges in other areas e.g. "distributed log management" and ability to view logs of full transaction distributed among many services and distributed debugging in general.
Actually the challenge is that microservices are isolated among themselves and they does not share common database and log files. As the number of microservice increases and we enable cloud deployment with automated continuous integration tools, it is very much necessary to have some provision of debugging the components when we have any problem.
Thanks to the open source. We already have bundle of tools which can do the magic if used properly together. One such popular set of tools are Elastic Search, Logstash and Kibana – together referred as ELK stack. They are used for searching, analyzing, and visualizing log data in a real time.
Logstash processes the application log files based on the filter criteria we set and sends those logs to Elasticsearch. Through Kibana, we view and analyze those logs when required.
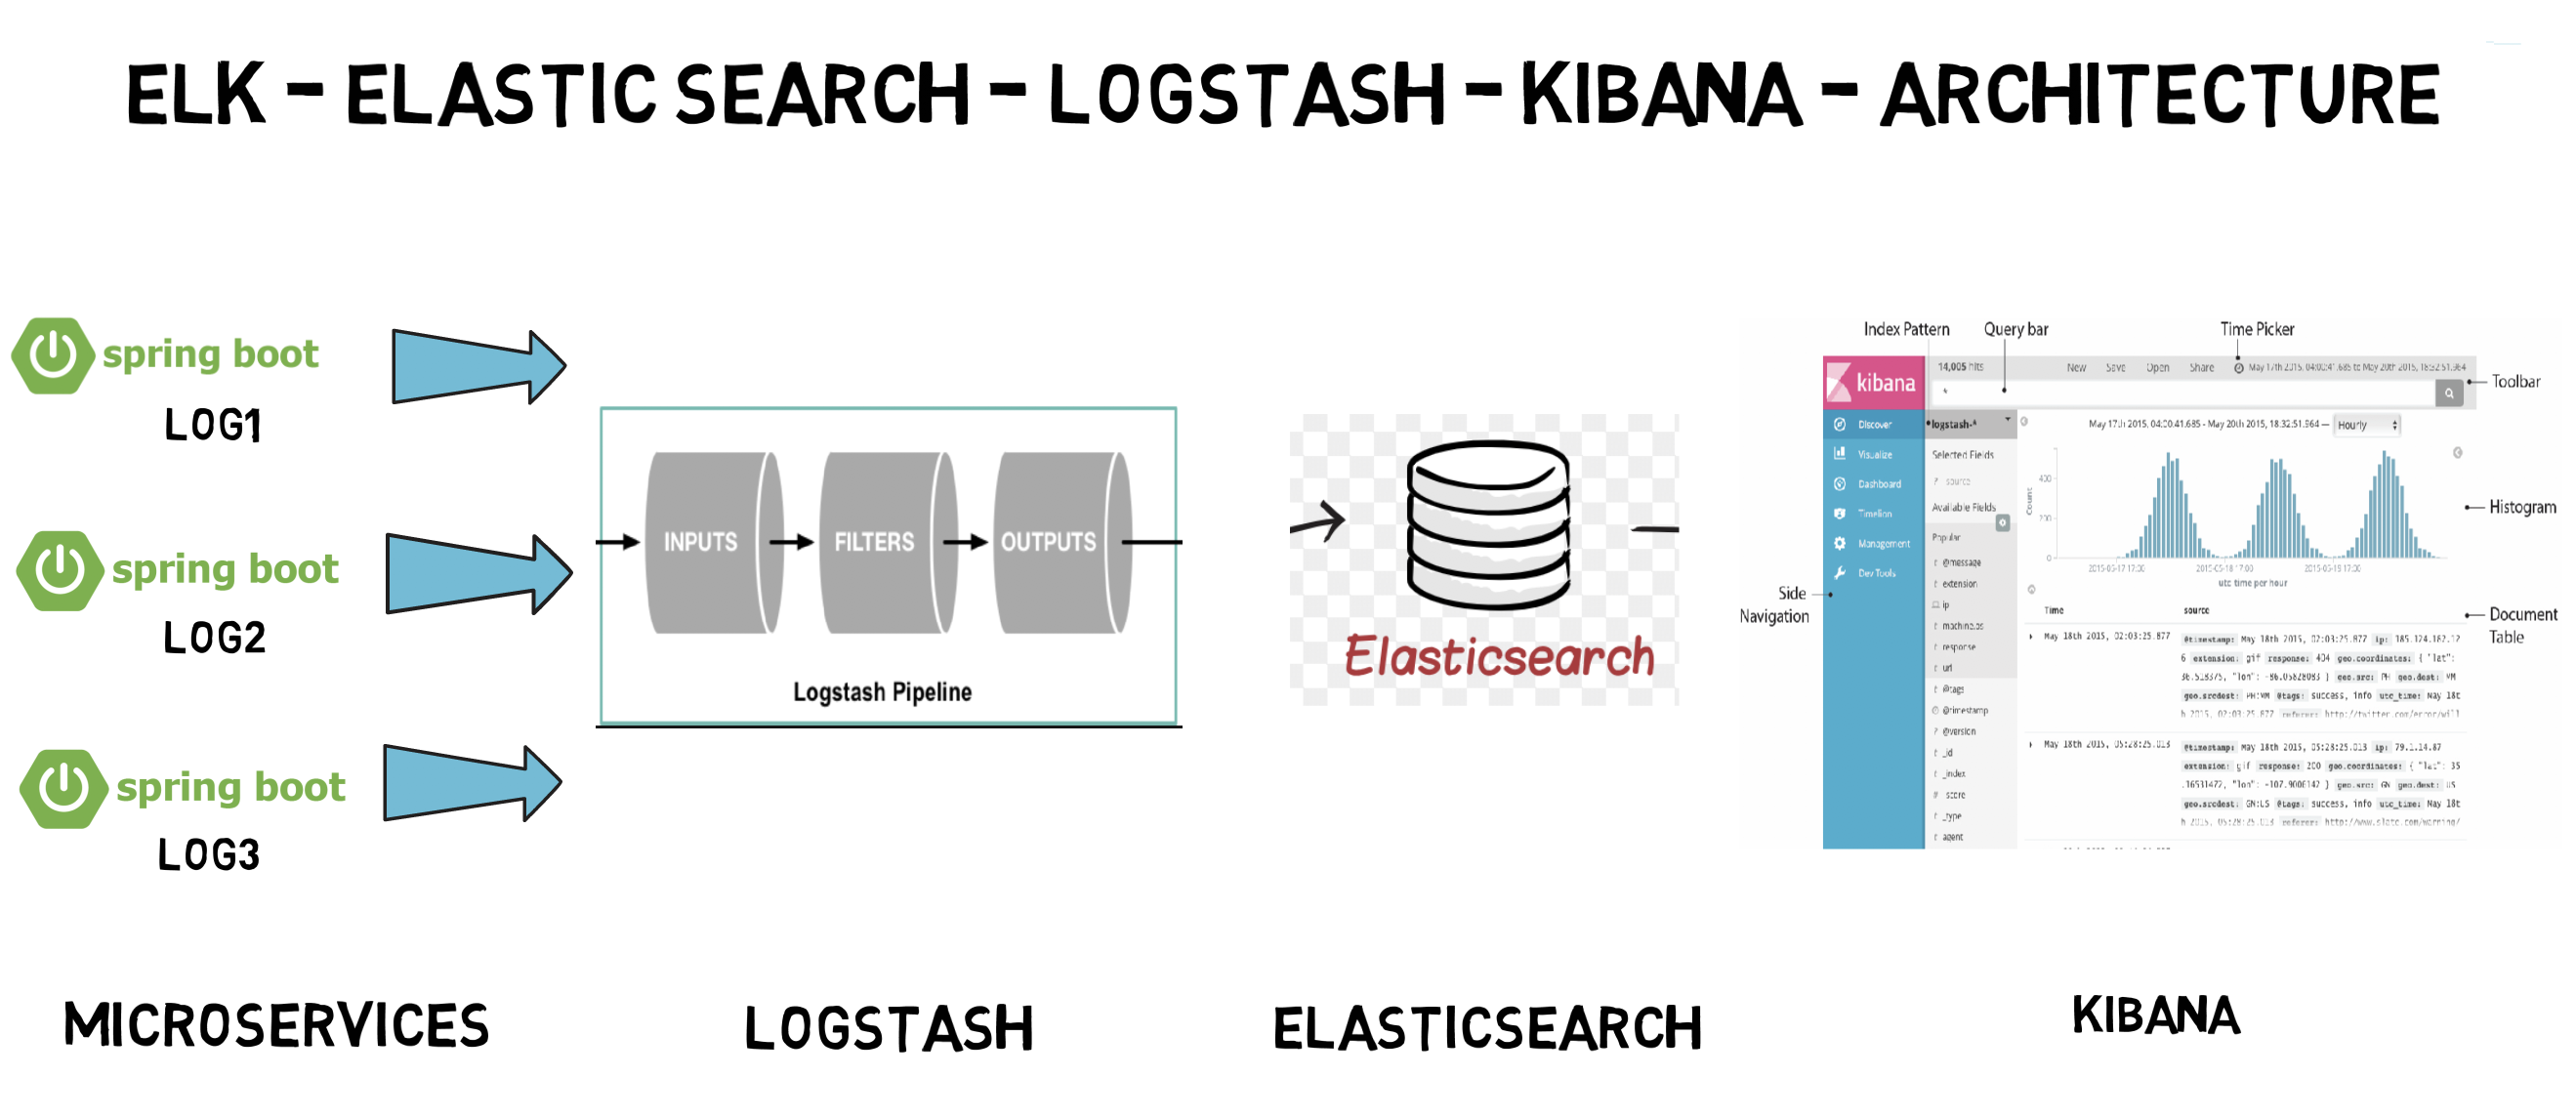
Elasticsearch is a distributed, JSON-based search and analytics engine designed for horizontal scalability, maximum reliability, and easy management.
Logstash is a dynamic data collection pipeline with an extensible plugin ecosystem and strong Elasticsearch synergy.
All these three tools are based on JVM and before start installing them, please verify that JDK has been properly configured. Check that standard JDK 1.8 installation, JAVA_HOME and PATH set up is already done.
Download latest version of Elasticsearch from this download page https://www.elastic.co/downloads/elasticsearch and unzip it any folder. Run bin\elasticsearch.bat from command prompt. By default, it would start at http://localhost:9200
Download the latest distribution from download page https://www.elastic.co/de/downloads/kibana and unzip into any folder. Open config/kibana.yml in an editor and set elasticsearch.url to point at your Elasticsearch instance. In our case as we will use the local instance just uncomment elasticsearch.hosts: "http://localhost:9200" Run bin\kibana.bat from command prompt. Once started successfully, Kibana will start on default port 5601 and Kibana UI will be available at http://localhost:5601
Download the latest distribution from download page https://www.elastic.co/downloads/logstash and unzip into any folder. Create one file logstash.conf as per configuration instructions. We will again come to this point during actual demo time for exact configuration. Now run bin/logstash -f logstash.conf to start logstash
We need to create a logstash configuration file so that it listen to the log file and push log messages to elastic search. Here is the logstash configuration used in the example, please change the log path as per your setup.
input {
  file {
    type => "java"
    path => "<PLEASE_UPDATE_YOUR_LOG_FILE_PATH_HERE>"
    codec => multiline {
      pattern => "^%{YEAR}-%{MONTHNUM}-%{MONTHDAY} %{TIME}.*"
      negate => "true"
      what => "previous"
    }
  }
}

filter {
  #If log line contains tab character followed by 'at' then we will tag that entry as stacktrace
  if [message] =~ "\tat" {
    grok {
      match => ["message", "^(\tat)"]
      add_tag => ["stacktrace"]
    }
  }

 grok {
    match => [ "message",
               "(?<timestamp>%{YEAR}-%{MONTHNUM}-%{MONTHDAY} %{TIME})  %{LOGLEVEL:level} %{NUMBER:pid} --- \[(?<thread>[A-Za-z0-9-]+)\] [A-Za-z0-9.]*\.(?<class>[A-Za-z0-9#_]+)\s*:\s+(?<logmessage>.*)",
               "message",
               "(?<timestamp>%{YEAR}-%{MONTHNUM}-%{MONTHDAY} %{TIME})  %{LOGLEVEL:level} %{NUMBER:pid} --- .+? :\s+(?<logmessage>.*)"
             ]
  }


  date {
    match => [ "timestamp" , "yyyy-MM-dd HH:mm:ss.SSS" ]
  }
}

output {

  stdout {
    codec => rubydebug
  }

  # Sending properly parsed log events to elasticsearch
  elasticsearch {
    hosts => ["localhost:9200"]
  }
}
Once ELK stack is up and running. You could start this demo project and call the REST endpoints , view the logs in KIBANA.
Do a final maven build using mvn clean install and start the application and test by browsing http://localhost:8080/elk or http://localhost:8080/elkdemo or http://localhost:8080/exception
Don’t be afraid by seeing the big stack trace in the screen as it has been done intentionally to see how ELK handles exception message.
Go to the application root directory and verify that the log file i.e. elk-example.log has been created and do a couple of visits to the endpoints and verify that logs are getting added in the log file.
Now when all components are up and running, let’s verify the whole ecosystem.
Go to application and test the end points couple of times so that logs got generated and then go to Kibana console and see that logs are properly stacked in the Kibana with lots of extra feature like we can filter, see different graphs etc in built.
Here is the view of generated logs in Kibana.
